Water use efficiency and yield response factor of common bean subjected to deficit irrigation strategies: a case study in Brazil
1 University of São Paulo/USP-ESALQ, Biosystems Engineering Department, C.P. 09, 13418-900 Piracicaba, SP, Brazil
2 Minas Gerais Agricultural Research Agency/EPAMIG, Experimental Field of Gorutuba, 39525-000 Nova Porteirinha, MG, Brazil
*Corresponding author. Email: caquiloango@usp.br
Abstract. Water-saving strategies are important to cope with water shortages that affect irrigated agriculture. To determine the water use efficiency (WUE) and yield response factor (Ky) of common bean (Phaseolus vulgaris L.) grown under different deficit irrigation strategies, a rain shelter experiment was conducted. Common bean was subjected to five water replacement levels: 100% of field capacity (FC) throughout the growing season (M1; the reference treatment); 75% (M2) and 50% (M3) FC, starting at 20 days after sowing until the end of the growing season; and 75% (M4) and 50% (M5) FC at flowering. Grain yield (GY), yield components, WUE, and Ky were evaluated. Water use efficiency under M3 and M4 was comparable to M1, the highest WUE obtained (1.55 kg·m-3). However, M3 significantly reduced GY (42%), which was mainly caused by the decrease in the number of pods and grains per plant. Therefore, limiting water at 75% FC during flowering (M4) could be viable to avoid yield gaps and maintain higher WUE in water scarce regions. Yield response factor of common bean revealed that the greatest water savings were obtained with the M3 irrigation strategy, reducing crop evapotranspiration by approximately 70%.
Keywords: grain yield, irrigation water applied, Phaseolus vulgaris, water saving.
1. Deficit irrigation strategies at different phenological stages of common beans were evaluated;
2. Water use efficiency and yield response factor of common bean were included;
3. Mild water stress of short duration did not reduce water use efficiency or grain yield;
4. The relationship between irrigation water applied and grain yield showed that water stress reduces productivity independently of phenological stage;
5. Yield response factor of common bean revealed the possibility of obtaining reasonable grain yield and water savings.
Many regions where common bean (Phaseolus vulgaris L.) is produced are rainfed systems which are susceptible to drought stress (Darkwa et al., 2016). Brazil, which is the largest world edible producer of this crop, has 93% of the total area under rainfed conditions (FAOSTAT, 2024). It is estimated that 60% of common bean production occurs under the risk of intermittent or flowering drought stress (Beebe et al., 2013). These conditions cause yield reductions of common bean by up to 80% (Rosales et al., 2012; Lanna et al., 2016).
Irrigation is the best option for reducing yield gaps in agricultural crops by enabling the supply of water in the appropriate quantity for each phase of the growing season (Kang et al., 2021). However, water shortages as part of climate change are reducing the availability of water for agriculture (Darkwa et al., 2016). Deficit irrigation plays a positive role in regions where water is scarce, saving water as well as ensuring yield per unit of planted area (Geerts and Raes, 2009). Previous research has focused on deficit irrigation at specific growth stages (Sánchez-Reinoso et al., 2020) and is scarce on the water replacement levels at which common bean is most efficient in water use. In addition, “all-stage” adaptation to drought is required for cultivation in dry environments, but in common bean this strategy has been poorly studied. Therefore, different deficit strategies both in duration and intensity are expected to help develop water-saving strategies in this crop.
One of the alternatives for evaluating drought response is water use efficiency (WUE), which is defined as the ratio of dry matter production to water use (Geerts and Raes, 2009). Improved WUE in common beans is important for leading to a rational use of resources without adverse effects on production (Webber et al., 2006; Quiloango-Chimarro et al., 2022). The approach to increasing WUE could be made by adopting technologies that increase the proportion of water that is transpired by the crop, and increasing the crop’s capacity to produce biomass and yield per unit of water transpired (Mathobo et al., 2017). An additional approach to consider involves examining the impact of drought by assessing yield response factor (Ky) derived from the correlation between relative yield (compared to yield potential) and relative evapotranspiration (compared to maximum evapotranspiration - no stress), as outlined by Doorenbos and Kassan (1979). In the context of deficit irrigation, exploring both WUE and yield response factor (Ky) can provide a comprehensive understanding of water saving in common beans.
It was hypothesized that water deficit strategies reduce the water use of common bean without significant reductions in grain yield. Therefore, the objectives of this study were to determine the water use efficiency and yield response factor of common bean under mild and moderate water deficit strategies, considering both the entire growing season and specific growth stages (vegetative and flowering).
2.1 Study site, field preparation, and treatment description
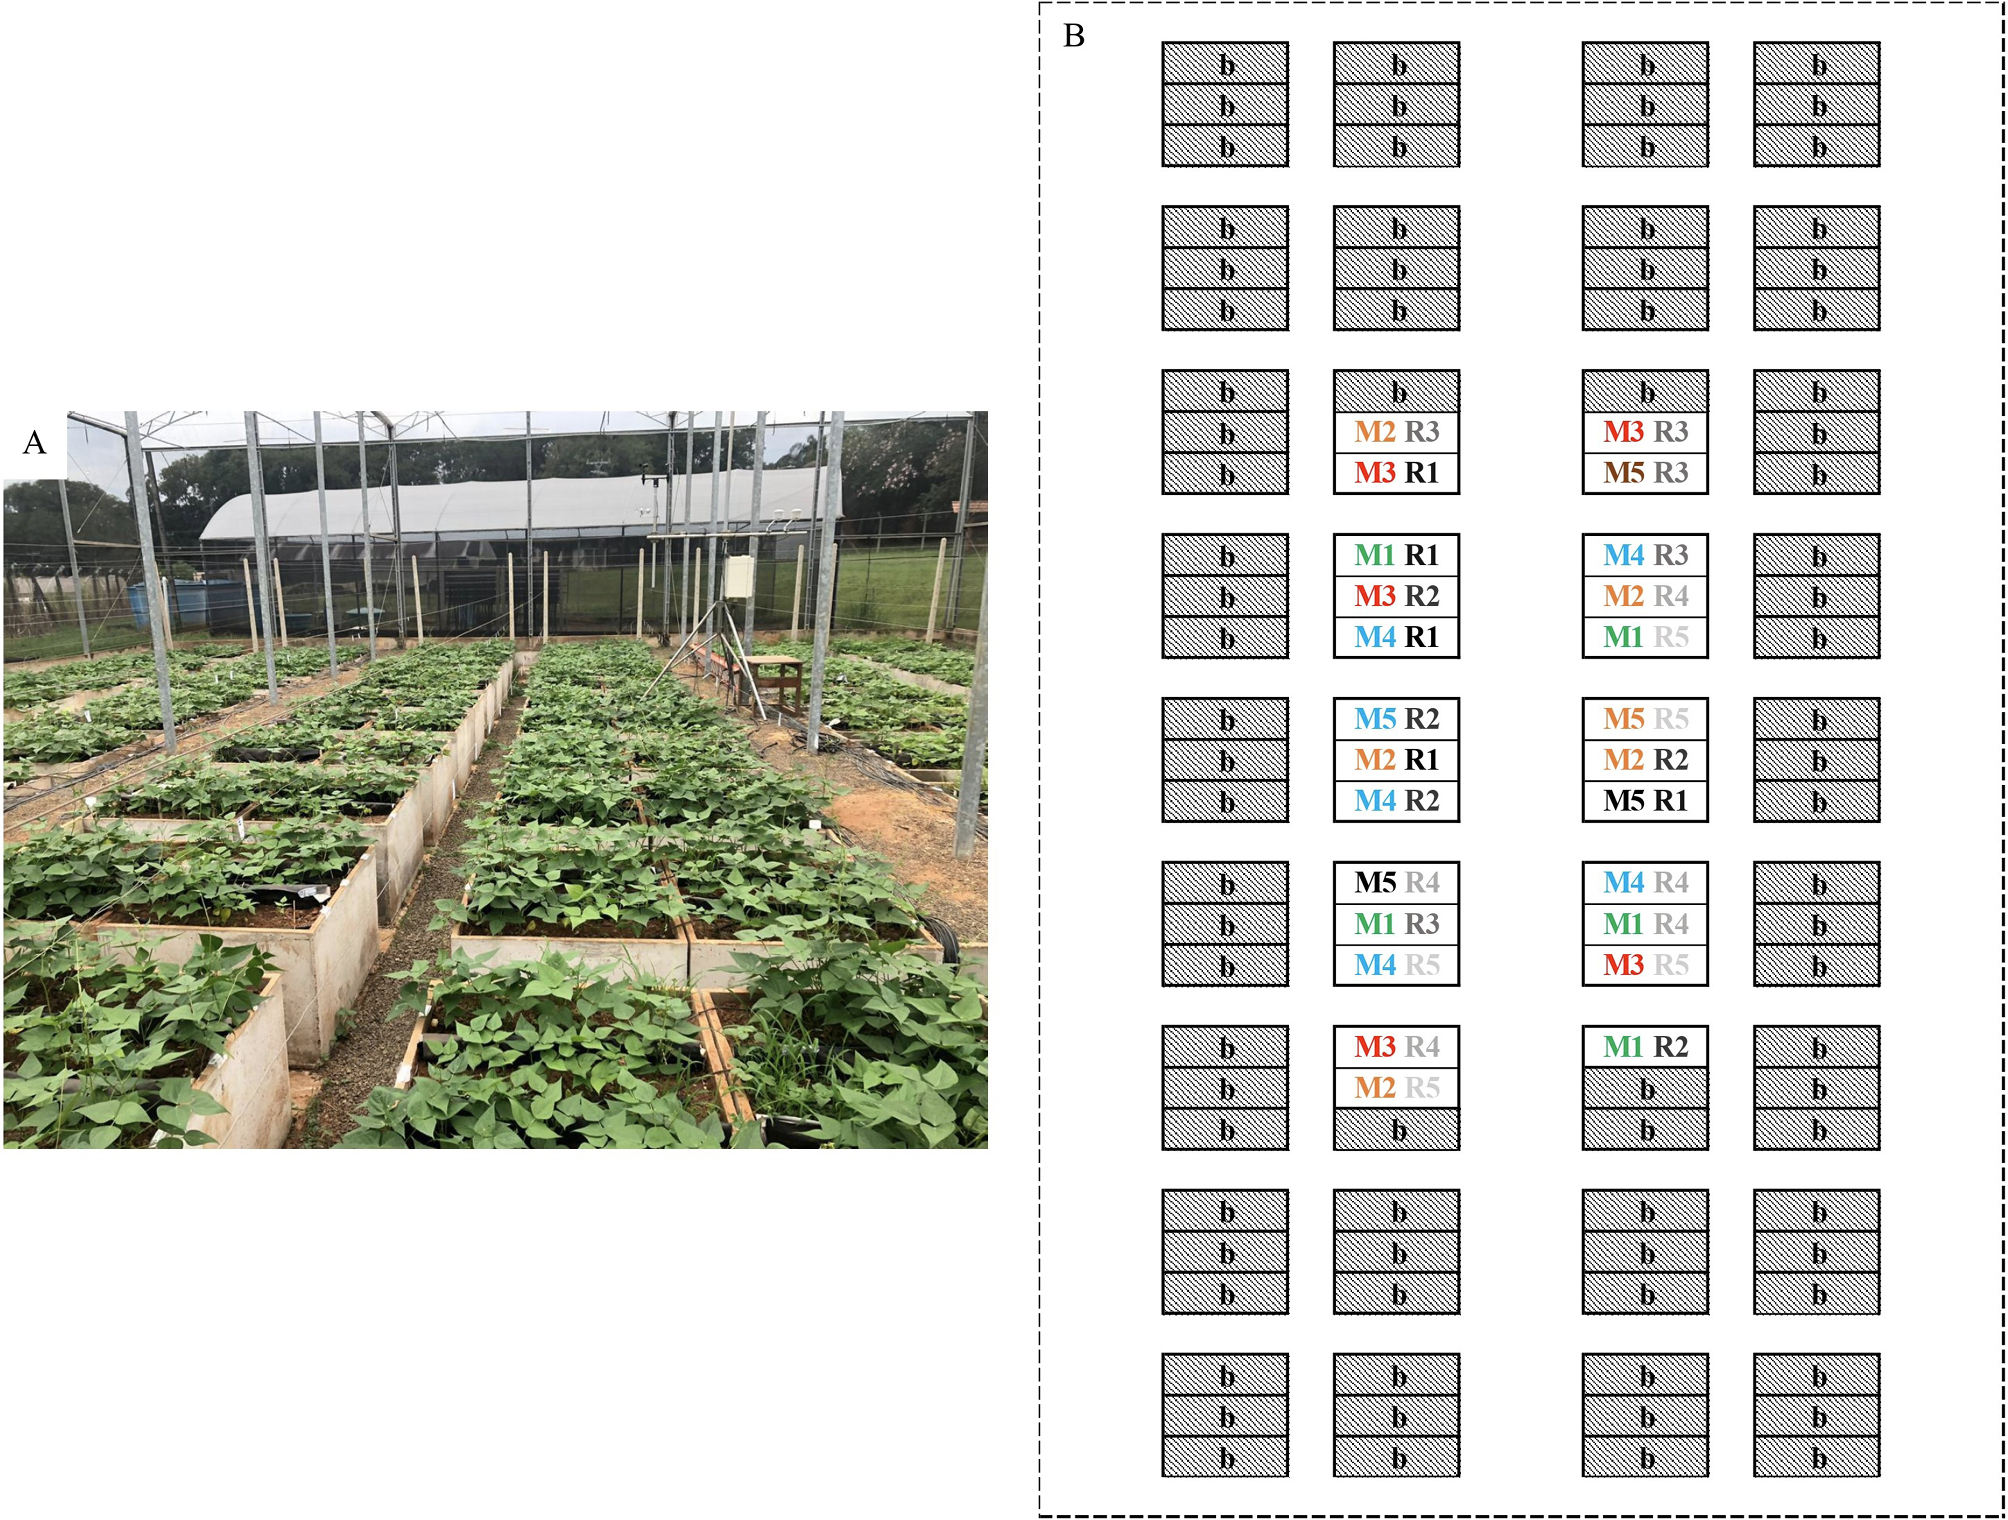
The experiment was carried out under rain shelter conditions in Piracicaba, São Paulo State, Brazil (22°46’39” S, 47°17’45” W, altitude of 570 m) from March to June 2020. The experimental area is specifically designed for water use efficiency experimentation (França et al., 2024; Quiloango-Chimarro et al., 2021) and consisted of a shelter with a ceiling height of 5.2 m, a transparent plastic cover shielded against UV rays, and a black screen on the sides that intercepted 50% of the incident radiation.
TAA Dama, a common bean cultivar, was sown in a single row per plot with an inter-row spacing of 0.1 m (10 plants·plot-1). Each plot consisted of a large waterproofed container with an area of 0.43 m2 and dimensions of 1.04 x 0.41 x 0.76 m (length, width, and depth) filled with soil characterized as Oxisol Typic Ustox with a sandy-loam texture, which was hydro-physically and chemically characterized before the beginning of the experiment. Soil characteristics in the 0-0.4 m layer were: pH (CaCl2) = 5.4; Ca (mg·kg−1) = 560.4; Mg (mg·kg−1) = 84.7; K (mg·kg−1) = 23.4; H + Al (mg·kg−1) = 175.5; P (mg·kg−1) = 21.4; S (mg·kg−1) = 23.3, organic matter (g·kg−1) = 9, dry bulk density (kg·m−3) = 1600, field capacity (m3·m-3) = 0.22, permanent wilting point (m3·m-3) = 0.16, sand (%) = 72.2, clay (%) = 19.7 and silt (%) = 8.0. Fertilization was conducted following the guidelines for São Paulo state (van Raij et al., 1997). Phosphate and potassium fertilizer were applied at rates of 70 kg·ha-1 of P2O5 and 45 kg·ha-1 of K2O, respectively. All the phosphate was applied in the sowing furrow, while potassium was divided into two soil cover applications (sowing and beginning of flowering). Pesticide applications were made when necessary and weed control was conducted manually throughout the growing season.
Air temperature, relative humidity, and global solar radiation were recorded inside the shelter area at 2 m height and the reference evapotranspiration (ETo) was calculated using the Penman-Monteith method (Allen et al., 1998) (Figure 1).
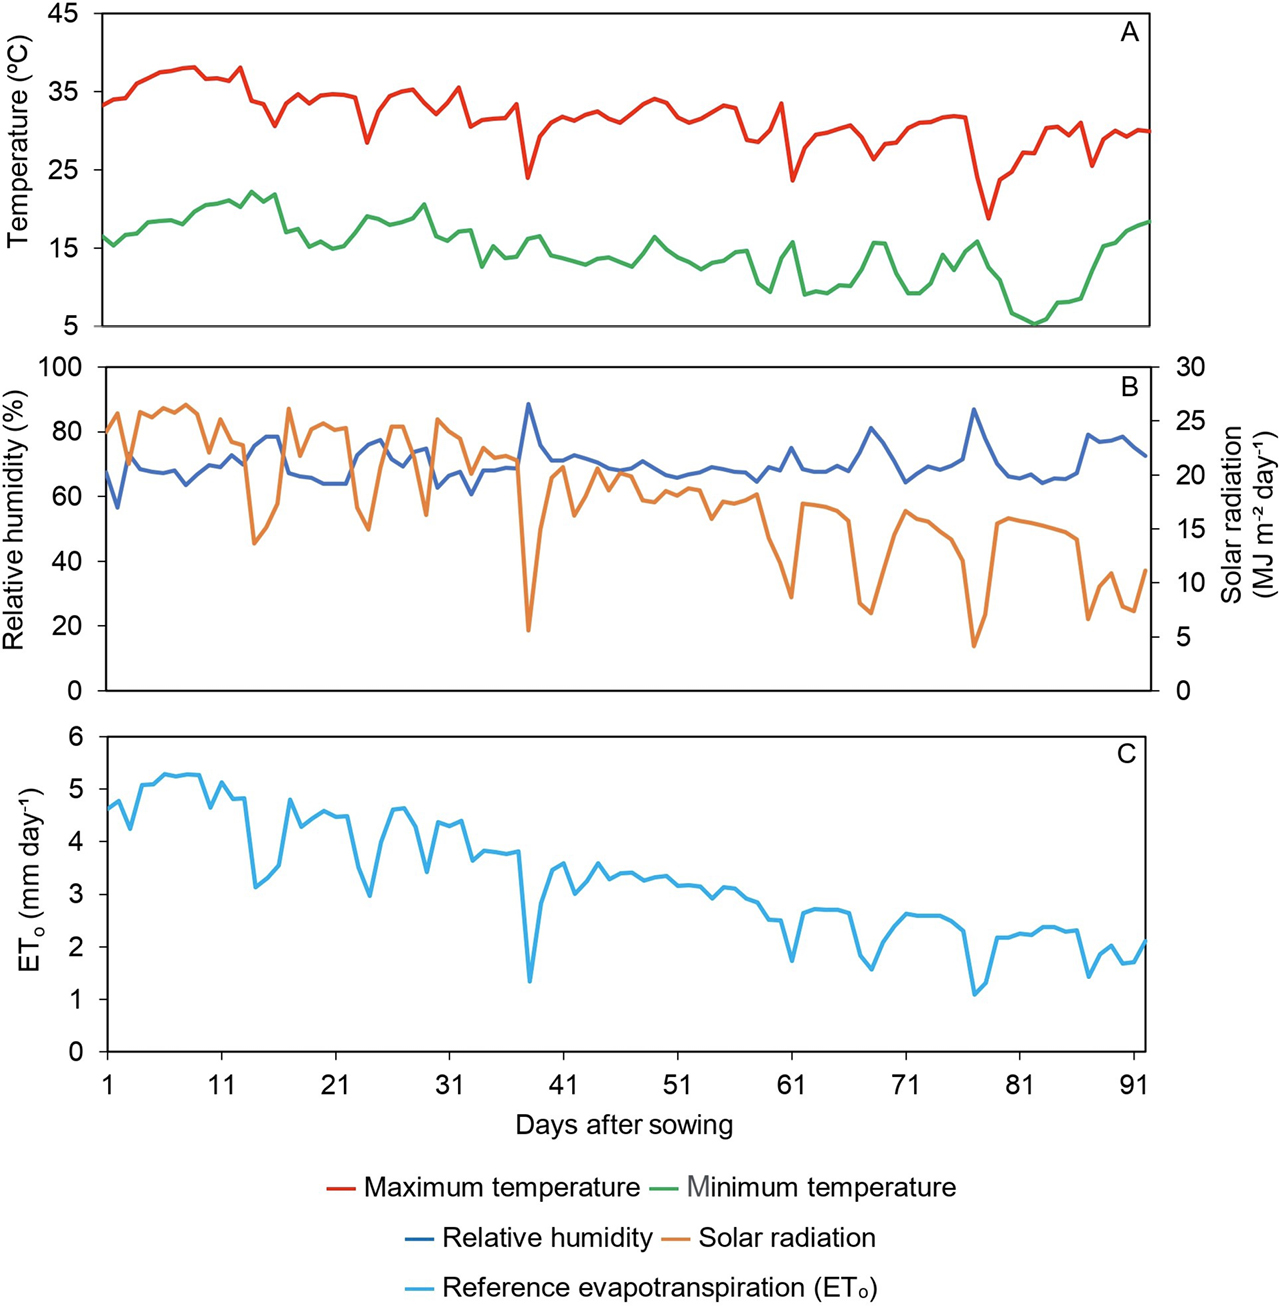
During the experiment, the minimum daily temperature ranged from 5.9°C at 82 days after sowing (DAS) to 22.2°C at 14 DAS. In turn, the maximum temperature varied between 18.8°C and 38.1°C at 78 DAS and 13 DAS, respectively. In general, during the experimental period, the temperature remained within the ideal temperature range for common bean cultivation. The average value for global solar radiation recorded during the experimental period was 16.7 MJ·m-2·day-1, with extremes of 26.5 and 4.1 MJ·m-2·day-1 at 9 and 77 DAS, respectively. The average relative humidity during the period was 71.7%, reaching a maximum value of 88.6% at 38 DAS and a minimum value of 56.6% at 2 DAS. The ETo varied between 1.1 and 5.3 mm·day-1 at 77 DAS and 9 DAS, respectively.
The irrigation treatments consisted of five water replacement levels with five replications distributed completely at random and included: irrigation at field capacity (FC) throughout the growing season (M1); 75 and 50% FC from 20 DAS until the end of the growing season, denominated M2 and M3, respectively; and 75 and 50% FC at flowering (from 40 to 61 DAS), denominated M4 and M5, respectively. In this trial, 75% and 50% FC were considered as mild and moderate drought stress, respectively (Figure 2).
Irrigation water was provided through a drip irrigation system. A small drip line (1 m length) with six emitters was installed in each plot. The emitters were spaced 0.15 m apart and had a flow rate of 0.6 L·h-1, resulting in a flow rate of 3.6 L·h-1 per plot. All plots were controlled individually with micro-registers from a control panel. In each replication of the M1 (full irrigation treatment), a set of three tensiometers was installed at 0.1, 0.3, and 0.5 m depths, providing soil matric potential records for the soil layers 0.0-0.2, 0.2-0.4, and 0.4-0.6 m, respectively, which were monitored every other day. Irrigation for M1 was computed by applying water to bring the soil water to FC the first two layers, while the third layer was used for drainage control. Irrigation was triggered when the soil water potential reached -20 kPa at 0.1 m depth. Volumetric soil water content for each layer before irrigation was estimated from matric potential readings using the van Genuchten approach (van Genuchten, 1980). The other treatments (M2, M3, M4 and M5) received a fraction of the water applied to M1. Plants were irrigated to FC until 20 DAS using the Penman-Monteith approach (Kc initial = 0.35) as described by Allen et al. (1998), when seedlings were well established.
2.3 Yield measurement and calculation of WUE and Ky
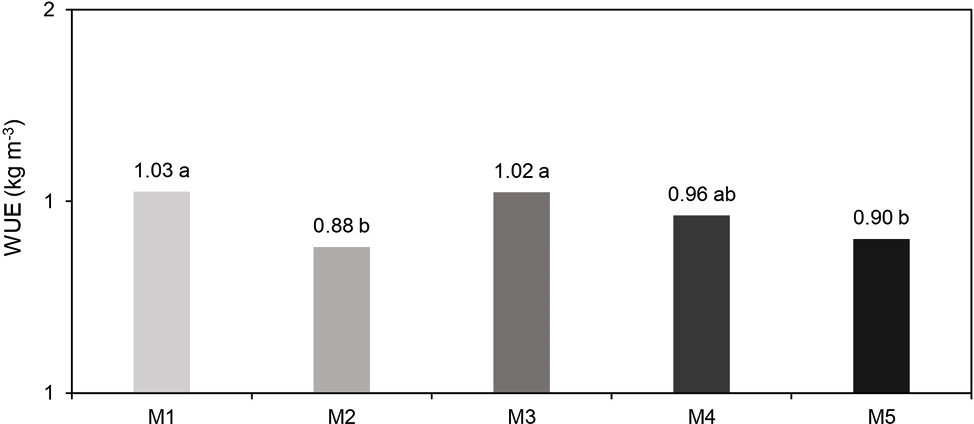
At physiological maturity, plants from the central part of the row were harvested (5 plants) and were dried in a forced-ventilation oven at 60°C for 72 h. The number of pods per plant (PP), total number of grains per plant (TNG), number of grains per pod (NGP) and grain yield (GY) (kg·ha-1) were obtained. WUE (kg·m-3) was calculated for each treatment as the ratio of the GY (kg·ha-1) to the total volume of irrigation water applied (IWU) (mm), using equation 1:
(1)
Ky was calculated for each treatment as the ratio of the relative yield (1 – (Ya·Ym-1)) to the relative evapotranspiration (1 – (ETa·ETm-1)), using equation 2:
(2)
where Ya is the actual yield, Ym is the maximum yield, ETa is the actual evapotranspiration and ETm is the maximum evapotranspiration. A Ky value greater than 1 indicates that yield loss exceeds the proportional reduction in water availability; a Ky value less than 1 suggests that yield loss is less severe than the water deficit; and a Ky value equal to 1 means that yield reduction is directly proportional to the water deficit. In this study, the yield and evapotranspiration of treatment M1 (100% of FC throughout the growing season) were considered to be equal to Ym and ETm, respectively, and the yield and evapotranspiration of the other treatments to be Ya and ETa. Actual evapotranspiration represents the amount of water used by the crop, which in deficit irrigation treatments is typically equal to the water supplied (Djaman and Irmak, 2012).
All the statistical analyses were performed with R Studio (R Project for Statistical Computing, version 4.1.2). One-way analysis of variance (ANOVA) was performed after testing the homogeneity of variances and normality of the residuals by the Levene and Shapiro-Wilk tests, respectively. The means were compared with the Fisher Least Significant Difference (LSD) at 5% probability.
3.1 Irrigation water applied (IWU)
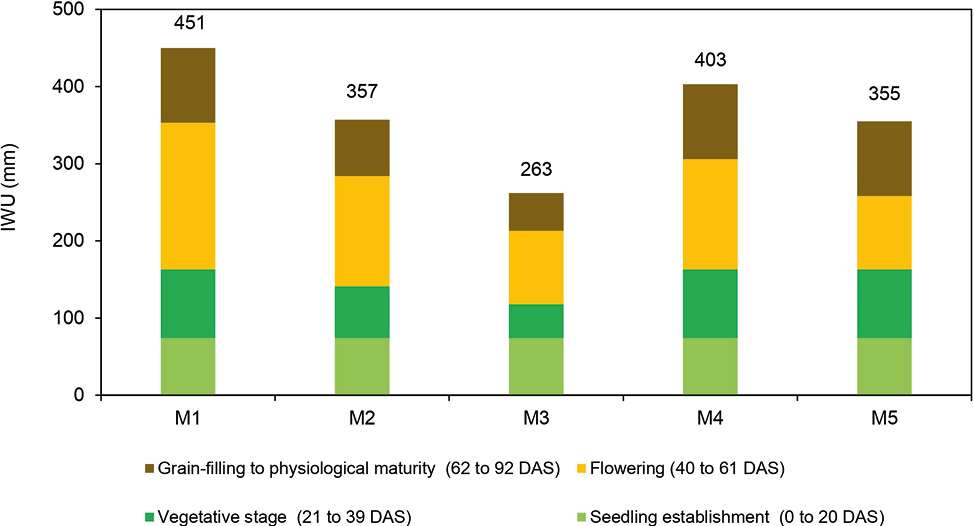
The total amount of IWU to the experimental common bean differed depending on the strategies irrigation treatments (Figure 3). 451, 357, 263, 403 and 355 mm of irrigation water were applied throughout the growing season in treatments M1, M2, M3, M4 and M5, respectively. At the seedling establishment stage (0 to 20 DAS) all treatments received 74 mm of irrigation water. In the vegetative stage (21 to 39 DAS) the IWU in treatments M1, M4 and M5 was 89 mm and in treatments M2 and M3 it was 67 and 44 mm. During flowering (40 to 61 DAS) the crop received the highest amount of irrigation water, 190, 143, 95,143 and 95 mm for treatments M1, M2, M3, M4 and M5, respectively. During grain-filling to physiological maturity (62 to 92 DAS) the IWU was 97, 73, 49, 97 and 97 mm for treatments M1, M2, M3, M4 and M5.
3.2 Grain yield and grain yield components
Grain yield decreased as drought stress increased, except for M4, which was similar to M1 (Table 1). Under field conditions, Calvache et al. (1997) reported significant yield decreases when water limiting was applied during all the growing season as well as at flowering. The yield penalty in common bean is variable due to differences in the timing and intensity of drought stress (Heinemann et al., 2016; Galvão et al., 2019; do Nascimento Silva et al., 2020). Therefore, the non-significant yield reduction of M4 could be associated with the high frequency of irrigation and the water replacement level used.
| Treatment | Grain yield (kg·ha-1) | Pods per plant | Grains per pod | Grains per plant |
|---|---|---|---|---|
| M1 | 4625 ± 759 a | 19.9 ± 3.8 a | 4.6 ± 0.3 | 92 ± 15.3 a |
| M2 | 3145 ± 685 bc | 14.4 ± 2.6 bc | 4.5 ± 0.8 | 64 ± 9.7 bc |
| M3 | 2693 ± 404 c | 11.9 ± 1.5 c | 4.6 ± 0.2 | 56 ± 6.3 c |
| M4 | 3883 ± 849 ab | 17.3 ± 3.8 ab | 4.7 ± 0.6 | 83 ± 24.1 ab |
| M5 | 3202 ± 607 bc | 15.9 ± 3.4 b | 4.5 ± 0.3 | 68 ± 11.1 bc |
| LSD (0.05) | 1071 | 4.7 | ns | 22 |
| Each value represents the mean ± standard deviation. Treatments with the same letters within a column do not differ from each other at the 5% probability level by the LSD test (p < 0.05). M1 = 100% of field capacity (FC) throughout the growing season; M2 = 75% FC from 20 days after sowing until the end of the growing season; M3 = 50% FC from 20 days after sowing until the end of the growing season; M4 = 75% FC at flowering; M5 = 50% FC at flowering. ns, no significant. | ||||