Validation of the leaf area index estimated using the extinction coefficient of photosynthetically active radiation in soybean
1 Researcher, Agronomy Course Coordination, Faculdade Marechal Rondon (FARON), Vilhena, RO, Brazil
2 Researcher, Climate and Water Resources Coordination, Instituto Nacional de Pesquisas da Amazônia (INPA), Manaus, AM, Brazil
3 Researcher, Brazilian Agricultural Research Corporation (EMBRAPA Agricultura Digital), Campinas, SP, Brazil
4 Researcher, Environmental Dynamics Coordination, Instituto Nacional de Pesquisas da Amazônia (INPA), Manaus, AM, Brazil
5 Undergraduate student, Agronomy Course, Faculdade Marechal Rondon (FARON), Vilhena, RO, Brazil
*Corresponding author. E-mail: crestanimota@gmail.com
Abstract. Techniques to monitor vegetation cover have been used to track the biomass and yield of agricultural crops. Quantifying the leaf area index (LAI) and its variation throughout the production cycle of soybean is important because this data can be used as an input variable in growth and productivity models. Field experiments were carried out during the 2017/2018 and 2018/2019 growing season in soybean crops at the Faculdade Marechal Rondon (FARON) in Vilhena, RO, Brazil, to measure the LAI of cultivar 75I77 RSF IPRO from the estimated extinction coefficient of photosynthetically active radiation (PAR). LAI measurements were performed weekly in the 2018/2019 crop season. The PAR data were collected using the PAR Apogee® SQ-316-S linear sensor. The light extinction coefficient (Kc) was calculated using LAI and solar radiation interception data. A Kc value of 0.687 was found for this crop, indicating that more than 68% of the light was intercepted by the plant structure. In addition, the LAI data estimated via Kc were compared with LAI values estimated with the CROPGRO-Soybean model. The first method estimated the LAI values better than the second, as the r² increased from 0.738 to 0.882, the difference was reduced from 19.9 to 13.3%, and the d-value changed from 0.815 to 0.952. Thus, the extinction coefficient method of PAR can efficiently estimate the LAI parameter in soybean.
Keywords: shortwave radiation, light extinction coefficient, photosynthetic efficiency, crop parameterization, yield improvement.
Index
2.1 Characterization of the experimental area
2.2 Determination of the Leaf Area Index (LAI)
2.2.1 Field sampling method and Leaf Area Index estimation
2.2.3 Leaf Area Index simulated by the Cropgro-Soybean agricultural model
2.3 Calibration and validation of the Cropgro-Soybean agricultural model
During the development cycle of agricultural crops, the variation of the vegetation cover fraction (fc) and the leaf area index (LAI) are biophysical parameters considered fundamental in vegetation dynamics (Chechi et al., 2021). They provide a better understanding of the partitioning of crop evapotranspiration in plant transpiration and soil water evaporation coefficients (Paredes et al., 2017; Allen and Pereira, 2009). Also, LAI is useful to infer about the fraction of the photosynthetically active solar radiation (PAR) intercepted by the plant canopy (Purcell et al., 2002), and the dry matter of crops (Li et al., 2010). Chechi et al. (2021) highlighted that fc and LAI are often used as mandatory variables in agricultural models, including AquaCrop (Foster et al., 2017), SIMDualKc (Paredes et al., 2017), CSM-CROPGRO (Cuadra et al., 2021; Crestani Mota et al., 2024), and Agro-IBIS (Moreira et al., 2023).
The radiation impinging on the canopy can be reflected, absorbed or transmitted. The radiation flux that is transmitted to the soil decreases exponentially as the leaf area increases in the canopy (Jones, 2014). According to Adeboye et al. (2016), under optimal environmental conditions, the accumulation of biomass through the photosynthetic process is strongly correlated with the radiation absorbed by plants in the spectral range of the PAR, which corresponds to visible wavelengths (400 to 700 nm).
The absorbed PAR is a fundamental parameter in the modeling of soybean growth and yield, because as the plant foliage increases (and so LAI), the use efficiency of this radiation increases, and improves the accumulation of plant dry matter, especially in grains (Fontana et al., 2012). However, the characterization of the internal distribution of the PAR to the plant canopy is not uniform, considering the canopy architecture (spatial orientation) and the spectral properties of the leaves (Plénet et al., 2000; Jones, 2014).
Monsi and Saeki (1953) were the first to analyze the modification of the Lambert-Beer radiation extinction law through a model of light energy distribution along the plant canopy for homogeneous areas of agricultural cultivation with dense leaf development. In this model, the exponential reduction of radiation with increasing LAI is associated with an extinction coefficient (Kc; dimensionless) of the PAR (Bréda, 2003).
Hence, the proportion of intercepted PAR is directly related to the LAI of the crop and the Kc characteristic of the species (Shibles and Weber, 1965; Pengelly et al., 1999; Schöffel and Volpe, 2001). These factors influence leaf area production (leaf mass ratio), duration of the leaf area, and the potential of phytomass production (Mayers et al., 1991ab). Therefore, the biomass production is a function of the integrated PAR intercepted by the culture (fIPAR), where the angular coefficient of the regression curve between biomass (dry matter) and PAR defines the light use efficiency for phytomass production (Shibles and Weber, 1966).
However, the light use efficiency for biomass production is not constant, as it varies during the plant cycle (Steinmetz and Siqueira, 1995). For instance, it can vary between cultivars and with the development phases of irrigated rice, reaching the highest values between the differentiation of the floral primordium and flowering (Steinmetz and Siqueira, 2001). Also, light use efficiency can vary between the subperiods of crop development. In maize, it was 1.71 g MJ-1 from emergence to the ninth expanded leaf and 3.58 g MJ-1 from the end of the vegetative subperiod to grain filling (Müller et al., 2001).
Soybean biomass yield can also be analyzed in terms of interception efficiency and conversion of the PAR to phytomass (Mayers et al., 1991ab). During the first 42 days of the vegetative stage, the light use efficiency (conversion of the PAR to phytomass) of two soybean cultivars was 1.2 and 1.32 g MJ-1 (Muchow, 1985). The light use efficiency of the aerial part accumulated from the emergence to initial flowering can be linear. For example, in ten soybean cultivars light use efficiency was linear during the dry season (1.15 g MJ-1); however, there was a large dispersion of the data during the flowering phase (Mayers et al., 1991a).
Most soybean growth models use a constant Kc value (fixed average) throughout the crop cycle and for the complete canopy. However, the timing of a specific phenological stage can vary in different locations and years due to factors such as sowing season, soil moisture, air temperature, and management practices (Sakamoto et al., 2010), as well as structural conditions, leaf age, and photosynthetic and respiratory characteristics of plants (Costa et al., 1996). Thus, the on-site observation of dates and values of these variables limits the use of many agricultural models because conducting observations requires time and resources.
This study aimed to evaluate the accuracy and consistency of LAI estimation in soybean based on the Kc of PAR. For this purpose, both observed and Kc-estimated LAI values were computed throughout the crop’s phenological cycle, enabling a detailed comparison with simulations generated by the CROPGRO-Soybean model.
2.1 Characterization of the experimental area
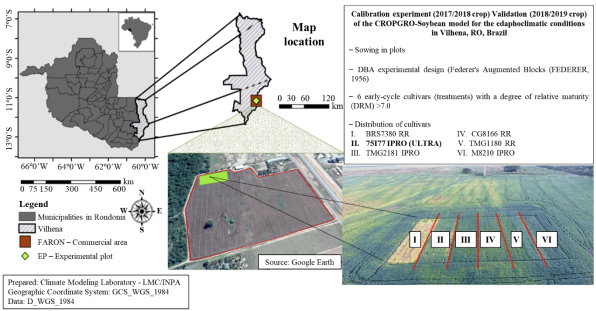
The experiment was conducted during the 2017/2018 and 2018/2019 crop seasons at the Faculdade Marechal Rondon (FARON), in the municipality of Vilhena, RO, Brazil, whose geographical coordinates are 60°05´ W and 12°46´ S, at 600 m altitude (Figure 1). The field plots were located in the mesoregion known as the Southern Cone of Rondônia (SCRO), where soybean is normally sown in the no-tillage system as a succession crop with maize (Nóia Júnior and Sentelhas, 2019). The predominant soil of the region is classified as dystrophic Red-Yellow Latosol, characterized by a flat relief (Crestani Mota et al., 2024). The climate is the Am type, defined as rainy tropical with a well-defined dry season (Alvares et al., 2013). The average annual rainfall and temperatures are 2,200.0 mm and 24.6 °C, respectively.
2.2 Determination of the Leaf Area Index (LAI)
2.2.1 Field sampling method and Leaf Area Index estimation
The LAI was obtained every two weeks during the 2017/2018 crop season and every week during the 2018/2019 crop by employing the software Digital Area Determiner (DDA – Determinador Digital de Áreas) version 20.0 (Ferreira et al., 2008). Beginning 35 days after sowing (DAS), three plants from the soybean plot were randomly collected until full maturation. The leaves of each plant collected in the field were separated and placed in a tabletop scanner connected to a microcomputer. The leaves were digitized on a monochrome scale, generating a file of single images or several BITMAP files (.bmp) of images with the areas to be measured. Then the files were processed in the DDA to directly obtain the mean LAI, from the scans of the leaves from the three plants. To reduce the experimental error during the collections, the plants of the external lines and the plants present in the initial and final 0.5 m of the plot were not collected.
The variation in sampling frequency between the 2017/2018 (biweekly) and 2018/2019 (weekly) crop seasons reflects a methodological refinement intended to improve the temporal resolution and accuracy of LAI estimation. Although the biweekly sampling was sufficient to characterize overall canopy development, we decided to improve the accuracy of the output by increasing the sampling frequency in the second season (to weekly intervals) in to order to more accurately capture the rapid changes in leaf area during key phenological stages, particularly the vegetative and early reproductive phases.
2.2.2 Leaf Area Index Estimated from the Extinction Coefficient of the Photosynthetically Active Radiation
To determine the Kc of the PAR on the canopy of the cultivar sown in the present study and, to obtain LAI measurements for the complete development cycle of the cultivar, measurements of the incident PAR (PARin) and intercepted PAR (PARint) were performed for both crop season, using the PAR Apogee® SQ-316-S bar sensor (Figure 2).
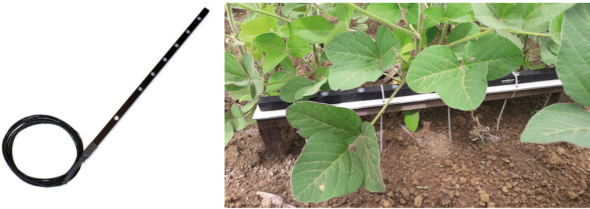
The sensor was installed in the plot sown with the 75I77 RSF IPRO (ULTRA) cultivar positioned in the row line and fixed 0.1 m from the ground. Measurements were taken until the reproductive stage of soybean when green leaves were still present. As described by Zdziarski et al. (2018), this soybean cultivar is technically recommended for macro-region 4 and edaphoclimatic zone 402, particularly in areas situated at elevations above 400 m. Thus, LAI of this cultivar was monitored under field conditions in the municipality of Vilhena, within the recommended sowing window from October 10 to November 15, to ensure alignment with its optimal agronomic performance. In addition, this medium-cycle cultivar was estimated at 104 days and small size, with a low branching index but high productive potential, and its population ranges from 320 to 380 thousand plants per hectare (www.brasmaxgenetica.com.br).
Equations 1 and 2 were used to obtain the fraction of the PAR intercepted (fIPAR; dimensionless) by the canopy. The seasonal average Kc of the PAR was determined through destructive measurements of LAI (performed at seven-day intervals throughout the 2018/2019 crop season, from 35 DAS) and fIPAR (initiated four DAS during the 2018/2019 crop), using Equation 3. The estimated LAI, fIPAR, and Kc values are presented in Table 1.
(1)
(2)
| Cultivar | Year | DAS | Day | Month | LAIestimated | - ln (1 - fIPAR) | Kcestimated |
|---|---|---|---|---|---|---|---|
| 75I77 RSF IPRO (ULTRA) |
2018 | 31 | 1 | Dec | 1.5 | 0.838 | 0.555 |
| 2018 | 38 | 8 | Dec | 2.1 | 1.296 | 0.617 | |
| 2018 | 46 | 16 | Dec | 3.4 | 1.847 | 0.546 | |
| 2018 | 52 | 22 | Dec | 3.6 | 2.710 | 0.753 | |
| 2018 | 59 | 29 | Dec | 4.2 | 3.225 | 0.770 | |
| 2019 | 66 | 5 | Jan | 3.6 | 3.151 | 0.868 | |
| 2019 | 73 | 12 | Jan | 3.3 | 2.186 | 0.843 | |
| 2019 | 80 | 19 | Jan | 3.0 | 2.079 | 0.702 | |
| 2019 | 87 | 26 | Jan | 2.3 | 1.215 | 0.528 | |
| Mean | 0.687 |
Where PARin is the incident photosynthetically active radiation (μmol m-2 s-1); PARint is the intercepted photosynthetically active radiation (μmol m-2 s-1); LAI is the leaf area index (dimensionless); Kc is the PAR extinction coefficient (dimensionless); and fIPAR is the fraction of the PAR intercepted by the canopy (dimensionless). For comparison, the data were transformed into MJ m-2 day-1, using the conversion value developed by Thimijan and Heins (1983), by Equation 4:
(4)
Where t is the time between collections (300 s) and 4.57 is the conversion factor. All values were integrated for a 24 h period.
2.2.3 Leaf Area Index simulated by the Cropgro-Soybean agricultural model
The CROPGRO-Soybean agricultural model (Boote et al., 1996) in version 4.7.5 of the DSSAT (dssat.net) was used to simulate the LAI throughout the development cycle of cultivar 75I77 RSF IPRO (ULTRA). This mechanistic model considers all soybean development processes, from photosynthesis to the partition of photoassimilates, through the growth of leaves, stems, and roots, soil water extraction, and transpiration, in response to meteorological variations (Hoogenboom et al., 2012). The model can simulate the performance components (soil moisture and evapotranspiration; dry biomass – leaves, pods, stem, and petiole; leaf expansion through the LAI; and grain yield), quantifying and tracing the daily growth of the crop to the stages of physiological maturity and harvest (Confalone et al., 2016).
2.3 Calibration and validation of the Cropgro-Soybean agricultural model
The CROPGRO-Soybean model was calibrated for the experimental conditions of the 2017/2018 crop season and validated in the 2018/2019 crop season, following the recommendations of Hoogenboom et al. (2003) and Jones et al. (2003) through the method of sensitive adjustments and minimization of variable error (Fensterseifer et al., 2017). First, the following sets of phenological information were established: dates of sowing, emergence, flowering, and physiological maturation, weight of one thousand grains (PMG), and yield of cultivars (kg ha-1) under field conditions. Then, the genetic-specific parameters of the cultivar 75I77 RSF IPRO (ULTRA) were adjusted based on growth data (maximum leaf area, maximum photosynthetic rate, and specific leaf area), development (number of nodes, date of emergence, and reproductive stages R1 – beginning of flowering, R3 – beginning of pod formation, R5 – beginning of grain filling, and R7 – beginning of maturation) and yield components (number of grains per square meter and average weight of a grain) (Cera et al., 2017). Data were collected in the experimental field at the FARON during the two harvests. The phenological development of the crops was monitored according to the scale of Fehr and Caviness (1977), and the counting of data in days followed the Julian calendar, starting on the date of emergence.
To evaluate the performance of the LAI estimated from the Kc of the PAR in comparison with the CROPGRO-Soybean model, the following statistical indices were used: coefficient of determination (r2) (Equation 5), percentage deviation (Pd) (Equation 6), root mean square error (RMSE) (Equation 7), and the agreement index (d-value) of Willmott (1982) (Equation 8).
(5)
(6)
(7)
(8)
Where n is the number of observations; Pi is the simulated values; is the mean of the simulated values; Oi is the observed values; and is the mean of the observed values.
On a ground area basis, at the beginning of the plant cycle, until approximately 48 DAS, the crop used the PAR that reached the plant less efficiently. The observed measurements indicated that the maximum intercepted PAR was 4.3 MJ m-2 day-1 (60 DAS) when the fraction of leaf cover in the canopy projected over the area of 1 m2 of soil reached 98.3% in the R5 stage. While the simulated intercepted PAR reached the maximum light use efficiency of 8.9 MJ m-2 day-1 (at 55 DAS), when the leaf cover fraction reached 97.3%, also during the R5 stage (Figure 3). The decline in the intercepted PAR, both observed and estimated, began with leaf senescence in R6, either at around 72 DAS for the field conditions or at 65 DAS for the CROPGRO-Soybean model, respectively. The anticipated drop in simulated interception was due to the overestimates of the LAI at the beginning of the cycle of this cultivar when the model anticipated the emission of leaves favoring maximum growth (4.6 cm2 cm-2) seven days before the greatest leaf expansion was observed.
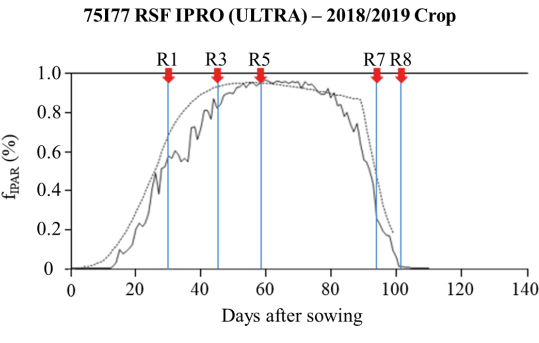
For field conditions, the 75I77 RSF IPRO (ULTRA) cultivar achieved 96% of PAR interception, between 60 and 70 DAS, and approximately 95%, between 50 and 63 DAS in the CROPGRO-Soybean simulation (Figure 3). Results follow those obtained by Confalone and Dujmovich (1999) for the edaphoclimate of the central-eastern region of the province of Buenos Aires, Argentina, where the 1998/1999 crop exhibited a 95% level of radiation interception 78 days after emergence, when the indeterminate growth cultivar Asgrow 4656 presented a maximum LAI of 5.3 in R4. Souza et al. (2009) during field experiments carried out in the municipality of Paragominas, PA, Brazil, found for the cultivar BRS Tracajá (indeterminate cycle) 99% interception of the PAR between 70 and 96 DAS (R4 and R5), when the maximum Kc and LAI were 0.717/4.1 and 0.715/6.5 for the 2007/2008 and 2008/2009 crops, respectively. Similarly, Costa et al. (1999) found values of maximum radiation interception (99%) occurring between 70 and 96 DAS for soybeans grown under different irrigation conditions throughout the cycle in the Southeastern region of Brazil.
According to Souza et al. (2009), the increased efficiency in the use of the PAR found during the reproductive phase of soybean is reflected in most of the results found for this crop (Confalone and Dujmovich, 1999; Schöffel and Volpe, 2001; Santos et al., 2003; Adeboye et al., 2016). The same authors reported that this increase is closely linked to the progressive accumulation of vegetative and reproductive biomass, becoming markedly significant from the V5 vegetative stage onward. This elevated efficiency persists through subsequent phenological phases and remains pronounced until the onset of the R5 reproductive stage, a critical period when the physiological transition toward reproductive phase occurs, marked by the remobilization of photoassimilates from source tissues to developing sink organs, primarily for grain filling.
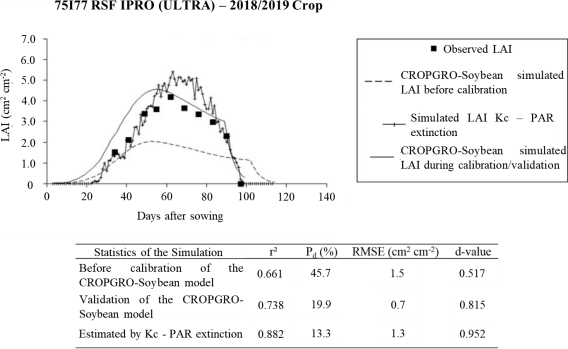
According to Figure 4, the calibrated CROPGRO-Soybean model simulated more accurate and robust values for the LAIs in the validation period, evidenced by the increases in r2 (0.738) and d-value (0.815), as well as the decrease in RMSE (0.7 cm2 cm-2) and Pd amplitude (19.9%), compared to the 2017/2018 harvest and also with the model maintaining the original parameters during the 2018/2019 crop. However, when comparing the LAIs simulated by the CROPGRO-Soybean model with those estimated through the mean Kc calculated daily for the field conditions, the latter ones were closer to the observed LAIs due to increased r2 (0.882) and d-value (0.952), as well as the reduced Pd amplitude (13.3%).
The estimated LAIs obtained from Kc showed results similar to those that occurred under field conditions during most of the development cycle of cultivar 75I77 RSF IPRO (ULTRA), especially in the initial (up to 50 DAS) and final (90 DAS up to the stage R8) phases (Figure 4). Between 55 and 83 DAS, the LAIs estimated through Kc were, on average, 28.6% higher than those observed, with new growth of RMSE (1.3 cm2 cm-2) and greater differences during senescence (R6), in which the new LAI values were about 1.4 and 1.2 cm2 cm-2 higher than those observed 69 and 76 DAS, respectively. This was likely due to variations in plant density at the randomly selected sampling locations from which the plants used for LAI measurements were collected.
Together with the PAR Apogee® SQ-316-S bar sensor used to determine fIPAR and Kc, the population of plants per square meter was relatively higher than the three points sampled weekly, which were chosen randomly to determine the mean LAI of the cultivar. In addition, the cultivated area within the range of action of the PAR line sensor did not suffer, like other parts of the plot, from damage caused by fungal diseases between stages R5 and R7, which also contributed to higher LAI values estimated by the Kc methodology compared to the LAI measurements obtained by the leaf scanning process that depended on random sampling. In this context, Yokoyama et al. (2018) highlighted the importance of maintaining the LAI between the middle of the grain filling period until physiological maturity, as it positively impacts yield. The authors also emphasize that special care is necessary to avoid loss of LAI at this stage. Moreover, proper management of diseases and insect pests is indispensable, as Moreira et al. (2015) discussed.
As the cultivar developed, self-shading occurred due to the overlapping leaves from the high density of plants at the sensor location point, which resulted at 60 DAS in values very close to the incidence of PAR, providing greater than 96% interception. This was also observed by Petter et al. (2016), who demonstrated that a major benefit of increasing the number of plants per area is the increase of the LAI, influencing the use of light by the crop (greater than 90%). According to Cox and Cherney (2011), high leaf growth plasticity is a relevant mechanism of phenotypic plasticity of soybean.
The LAI estimated by Kc was significantly affected in an increasing linear manner by the plant population up to the R4 stage, with the maximum peak occurring at 63 DAS (5.4) (Figure 4). For the period between 55 and 83 DAS, the average LAI was established at 4.5 cm2 cm-2. According to Tagliapietra et al. (2018), these values are recommended between stages R3 and R5 for cultivars of indeterminate growth to obtain maximum yields (optimization of dry matter accumulation by plants). This is equivalent to LAI values (3.5-4.5) greater than those normally cited as ideal for soybean cultivation, which does not consider the growth habit, the degree of relative maturity (DRM), and the water inputs in the cultivated area (irrigated and rain-fed fields). Up to around 30 DAS, the accumulation of soybean dry matter was slow, but it became faster from 30 to 60 DAS. Subsequently, the slight drop after 75 DAS was mainly due to the senescence of the leaves near the ground and the redistribution of photoassimilates and nutrients from the leaves to the grains formation, as observed in the works of Petter et al. (2016) and Srinivasan et al. (2017).
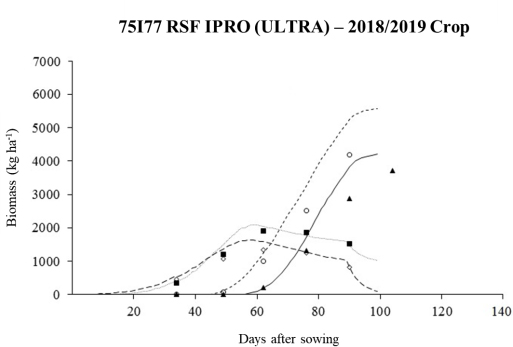
The temporal changes in the dry matter biomass of the cultivar canopy and its distribution in pods and grains, together with the simulated values, are shown in Figure 5. The agricultural cultivation model can simulate with some precision changes in the dry weight of plant components (pods, stems, leaves, and grains). Boote et al. (1997) found that CROPGRO-Soybean can reasonably predict temporal changes in LAI and biomass for various locations in the USA. However, because of the anticipation of the maximum LAI and the excess of simulated leaf area, the model tends to overestimate the biomass of the pods, which directly interferes with the dry matter of grains (yield), as there is a greater demand and partitioning of photoassimilates during stages R4 and R5.3 (Borrás et al., 2004), a period in which grains are between 26 and 50% formed (Fehr and Caviness, 1977), for the development of pods and grains (Figure 5). This situation was also verified by Crestani Mota et al. (2024) for the cultivar TMG2181 IPRO, with a slightly later cycle but with less impact, as the overestimates of the LAI by the model at the beginning of the development of this genetic material were lower.
The minimum tillage is another important detail during the validation. According to Mota (2019), the increases in simulated LAIs may also be linked to the increased nitrogen accumulation, an essential nutrient in grain filling and a fundamental prerequisite for high grain yields and quality (Salvagiotti et al., 2008), especially in cultivars with undetermined growth habits, by incorporating maize straws into the soil. This indicates that CROPGRO-Soybean responds differently (systematic error) to this condition in shorter-cycle cultivars, such as 75I77 RSF IPRO (ULTRA). With the appearance of leaves earlier in CROPGRO-Soybean simulations, the period of filling pods coincides with the maximum LAI, in the same way as the redistribution of mineral nutrients, carbohydrates, and nitrogen compounds in grains, stems, branches, and senescent leaves during this phase (Mundstock and Thomas, 2005).
Thus, the results of air-dried matter for the 2018/2019 crop season demonstrated that the model has limitations in its estimation of leaf expansion and senescence. Therefore, finer adjustments are required to the parameters related to the parameterization of the LAI in the CROPGRO-Soybean model, which applies three functions in this process. The growth stage is initially characterized by an exponential logistic function (sigmoid model) from emergence to the maximum LAI. Then, there is a linear phase (Goudriaan and Monteith, 1990) as self-shading increases and plants invest more in the production of pods and grains, and other non-leaf structures. Finally, the phase extending from leaf senescence to physiological maturity (Taiz and Zeiger, 2004) is terminated by an exponential function. Therefore, to minimize the effects of overestimated LAI on biomass production by the CROPGRO-Soybean model, the methodology proposed by Moreira et al. (2018) should be adopted. Those authors developed for the Agro-IBIS agroecosystem model an equation with a dynamic exponent to reduce the simulated LAI, particularly between stages R5 and R7, because Kucharik and Twine (2007) and Webler et al. (2012) identified in this model, problems similar to CROPGRO-Soybean for LAI simulations.
The proposed methodology represents a robust and scalable solution with potential to be used in crop simulation models, decision support systems, and digital platforms dedicated to monitoring and managing agricultural production. The use of an estimated average crop coefficient (Kc) of 0.687, derived from measurements conducted throughout the entire phenological cycle of the soybean cultivar 75I77 RSF IPRO (ULTRA), proved to be an effective procedure for the daily estimation of LAI in soybean cultivars. This approach offers a viable, low-cost, and non-destructive alternative to direct field measurements, particularly advantageous for long-term experiments or under operational constraints. The main finding of this study lies in the close alignment between the estimated Kc and the fixed value of 0.67 used by the CROPGRO-Soybean model (parameter KCAN – canopy light extinction coefficient for the daily PAR, present in the SBGRO.047.ESP file), which governs the attenuation of PAR within the canopy across all phenological stages. This consistency validates the methodology used for Kc estimation, enhances the reliability of LAI modeling under tropical conditions, and provides a sound basis for calibrating and validating agrometeorological models. Moreover, the accurate estimation of LAI based on Kc broadens the scope for studies on radiation interception and biomass accumulation, supporting advancements in yield modeling, climate risk zoning, and optimized crop management strategies. Therefore, the methodology developed in this study emerges as a reliable and applicable tool for sustainable agricultural intensification and its integration into modern monitoring and decision-support frameworks.
The authors thank the Coordenação de Aperfeiçoamento de Pessoal de Nível Superior (CAPES) / Financing Code 001 for the doctoral fellowship for Marcelo Crestani Mota, as well as the Conselho Nacional de Desenvolvimento Científico e Tecnológico (CNPq), the Fundação de Amparo à Pesquisa do Estado do Amazonas (FAPEAM), and the Fundação de Apoio à Pesquisa e ao Desenvolvimento (FAPED – EMBRAPA) for the assistance during the fieldwork in Vilhena, RO, Brazil. We are also grateful to the Instituto Nacional de Pesquisas da Amazônia (INPA), the Universidade do Estado do Amazonas (UEA), the Faculdade Marechal Rondon (FARON), and the Brazilian Agricultural Research Corporation – EMBRAPA Agricultura Digital (CNPTIA) for providing the infrastructure and materials used in this research.
Adeboye, O.B., Schultz, B., Adekalu, K.O., Prasad, K. (2016). Impact of water stress on radiation interception and radiation use efficiency of Soybeans (Glycine max L. Merr.) in Nigeria. Brazilian Journal of Science and Technology, 3(15), 2-21.
Allen, R.G., Pereira, L.S. (2009). Estimating crop coefficients from fraction of ground cover and height. Irrigation Science, 28(1), 17-34.
Alvares, C.A., Stape, J.L., Sentelhas, P.C., Gonçalves, J.L.M., Sparovek, G. (2013). Köppen climate classification map for Brazil. Meteorologische Zeitschrift, 22(6), 711-728
Boote, K.J., Jones, J.W., Hoogenboom, G., Wilkerson, G.G. (1997). Evaluation of the CROPGRO-Soybean model over a wide range of experiments. In: Kropff M.J. et al. (eds) Applications of systems approaches at the field level. Systems Approaches for Sustainable Agricultural Development, vol 6. Springer, Dordrecht.
Boote, K.J., Jones, J.W., Pickering, N.B. (1996). Potential uses and limitations of crop models. Agronomy Journal, 88(5), 704-716.
Borrás, L., Slafer, G.A., Otegui, M.E. (2004). Seed dry weight response to source-sink manipulations in wheat, maize and soybean: a quantitative reappraisal. Field Crops Research, 86(2-3), 131-146.
Bréda, N.J.J. (2003). Ground-based measurements of leaf area index: a review of methods, instruments and current controversies. Journal of Experimental Botany, 54(392), 2403-2417.
Cera, J.C., Streck, N.A., Fensterseifer, C.A.J., Ferraz, S.E.T., Bexaira, K.P., Silveira, W.B., Cardoso, Â.P. (2017). Soybean yield in future climate scenarios for the state of Rio Grande do Sul, Brazil. Pesquisa Agropecuária Brasileira, 52(6), 380-392.
Chechi, L., Petry, M.T., Oliveira, Z.B., Dantas, M.K.L., Silva, C.M., Gonçalves, A.F. (2021). Estimativa do índice de área foliar e da fração de cobertura do solo nas culturas de milho e soja usando NDVI. Irriga, 26(3), 620-637.
Confalone, A., Vilatte, C., Lázaro, L., Roca, N., Mestelan, S., Aguas, L., Navarro, M., Sal, F. (2016). Parametrización del modelo CROPGRO-soybean su uso como herramienta para evaluar el impacto del cambio climático sobre el cultivo de soja. Revista de la Facultad de Ciencias Agrarias Uncuyo, 48(1), 49-64.
Confalone, A., Djumovich, M.N. (1999). Influência do déficit hídrico sobre a eficiência da radiação solar em soja. Revista Brasileira de Agrociência, 5(3), 195-198.
Costa, L.C., Confalone, A., Pereira, C.R. (1999). Effect of water stress on the efficiency of capture of water and radiation by soybean. Tropical Science, 39, 91-97.
Costa, L.C., Morison, J., Dennett, M. (1996). Carbon balance of growing faba bean and its effect on crop growth: experimental and modelling approaches. Revista Brasileira de Agrometeorologia, 4(2), 11-17.
Cox, W.J., Cherney, J.H. (2011). Growth and yield responses of soybean to row spacing and seeding rate. Agronomy Journal, 103(1), 123-128.
Crestani Mota, M., Candido, L.A., Cuadra, S.V., Marenco, R.A., Souza, R.V.A., Tomé, A.M., Lopes, A.B.A., Lima, F.L., Reis, J., Brizolla, R.M. (2024). CROPGRO-soybean model – Validation and application for the southern Amazon, Brazil. Computers and Electronics in Agriculture, 216, 108478.
Cuadra, S.V., Kimball, B.A., Boote, K.J., Suyker, A.E., Pickering, Nigel. (2021). Energy balance in the DSSAT-CSM-CROPGRO model. Agricultural and Forest Meteorology, 297, 108241.
Fehr, W.R., Caviness, C.E. (1977). Stages of soybean development. Ames: Iowa State University of Science and Technology. (Special Report, 80)
Fensterseifer, C.A., Streck, N.A., Baigorria, G.A., Timilsina, A.P., Zanon, A.J., Cera, J.C., Rocha, T.S.M. (2017). On the number of experiments required to calibrate a cultivar in a crop model: the case of CROPGRO-Soybean. Field Crop Research, 204, 146-152.
Ferreira, O.G.L., Rossi, F.D., Andrighetto, C. (2008). DDA – Determinador Digital de Áreas: software para determinação de área foliar, índice de área foliar e área de olho de lombo. Versão 2.0. Santo Augusto: IFFarroupilha.
Fontana, D.C., Alves, G.M., Roberti, D., Moraes, O.L.L., Gerhardt, A. (2012). Estimativa da radiação fotossinteticamente ativa absorvida pela cultura da soja através de dados do sensor Modis. Bragantia, 71(4), 563-571.
Foster, T., Brozovic, N., Butler, A.P., Neale, C.M.U., Raes, D., Steduto, P., Fereres, E., Hsiaog, T.C. (2017). AquaCrop-OS: An open source version of FAO’s crop water productivity model. Agricultural Water Management, 181, 18-22.
Goudriaan, J., Monteith, J.L. (1990). A mathematical function for crop growth based on light interception and leaf area expansion. Annals of Botany, 66(6), 695-701.
Hoogenboom, G., Jones, J.W., Porter, C.H., Wilkens, P.W., Boote, K.J., Batchelor, W.D., Hunt, L.A., Tsuji, G.Y. (2003). Decision Suport System Agrotechnology Transfer (DSSAT) Version 4.0 [CD-ROM]. Honolulu, Hawaii: University of Hawaii.
Hoogenboom, G., Jones, J.W., Wilkens, P.W., Porter, C.H., Boote, K.J., Hunt, L.A., Singh, U., Lizaso, J.L., White, J.W., Uryasev, O., Royce, F.S., Ogoshi, R., Gijsman, A.J., Tsuji, G.Y., Koo, J. (2012). Decision Support System for Agrotechnology Transfer (DSSAT) Version 4.5 [CD-ROM]. Honolulu, Hawaii: University of Hawaii.
Jones, H.G. (2014). Plants and microclimate – A quantitative approach to environmental plant physiology. Third Edition. Cambridge University Press.
Jones, J.W., Hoogenboom, G., Porter, C.H., Boote, K.J., Batchelor, W.D., Hunt, L.A., Wilkens, P.W., Singh, U., Gijsman, A.J., Ritchie, J.T. (2003). The DSSAT cropping system model. European Journal Agronomy, 18, 235-265.
Kucharik, C.J., Twine, T.E. (2007). Residue, respiration, and residuals: Evaluation of a dynamic agroecosystem model using eddy flux measurements and biometric data. Agricultural and Forest Meteorology, 146(3-4), 134-158.
Li, Y., Chen, D., Walker, C.N., Angus, J.F. (2010). Estimating the nitrogen status of crops using a digital camera. Field Crops Research, 118(3), 221-227.
Mayers, J.D., Lawn, R.J., Byth, D.E. (1991a). Agronomic studies on soybean (Glycine max L. Merrill) in the dry seasons of the tropics. I. Limits to yield imposed by phenology. Australian Journal of Agricultural Research, 42(7), 1075-1092.
Mayers, J.D., Lawn, R.J., Byth, D.E. (1991b). Agronomic studies on soybean (Glycine max L. Merrill) in the dry seasons of the tropics. II. Interaction of sowing date and sowing density. Australian Journal of Agricultural Research, 42(7), 1093-1107.
Monsi, M., Saeki, T. (1953). Über den Lichtfaktor in den Pflanzengesellschaften und seine Bedeutung für die Stoffproduktion. Japanese Journal of Botany, 14, 22-52.
Moreira, E.N., Vale, F.X.R., Paul, P.A., Rodrigues, F.A., Jesus Júnior, W.C. (2015). Temporal dynamics of soybean rust associated with leaf area index in soybean cultivars of different maturity groups. Plant Disease, 99(9), 1216-1226.
Moreira, V.S., Candido, L.A., Mota, M.C., Webler, G., Oliveira, E.P., Roberti, D.R. (2023). Impacts of climate change on water fluxes and soybean growth in southern Brazil. Revista Ciência Agronômica, 54, e20228398.
Moreira, V.S., Candido, L.A., Roberti, D.R., Webler, G., Diaz, M.B., Gonçalves, L.G.G., Pousa, R., Degrazia, G.A. (2018). Influence of soil properties in different management systems: Estimating soybean water changes in the Agro-IBIS model. Earth Interactions, 22(4), 1-19.
Mota, M.C. (2019). Análise de risco edafoclimático para a soja cultivada na região do Cone Sul de Rondônia: diagnóstico atual e em cenários futuros do clima. PhD Thesis, Instituto Nacional de Pesquisas da Amazônia (INPA), Brasil.
Muchow, R.C. (1985). An analysis of the effects of water deficits on grains legumes grown in a semi-arid tropical environment in terms of radiation interception and its efficiency of use. Field Crops Research, 11(4), 309-323.
Müller, A.G., Bergamaschi, H., Silva, M.I.G. (2001). Eficiências de interceptação, absorção e de uso da radiação fotossinteticamente ativa pelo milho (Zea mays L.), em diferentes disponibilidades hídricas. In: Congresso Brasileiro de Agrometeorologia, 12. e Reunião Latino-Americana de Agrometeorologia, 3. Fortaleza. Anais [...]. Fortaleza: Sociedade Brasileira de Agrometeorologia.
Mundstock, C.M., Thomas, A.L. (2005). Soja: fatores que afetam o crescimento e o rendimento de grãos. Porto Alegre: Departamento de plantas de lavoura da Universidade Federal do Rio Grande do Sul: Evangraf.
Nóia Júnior, R.S., Sentelhas, P.C. (2019). Soybean-maize sucession in Brazil: Impacts of sowing dates on climate variability, yields and economic profitability. European Journal of Agronomy, 103, 140-151.
Paredes, P., Rodrigues, G.C., Cameira, M.R., Torres, M.O., Pereira, L.S. (2017). Assessing yield, water productivity and farm economic returns of malt barley as influenced by the sowing dates and supplemental irrigation. Agricultural Water Management, 179, 132-143.
Pengelly, B.C., Blamey, F.P.C., Muchow, R.C. (1999). Radiation interception and accumulation of biomass and nitrogen by soybean and three tropical annual forage legumes. Field Crops Research, 63(2), 99-112.
Petter, F.A. (2016). Elevada densidade de semeadura aumenta a produtividade da soja? Respostas da radiação fotossinteticamente ativa. Bragantia, 75(2), 173-183.
Plénet, D., Mollier, A., Pellerin, S. (2000). Growth analysis of maize field crops under phosphorus deficiency. II. Radiation-use efficiency, biomass accumulation and yield components. Plant and Soil, 224(2), 259-272.
Purcell, L.C., Ball, R.A., Reaper, J.D., Vories, E.D. (2002). Crop Science, 42(1), 172-177.
Sakamoto, T., Wardlow, B.D., Gitelson, A.A., Verma, S.B., Suyker, A.E., Arkebauer, T.A. (2010). Two-step filtering approach for detecting maize and soybean phenology with time-series MODIS data. Remote Sensing of Environment, 114(10), 2146-2159.
Salvagiotti, F., Cassman, K.G., Specht, J.E., Walters, D.T., Weiss, A., Dobermann, A. (2008). Nitrogen uptake, fixation and response to fertilizer N in soybeans: A review. Field Crops Research, 108(1), 1-13.
Santos, J.B., Procópio, S.O., Silva, A.A., Costa, L.C. (2003). Captação e aproveitamento da radiação solar pelas culturas da soja e do feijão e por plantas daninhas. Bragantia, 62(1), 147-153.
Schöffel, E.R., Volpe, C.A. (2001). Eficiência de conversão da radiação fotossinteticamente ativa interceptada pela soja para a produção de fitomassa. Revista Brasileira de Agrometeorologia, 9(2), 241-249.
Shibles, R.M., Weber, C.R. (1966). Interception of solar radiation and dry matter production by various soybean planting patterns. Crop Science, 6(1), 55-59.
Shibles, R.M., Weber, C.R. (1965). Leaf area, solar radiation and dry matter production by soybeans. Crop Science, 5(6), 575-577.
Souza, P.J.O.P., Ribeiro, A., Rocha, E.J.P., Farias, J.R.B., Loureiro, R.S., Bispo, C.C., Sampaio, L. (2009). Solar radiation use efficiency by soybean under field conditions in the Amazon region. Pesquisa Agropecuária Brasileira, 44(10), 1211-1218.
Srinivasan, V., Kumar, P., Long, S.P. (2017). Decreasing, not increasing, leaf area will raise crop yields under global atmospheric change. Global Change Biology, 23(4), 1626-1635.
Steinmetz, S., Siqueira, O.J.W. (1995). Eficiência de conversão em biomassa da radiação solar interceptada pela cultura do arroz irrigado submetida a níveis diferenciados de adubação nitrogenada. In: Congresso Brasileiro de Agrometeorologia, 9. Campina Grande. Anais [...]. Campina Grande: Sociedade Brasileira de Agrometeorologia.
Steinmetz, S.; Siqueira, O.J.W. (2001). Eficiência de conversão em biomassa da radiação solar interceptada nas distintas fases do ciclo de três tipos de planta de arroz irrigado. in: Congresso Brasileiro de Agrometeorologia, 12. e Reunião Latino-Americana de Agrometeorologia, 3., 2001, Fortaleza. Anais [...]. Fortaleza: Sociedade Brasileira de Agrometeorologia.
Tagliapietra, E.L., Streck, N.A., Rocha, T.S.M., Richter, G.L., Silva, M.R., Cera, J.C., Guedes, J.V.C., Zanon, A.J. (2018). Optimum leaf area index to reach soybean yield potential in subtropical environment. Agronomy Journal, 110(3), 932-938.
Taiz, L., Zeiger, E. (2004). Fisiologia vegetal. 3.ed. Porto Alegre: Artmed.
Thimijan, R.W., Heins, R.D. (1983). Photometric, radiometric, and quantum light units of measure: a review of procedures for interconversion. HortScience, 18(6), 818-822.
Webler, G., Cuadra, S.V., Moreira, V.S., Costa, M.H. (2012). Evaluation of a dynamic agroecosystem model (Agro-IBIS) for soybean in Southern Brazil. Earth Interactions, 16(12), 1-15.
Willmott, C.J. (1982). Some comments on the evaluation of model performance. Bulletin of Meteorological Society, 63(11), 1309-1313
Yokoyama, A.H., Balbinot Junior, A.A., Zucareli, C., Ribeiro, R.H. (2018). Índice da área foliar e SPAD durante o ciclo da soja em função da densidade de plantas e sua relação com a produtividade de grãos. Revista de Ciências Agroveterinárias, 17(4), 531-538.
Zdziarski, A.D., Todeschini, M.H., Milioli, A.S., Woyann, L.G., Madureira, A., Stoco, M.G., Benin, G. (2018). Key soybean maturity groups to increase grain yield in Brazil. Crop Science, 58(3), 1155-1165.