Mean and extreme precipitation regime in North and Central Italy – between stability and change
1 DIAGRAM S.p.A, Via Cavicchini 9, 44037 Jolanda di Savoia (FE), Italy
2 INFN, Dipartimento di Fisica, Università degli Studi di Milano, Via Celoria 16, 20133 Milano, Italy
3 DICATAM, Università degli Studi di Brescia, Via Branze, 43, 25123 Brescia
*Corrisponding author. E-mail: s.parisi@diagramgroup.it
Abstract. The work was carried out on the gridded precipitation dataset of the ARCIS consortium (hereafter ARCIS) that was produced spatializing a daily dataset of 1762 stations coming from 7 regions of Northern Italy and three regions of Central Italy for the period 1961-2023, with a pixel of 4.7 x 4.7 km. The mean yearly precipitation value from 1961 to 2023 shows a large interannual variability. On the other hand, the trend in frequency and intensity of extreme events (daily events above 50 mm) exhibit high space and time variability. Highlighting areas with significant or not significant trends is crucial for designing hydraulic infrastructures and managing the impacts of natural risks such as floods and landslides. Overall, results reveal that 83% and 86% of the areas do not show significant increases respectively in frequency and intensity while 11% and 15% show significant increases and 2% and 3% show significant decreases. Moreover, the spatial pattern of the areas affected by increasing frequency and intensity, highlights the presence of some regions characterized by increasing trend in North Italy at the beta mesoscale (20-200 km) which is the theatre of phenomena like mesocyclones or low-level jets. Finally, it should be noted that the 1991-2023 analysis of seasonal variations highlights a frequency increase of extreme phenomena in autumn (from October to December with a more marked increase in November), a weak decrease from January to April and a marked decrease in August. These variations can be interpreted as the result of the interaction of the synoptic circulation with mesoscale effects triggered by orography and sea surface temperature.
Keywords: extreme events, precipitation climatology, gridded precipitation dataset, frequency and intensity trends.
Jacqueline Katz, the 2022-2023 Albert Einstein Distinguished Educator Fellow at the Library of Congress, wrote in a 2023 post that “In all scientific disciplines, there are examples of stability and change. Stability refers to the tendency of an object or system to stay the same, while change occurs when objects or systems become different. Changes that occur in the various scientific disciplines can happen over extremely short or long-time intervals” (Katz, 2023). In climatology, which is the science of the climate system, this very general consideration refers to climate variability and change as products of the internal system variability or the response to changes in natural and anthropogenic forcings. In this context, variations in mean and extreme precipitation regime are a relevant aspect, due to their strong impacts on natural and anthropized ecosystems. In fact, precipitation related phenomena like floods, erosional processes and landslides result in strong damage to populations and human activities like agriculture, industry, transportation and tourism (IPCC, 2023).
Italy pertains to the Mediterranean basin and has more than 8000 km of coasts. Therefore, the sea influence on the area precipitation framework is mighty. It should be mentioned that the analysis of trends in maximum values for stations in the Mediterranean basin carried out by Sun et al. (2021) indicate that about 4% of the stations in the area have a significant upward trend in absolute yearly maxima while about 4% manifest a significant decrease. Basically, a relative stationarity is seen in extreme rainfall events, which is also highlighted by the IPCC future scenarios where it is stated: “Observations have a seasonal and regional pattern consistent with projected increase of precipitation in winter in Northern Europe. A precipitation decrease is projected in summer in the Mediterranean extending to northward regions. Extreme precipitation and pluvial flooding are projected to increase at global warming levels exceeding 1.5°C in all regions except the Mediterranean (high confidence).” (IPCC_AR6_WGI_Regional_Fact_Sheet_Europe.pdf).
Climatological analysis of precipitation is typically performed using rainfall stations time series. As an example of this approach, we can cite the analysis of a large dataset of daily rainfall data from stations in the Euro-Mediterranean area for the period 1973-2010 carried out by Mariani and Parisi (2013). The authors, using the analysis scheme proposed by Alpert et al. (2002), demonstrated the groundlessness of “the paradoxical increase of Mediterranean extreme daily rainfall in spite of decrease in total values” inferred by Alpert et al. (2002).
On the Italian area, a very detailed work was carried out by a research group at Politecnico di Torino on more than 4500 rainfall stations spanning the period between 1916 and 2014 (Libertino et al., 2018). The analysis of trends on 1-, 3-, 6-, 12- and 24-hour precipitation dataset highlighted that: “increasing rainfall extremes remains elusive at large spatial scales” (Libertino et al. 2019). More specifically, on the frequency, the outcomes show that all the observed trends are not significant, that is compatible with the hypothesis of stationary climate. Meantime, concerning the intensities of the events, a clear trend in extreme rainfall values cannot be detected at the country-scale. It’s worth noting that trends are significant in some specific areas and periods. The above-mentioned paper has received considerable attention from the scientific community, and it is cited in the AR6 (IPCC, 2023).
Fatichi and Caporali (2009), working on the rainfall time series of 785 stations in Tuscany for the period 1916-2003, highlighted the absence of trends in the mean rainfall regime and intensity of 3-, 6- and 12-h extreme events in almost all the stations analyzed. This conclusion agrees with Pinna (2014) which worked on extreme rainfall for stations of the Mediterranean area and Tuscany.
Bassi et al. (2011), working on 45 stations of the ARPA network and 47 stations of the former SIMN network, analyzed heavy rainfall for Piemonte (Italy) over the time period 1930-2004 and for durations of 1-,3-,6-,12- and 24-h. Results highlight that spatial distribution shows no significant variations with main maxima in the northern alpine and pre-alpine sectors and secondary maxima in the southern mountain ranges. About the intensity trend, the 47 SIMN stations showed a clear predominance of negative trends for durations of 1 hour and a slight predominance of positive trends for durations of 24 hours while for durations of 3,6 and 12 hours the trends were about 50% negative and 50% positive. On the other hand, the 45 ARPA stations showed negative trends for more than 50 percent of the stations. Overall, the analysis conducted by Bassi et al. (2011) didn’t highlight preferential areas where positive or negative trends dominate.
Brunetti et al. (2010) analyzed daily extreme precipitation trends for 129 stations in Calabria (1920-2005) and showed a precipitation decrease in the higher intensity categories and an increase in the lower categories, especially in the winter period. These trends were highly dependent on the subperiod considered, with negative trends prevailing after 1950.
It should also be reminded that the Italian territory is by nature exposed to a lot of synoptic and mesoscale factors favorable to extreme precipitation events: the high frequency of synoptic blocking patterns (Barton et al., 2022) and the closeness of regions sources of cold (Polar Continental, Polar Maritime, Arctic Continental and Arctic Maritime). Moreover, it must be considered the Mediterranean basin, source of humid air masses, and the presence of the complex geomorphology of the Alps and the Apennines that is favorable to the convergence and rise of air masses.
Doswell et al. (1996) gave an effective description of mesoscale factors favorable to continued high rates rainfall events. In turn, “high precipitation intensity” involves the rapid ascent of low-level air containing substantial water vapor and depends on the precipitation efficiency (ratio of the amount of rainfall that reaches the ground to the amount of rainfall formed in the storm). Moreover, the “long duration” of an event is associated with its movement speed and the size of the system causing the event along the direction of system movement. This naturally leads us to explore the meteorological processes that combine these fundamental elements to generate weather events. Describing these processes and the types of storms that produce heavy precipitation, reveals the many different ways such events can occur. Since the right mixture of these ingredients can be found in a wide variety of synoptic and mesoscale situations, it is necessary to know which of the ingredients is critical in any given case. For example, in the specific case of the flood that hit the surroundings of Valencia (Spain) on 29 October 2024 (Pucik, 2024) with a 14 hours rainfall peak of 771.8 mm reached at Turis (26 km South-west of the city center of Valencia).
The precipitation intensity of the event was enhanced by the following forcing factors:
– high absolute moisture content in the lower troposphere rapidly advected towards the coast due to wind speeds up to 25 m/s in the bottom 500 m (low level jet).
– High potential for rapid vertical flux of moisture due to high Convective Available Potential Energy (CAPE)
On the other hand, “precipitation efficiency” (defined as the precipitate over precipitable water ratio) was enhanced by:
– low-cloud bases, and high relative humidity in the low to mid-troposphere, resulting in a low potential for rainfall evaporation
– relevant depth of the cloud available for the growth of raindrops through collision and coalescence, given by the large distance between the lifted condensation level and the 0° isotherm (the so-called deep warm cloud depth).
Bauer and Scherrer (2024) analyzed the long-term (1901-2023) evolution of daily and multi-day heavy precipitation intensity and frequency in Swiss, finding that daily maximum precipitation and the frequency of precipitation events exceeding the 99th all-day percentile have increased since 1901 with a peak in the 1980s and decreases thereafter. For the recent period 1981 –2023, positive trends in summer heavy precipitation intensity are detected for short (10-min to 3-h) events, but no changes are found for the frequency of these moderate extreme events. For longer (1- to 5-day) events on the other hand, decreases in intensity and frequency are found, especially for the winter half-year. This work highlights the importance of the reference period in trend analysis and the fact that precipitation trends are not only influenced by thermodynamics (increase in global temperatures) but also by the dynamics of circulation phenomena at different scales (Bauer and Scherrer, 2024).
It is worth noting that average or extreme precipitation analysis can now be performed with the aid of gridded datasets with variable spatial resolutions. Sun et al. (2017) carried out a comprehensive review of some global precipitation gridded data sets, with pixel ranging from 0.5x0.5 to 5x5 degrees. Gridded datasets covering the Italian area are the Alpine area dataset described by Isotta et al (2013) or the ARCIS gridded dataset, covering North Italy and part of Central Italy (Toscana, Umbria and Marche administrative regions) (Pavan et al., 2013).
In this work we aim to analyze the spatial distribution and trends in 24-hour extreme precipitation recorded in North and Central Italy in the period 1961-2023 and collected by the ARCIS daily dataset with the purpose of providing useful insights for land use management.
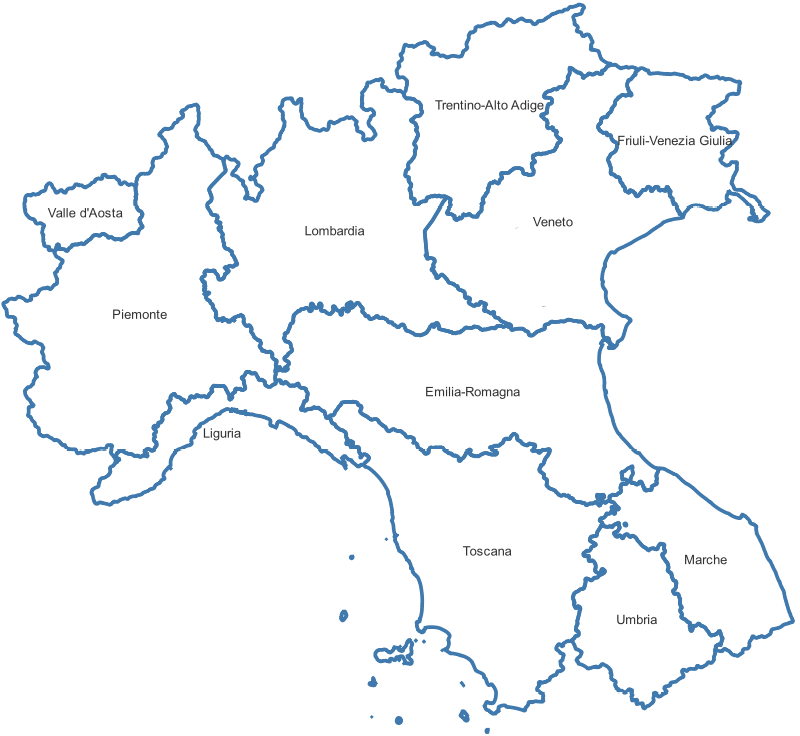
The work was done analyzing data from the Climatological Archive for North and Central Italy by the ARCIS consortium (https://www.arcis.it/wp/). This archive is the result of an agreement between some regional meteorological services belonging to the following public bodies: ARPA Piemonte, ARPAL, ARPA Emilia Romagna, ARPA Lombardia, ARPA Veneto, Provincia Autonoma di Trento, Provincia Autonoma di Bolzano, Regione Autonoma Valle D’Aosta, ARPA Friuli-Venezia Giulia (Fig. 16). This agreement aimed to the establishment and management of an historical daily precipitation database (Pavan et al., 2013). The ARCIS database contains daily precipitation data from 1961 to 2023, spatialized on 4.7 x 4.7 km cells for a total of 7605 cells and it is an effective tool for understanding the precipitation evolution over North-Central Italy.
As indicated by Pavan et al. (2018), the data come from 1762 stations located in the ARCIS consortium areas, from stations belonging to 11 Italian administrative regions (Piemonte, Valle d’Aosta, Liguria, Lombardia, Emilia Romagna, Veneto, Trentino Alto Adige, Friuli Venezia Giulia, Toscana, Umbria, and Marche), and from stations close to the Italian borders belonging to foreign national meteorological services. The ARCIS area covers 189343 km2 and there is one station every 107.47 km2 on average, despite the presence of significant inhomogeneities in the stations spatial distribution. The ARCIS data collection is frequently updated and at present spans from 1961 to 2023.
The time series was constructed by joining several stations that did not overlap in time, selecting stations that cover at least 80 percent of the analysis period. The Italian data come partly from the former National Hydrographic Service and subsequently from various local and regional services.
Precipitation data were interpolated on a regular grid of 4.7 x 4.7 km using a method based on a modified Shepard algorithm (Antolini et al., 2015) that considers topographic distances between stations and the interpolation error was evaluated using a cross-validation technique.
Errors were analyzed according to season and altitude. Low-intensity events tend to be overestimated in low-elevation areas, while high-intensity events are often underestimated, especially in winter. The final product has improved performance in mountainous areas and regions with high station density.
The whole process allowed the construction of a homogeneous and consistent database suitable for describing not only average precipitation values, but also their spatial and temporal variability, which is essential for climate and impact studies.
This paper analyzes precipitations on the Arcis area to obtain an updated climatology referred to average, variability and extreme values for the whole dataset. Moreover, the extreme precipitation temporal trend over the ARCIS area has been analyzed, including the calculation of significantly positive and negative trends at the general level and pixel by pixel. More specifically:
– The intensity trend referred to yearly absolute maximum daily precipitation
– The frequency trend of the number of days per year when daily precipitation exceeds the 50 mm threshold, which can be considered a benchmark for extreme daily precipitation (Fig. 2.34 from: https://archive.ipcc.ch/ipccreports/tar/wg1/090.htm?).
Trend analysis was performed using the Mann Kendall test (Gilbert, 1987) that is a nonparametric methodology that allows trends to be analyzed without making assumptions about the data distribution.
This was supplemented by an analysis of the frequency and intensity percentage changes that occurred during 1991-2023 (33 years) compared with the 30-year period 1961-1990 by highlighting them in map products and frequency histograms. The choice of the two subperiods was dictated by the fact that 1961-1990 is still recommended by WMO for the computation and tracking global climate anomalies relative to a fixed and common reference period (World Meteorological Organization, 2021 - a) while the 1991-2023 subperiod is after the macroscale circulatory change of the ’80s, which global features are described by Reid et al., (2016) while European effects on selected crops are described in Mariani et al. (2012).
The significance of the differences in frequencies of different classes of precipitation in the subperiods 1961-90 e 1991-2023 has been evaluated using the Chi square test “SciPy-stats” library of Python (Skipper et al., 2010).
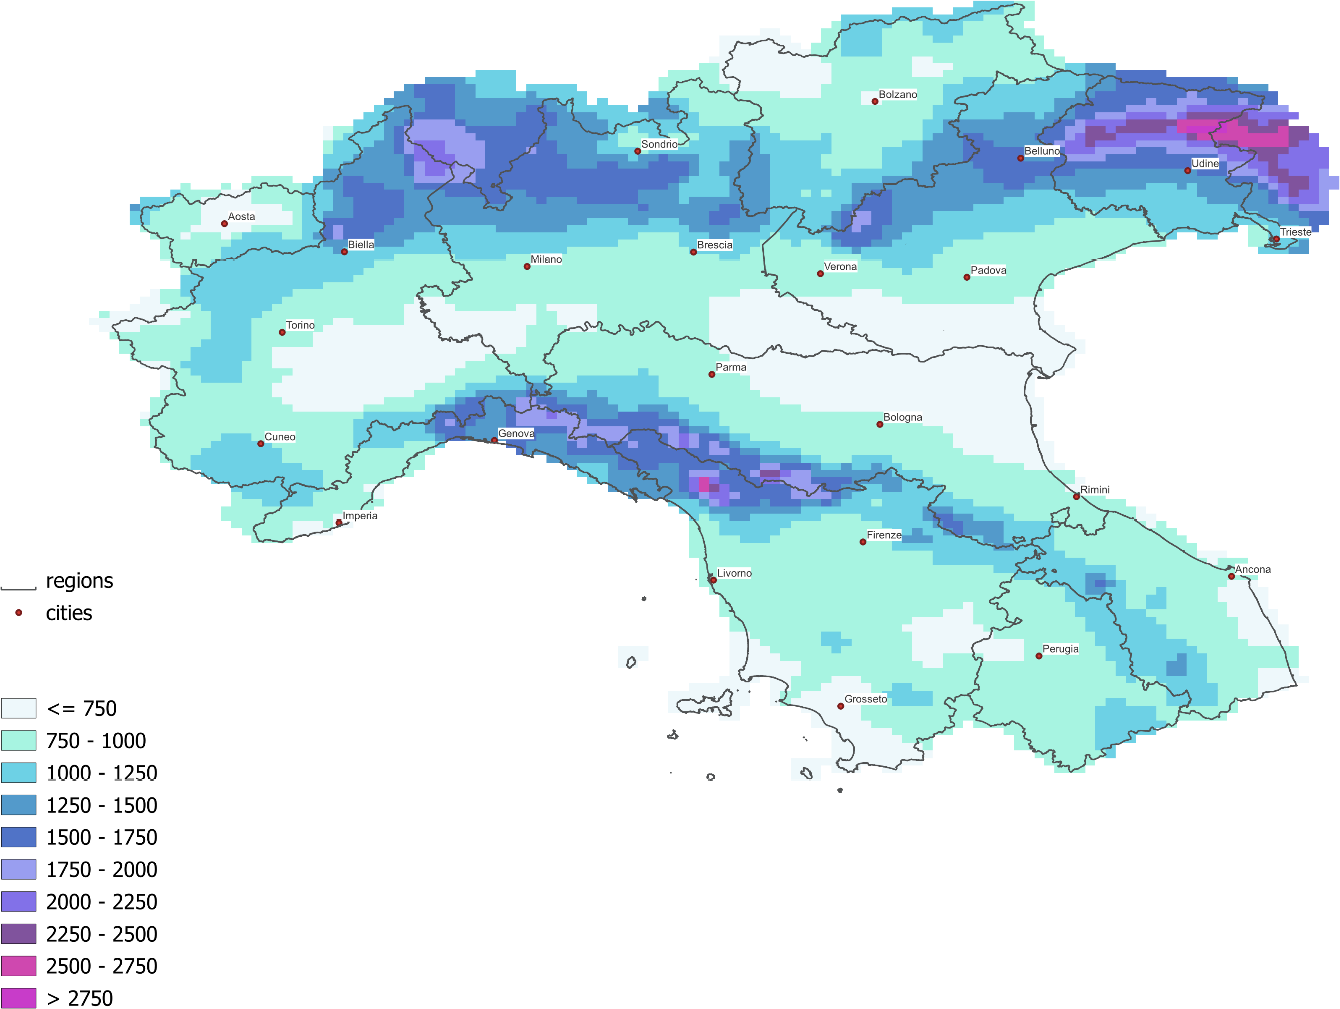
The total yearly average precipitation (period 1961-2023) of the ARCIS area is shown in Fig. 1. The map reveals the heavy influence of topography on the precipitation field. It is worth noting that mountainous regions (pre-Alpine areas and North Apennines) receive the highest rainfall, while plains, the interior of the Alps and coastal areas, experience lower precipitation. The mean yearly precipitation pattern is substantially stable over time, as demonstrated by the evident similarity to maps referred to previous periods 1921-50 (Mori, 1964), 1921-70 (Cati, 1981) and 1971-1990 (Frei and Schar, 1998). This is relevant to meet the water needs of agriculture and other socio-economic sectors.
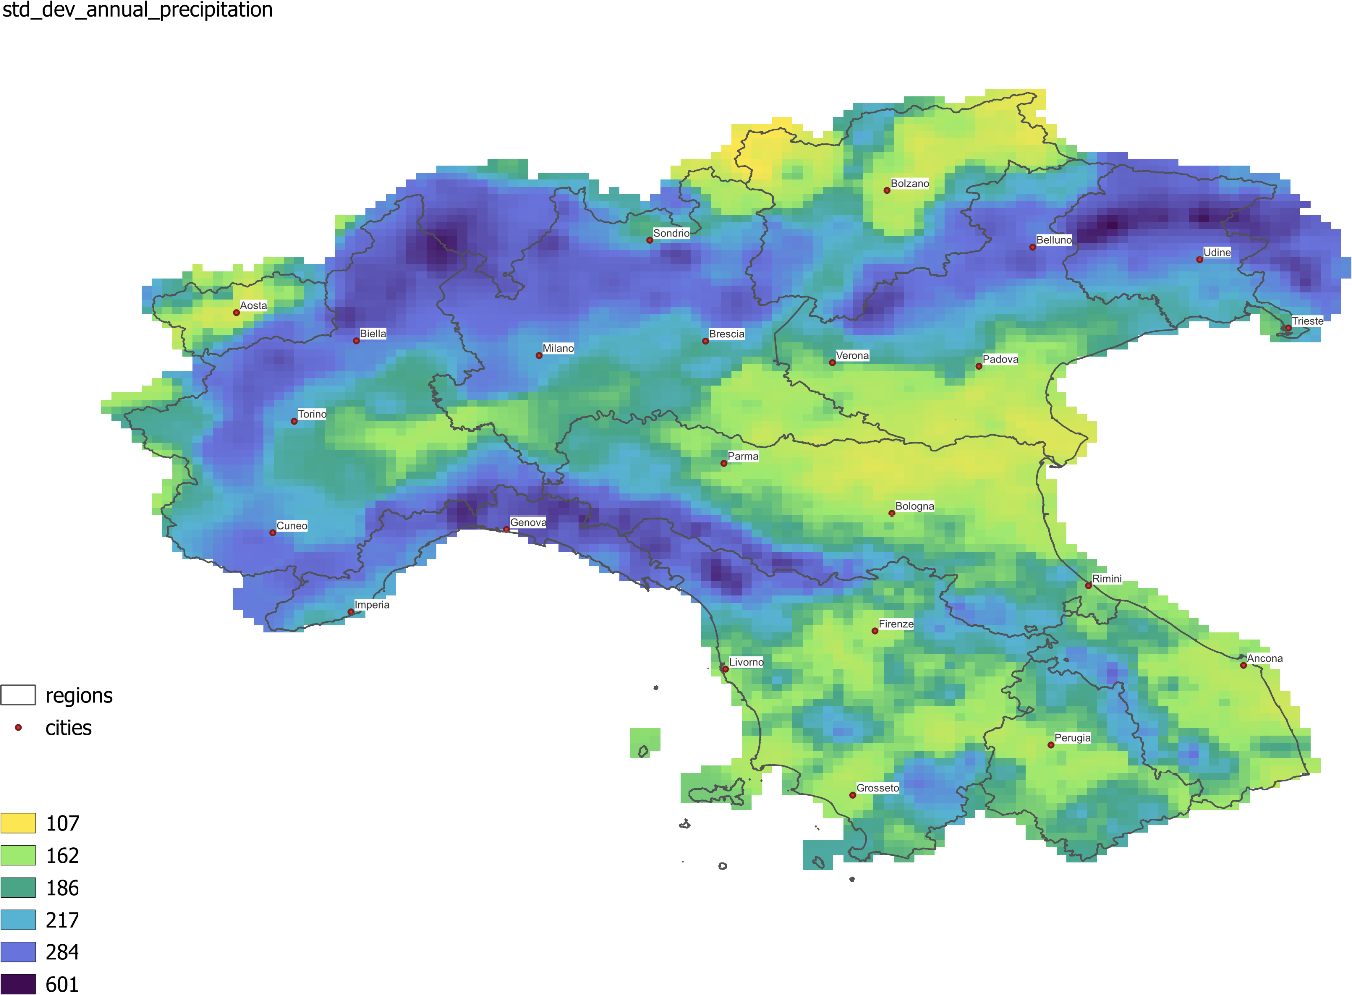
The map in Fig. 2 shows the spatial distribution of standard deviation of yearly precipitation calculated for each pixel. The visual analysis shows the consistency with the mean values represented in Fig. 1: areas of maximum Alpine and Apennine rainfall are also those affected by a higher variability. By performing a correlation analysis between mean values and standard deviation of yearly precipitation, as a matter of fact we obtain a Pearson correlation coefficient of 0.8887 and a p-value less than 0.01 (highly significant).
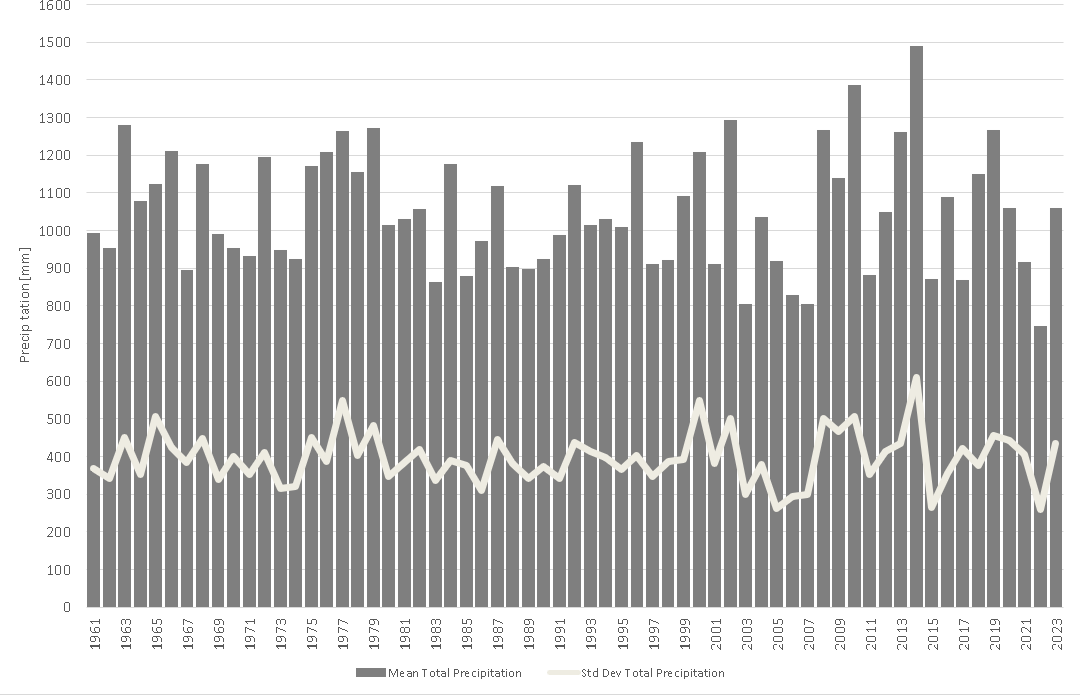
The coherence between mean and standard deviation is also highlighted by the diagram in Fig. 3 which shows that the years with the highest mean precipitation are also those with the highest standard deviation. Both time series are stationary, as stated by the Mann Kendall test for mean (S : -133; Z : -0.7829; p (no trend): 0.43368) and standard deviation (S : 35; Z: 0.20166; p (no trend): 0.84018). The stationarity in an index of central tendency and variability allows to exclude the presence of signals of change in annual precipitation in the area.
The diagram in Fig. 3 shows also that four rainy years (1963, 2002, 2010 and 2014) exceed the 95th percentile, while four dry years are below the 5th percentile. This interannual variability is influenced by a wide range of precipitation-driving factors operating at different spatial and temporal scales. Among these factors a crucial role is played by the frequency and persistence variability of different macro- and mesoscale circulation weather types (Piotrowicz and Ciaranek, 2020). The weather at mid latitudes of our Planet is ruled by the annular circulation (westerlies) that produces a rapid alternation of anticyclonic (stable weather) and cyclonic weather types (perturbed weather). In this variability context, prolonged rainy phases or total absence of precipitation are also observable, which are the result of the periodic establishment of long-persistence blocking systems over the Euro-Atlantic area. An adaptation to this precipitation interannual variability is obtained by irrigation facilities that fed a complex system of irrigation channels and water storages dams in the Alpine and Apennine areas or natural reservoirs (pre-Alpine lakes: i.e. Maggiore, Como, Iseo, Idro and Garda) or rivers like Po, which storage capacity is enhanced by artificial barriers.
It is also interesting to note that human settlements in the ARCIS area, often very ancient, were established and developed with careful consideration about the spatial and temporal precipitation distribution, which has always imposed significant constraints on human life and activities. For example, the main urban centers in the ARCIS area are typically located in zones with moderate rainfall and near rivers, which are fed by areas with more intense and persistent precipitation from the surrounding highlands.
Regarding the mean precipitation climatology, the ARCIS dataset offers many possibilities for investigation at monthly and seasonal scales that could be the subject of future contributions. Focusing solely on the agricultural sector, consider, for example, the potential for studying water limitations for agriculture using water balance techniques (Lebon et al., 2003), or examining thermal resources and their limitations for crops (Mariani et al., 2012). However, in the next part of this work we will focus our attention on the frequency and intensity of extreme rainfall events characteristic of the ARCIS area.
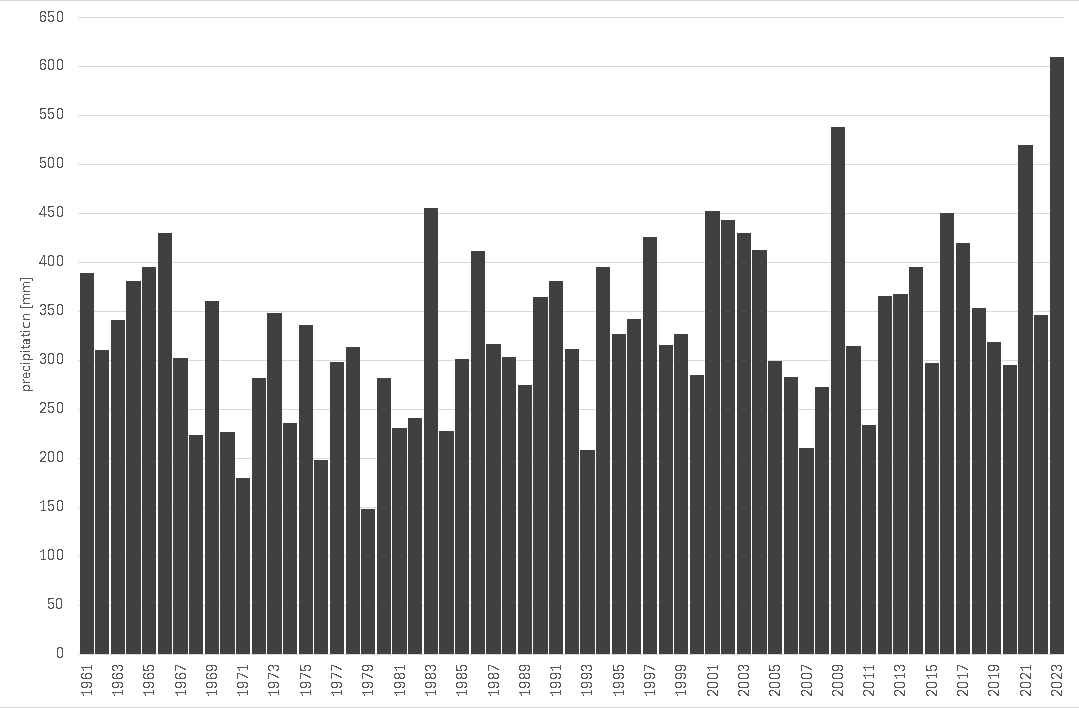
The diagram of the annual absolute maximum daily rainfall values from 1961 to 2023 for the whole ARCIS area (Fig. 4) shows high inter-annual variability with maxima not infrequently exceeding 400 mm. The whole time series shows a positive trend that is very close to the 95% threshold of significance (Mann - Kendall test: S :331; Z:1.9573; p (no trend): 0.050309).
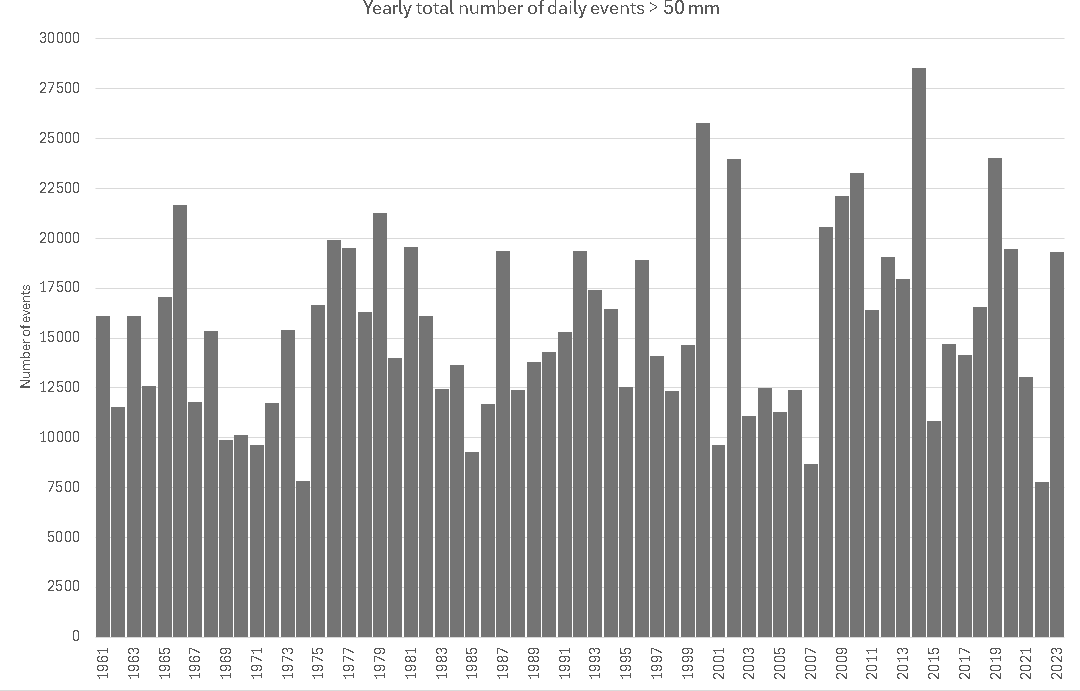
The diagram of the total number of events exceeding the 50 mm threshold for the whole ARCIS area (Fig. 5) shows high inter-annual variability. The visual analysis highlights that the number of events over 50 mm is stationary until 2007 with the exceptions of 2000 and 2002; an increase is instead observed since 2008. The whole time series shows a positive but not-significant trend (Mann - Kendall test: S : 205; Z :1.2099; p (no trend): 0.2263). Note also that the absolute maximum of 28524 yearly events exceeding 50 mm is reached in 2014 which is the year with maximum yearly mean precipitation (1489 mm) and that was the consequence of a strong precipitation in January, February, July and November.
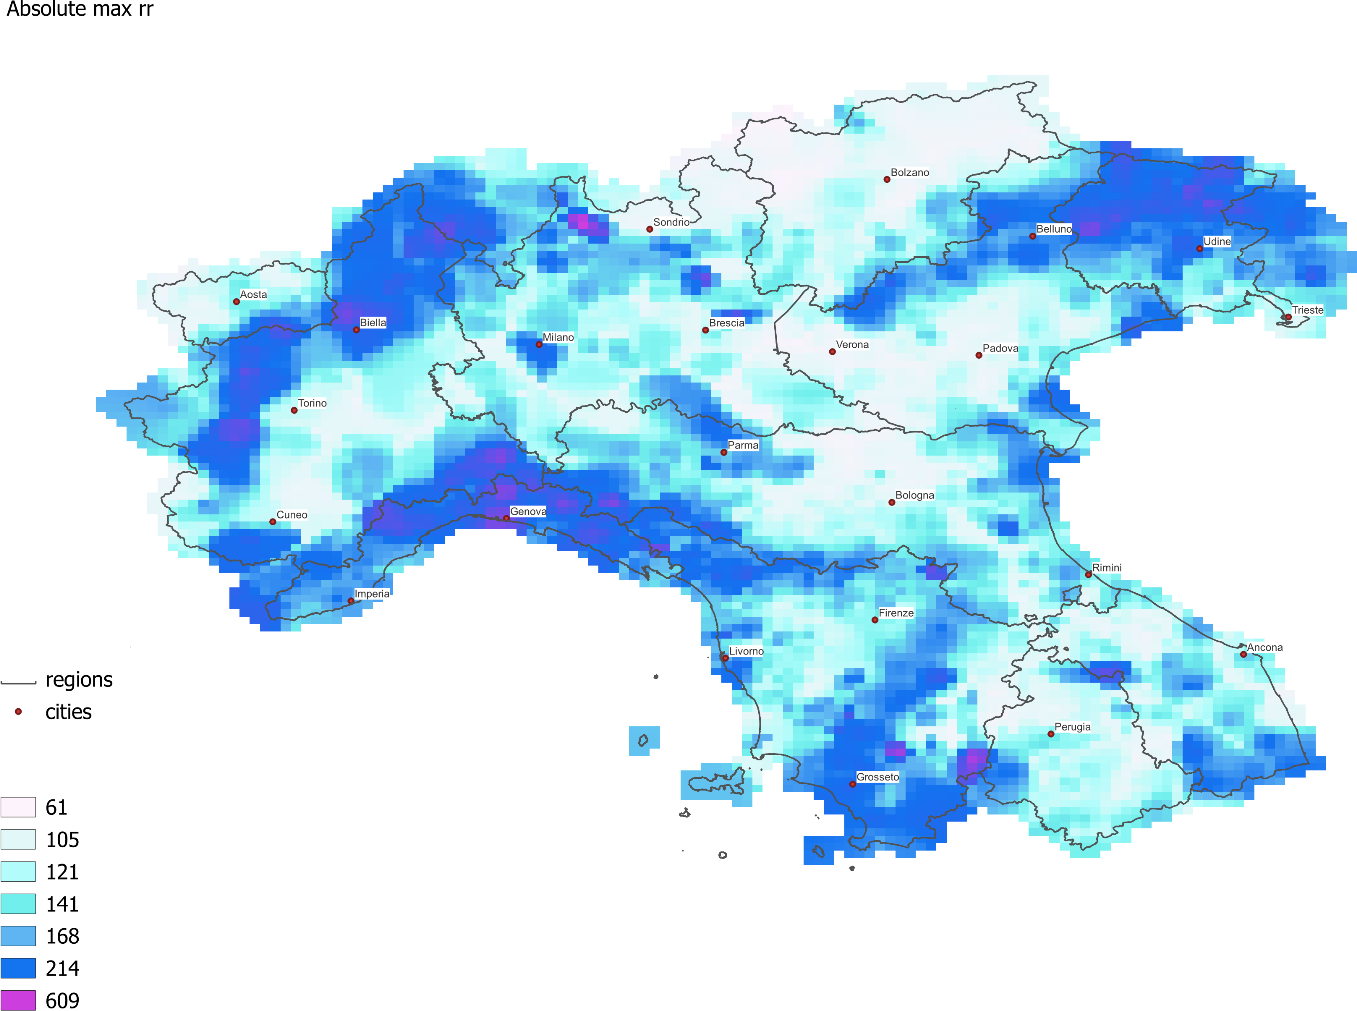
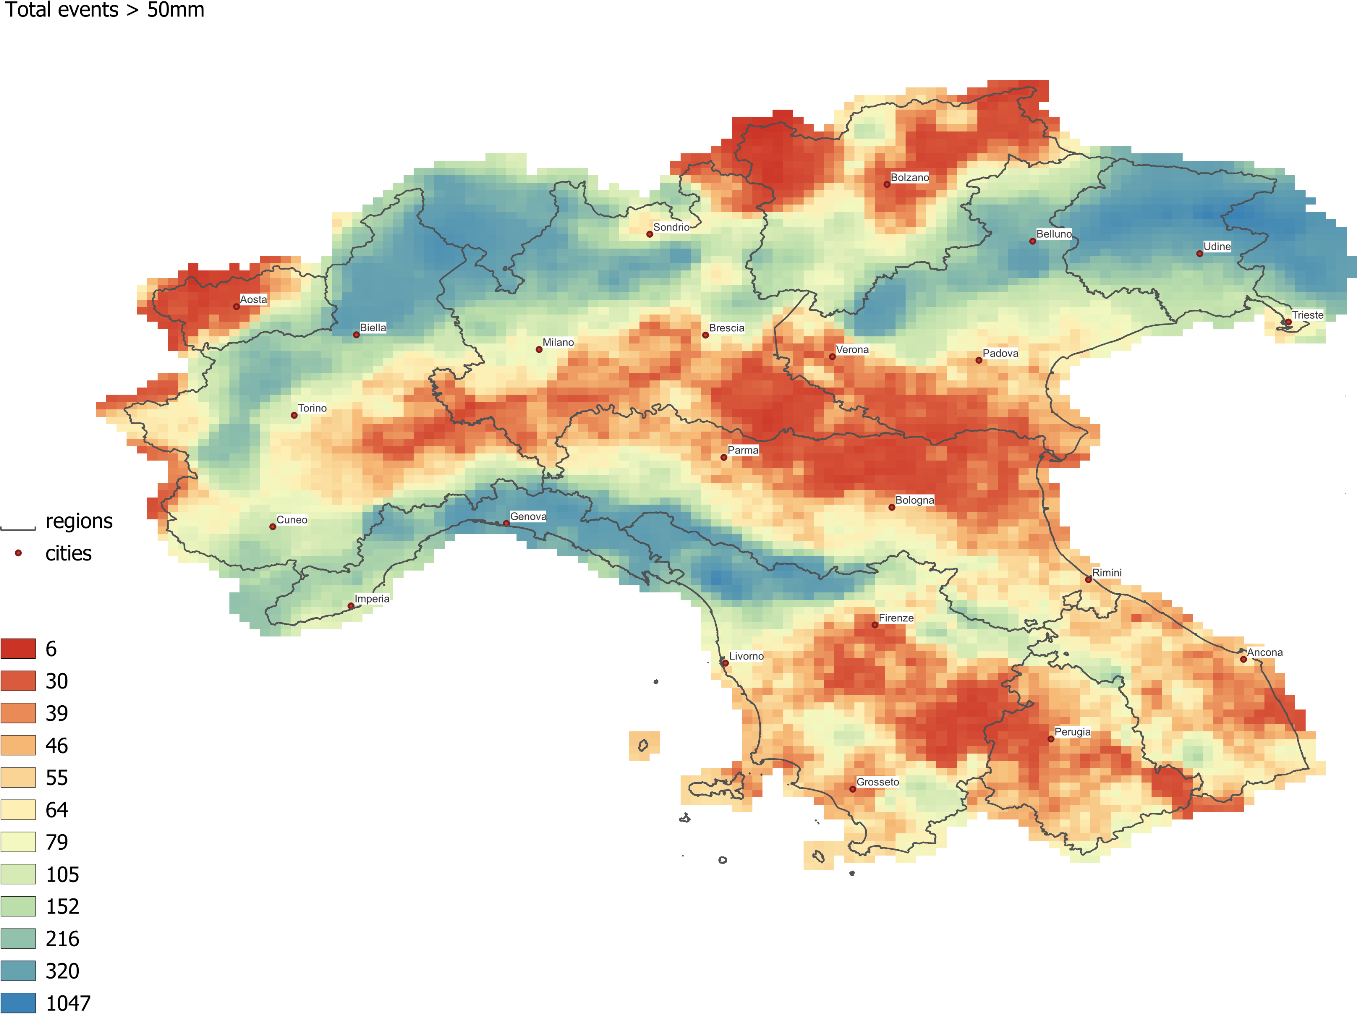
The map in Fig. 6 shows the absolute maximum daily precipitation over the whole period covered by ARCIS dataset (1961-2023) while the map in Fig. 7 shows the total number of daily events with precipitation > 50 mm. These two maps highlight the areas potentially most exposed to extreme rainfall events. Obviously, the risk of catastrophic events (landslides, floods) is the result not only of the danger of extreme rainfall events, but also of the vulnerability of the region, which is strictly related to its geo-morphological features and of the exposure to risk of populations and infrastructures. From this point of view, it should be considered that extreme events occurring in locations characterized by high average annual precipitations generally have a lower impact than extreme events of the same magnitude occurring in areas with low average annual precipitation (Libertino et al., 2016).
The map in Fig. 8 illustrates the significant positive and negative trends over the period 1961-2023 in the maximum daily precipitation recorded each year for each pixel, providing a representation of the areas where the most extreme events have intensified or weakened in a statistically significant way (p-value < 0.05, 95 % significance according to the Mann - Kendall test). Note that the pixels with significant decrease in intensity are isolated and without spatially coherent aggregations. On the contrary, pixels subject to intensification tend to predominate in some spatially coherent areas (hereafter named increase nuclei) affecting namely the area of the Apennines surrounding the Genoa Gulf, the area of the High Plain and the Prealps of Piemonte, the area of central-eastern Lombardia and the area of Alto Adige. The pixels affected by intensification are instead isolated and scarcely frequent in Emilia Romagna, Veneto, Friuli Venezia Giulia and the 3 regions of Central Italy (Toscana, Umbria and Marche).
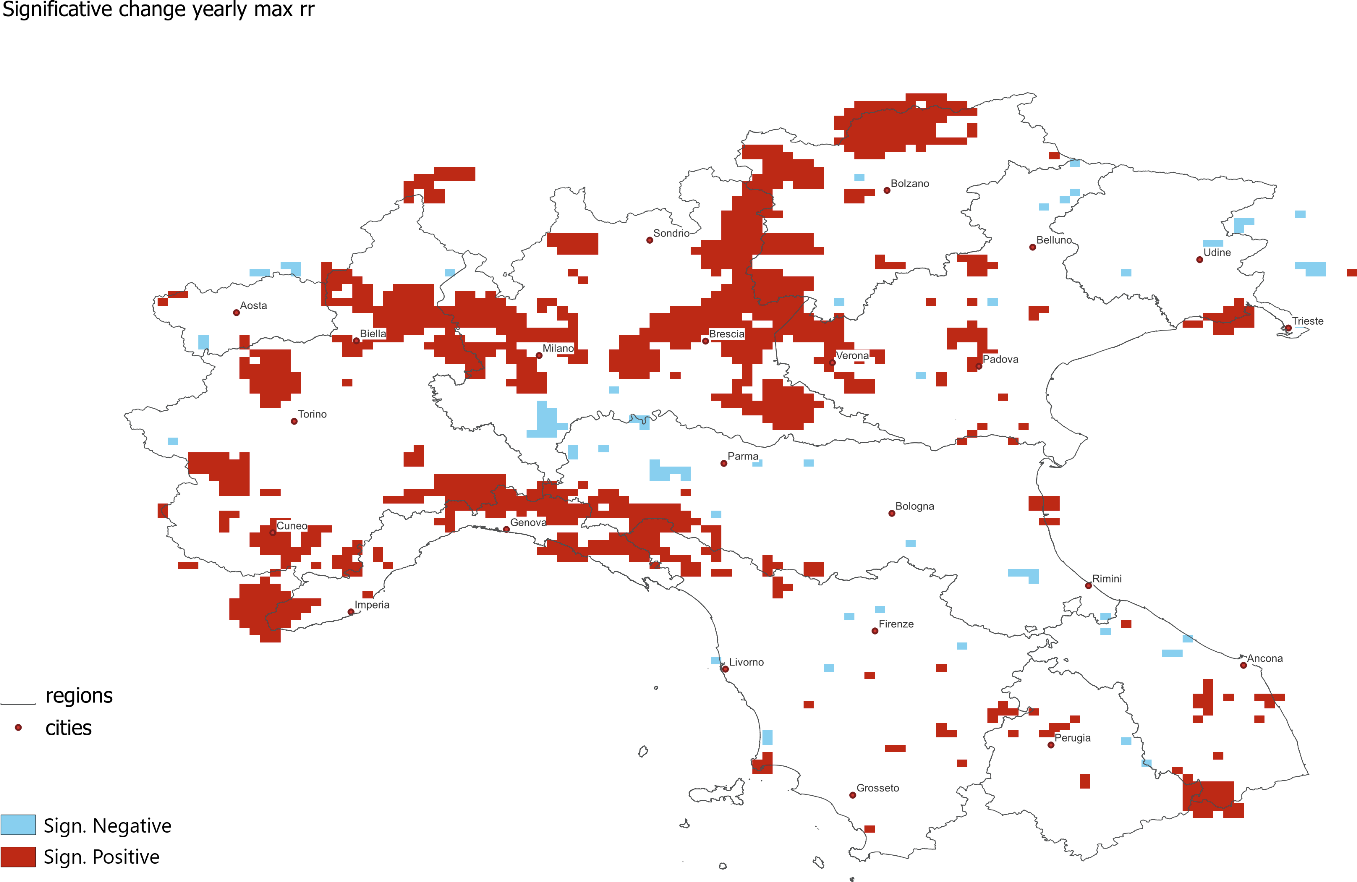
Tab. 1 shows that the 83.42% of the cells illustrated in Fig. 8 do not show any significant trend, while 14.66% show an increasing trend and 1.92% show a decreasing trend. Most of the positive trends are concentrated in 5 regions (Liguria with 34,58 of its territory, Lombardia with 31.4%, Trentino-Alto Adige with 25.4%, Piemonte with 23.1% and Veneto with 9.6%). At the opposite side are Friuli Venezia Giulia, with only 1.25% of territory affected by positive trends, Valle d’Aosta with 1.56%, Emilia Romagna with 3.69% and the three regions of the Central Italy (Toscana, Marche, Umbria) with 4-6% of the territory affected by positive trends.
| Administrative Regions | % significative positive pixels (maximum events) | % significative negative pixels (maximum events) | % non significative | % significative positive pixels (events > 50 mm) | % significative negative pixels (events > 50 mm) | % non significative |
|---|---|---|---|---|---|---|
| Piemonte | 23.08 | 0.39 | 76.53 | 2.23 | 6.40 | 91.37 |
| Valle d’Aosta | 1.56 | 3.13 | 95.31 | 3.91 | 1.56 | 94.53 |
| Lombardia | 31.36 | 2.70 | 65.94 | 30.32 | 1.66 | 68.02 |
| Trentino-Alto Adige | 25.40 | 0.71 | 73.89 | 24.33 | 0.00 | 75.67 |
| Veneto | 9.60 | 1.60 | 88.8 | 20.67 | 0.53 | 78.8 |
| Friuli-Venezia Giulia | 1.25 | 1.88 | 96.87 | 7.19 | 0.63 | 92.18 |
| Liguria | 34.58 | 0.00 | 65.42 | 9.35 | 0.93 | 89.72 |
| Emilia-Romagna | 3.69 | 4.92 | 91.39 | 1.01 | 2.68 | 96.31 |
| Toscana | 4.69 | 1.34 | 93.97 | 5.14 | 1.79 | 93.07 |
| Umbria | 4.26 | 0.61 | 95.13 | 3.65 | 6.69 | 89.66 |
| Marche | 6.22 | 2.70 | 91.08 | 8.38 | 2.16 | 89.46 |
| Tot Area ARCIS | 14.66 | 1.92 | 83.42 | 11.66 | 2.51 | 85.83 |
The map in Fig. 9 illustrates the yearly number of daily events greater than 50 mm significant positive or negative trends for each pixel. As already highlighted for the trends of the annual absolute maximums, it is noted that the pixels subject to a frequency decrease are isolated and never show spatially coherent aggregations. On the contrary, the pixels subject to frequency increase tend to predominate in some spatially coherent hotspots mainly affecting Lombardia, Veneto and Alto Adige.
Tab. 1 reports that 85.83% of the cells illustrated in Fig. 9 do not show significant trends while 11.66% show increasing trends and 2.51% show decreasing trends. The main part of the positive trends is concentrated in 3 administrative regions: Lombardia with 30.32% of its territory, Trentino-Alto Adige with 24.33% and Veneto with 20.67%. At the opposite are Emilia Romagna with 1.01%, Piemonte with 2.23% and Valle d’Aosta with 3.91%. The three regions of the Central Italy (Toscana, Marche, Umbria) show the 3-8% of the territory affected by positive trends. It is also interesting to highlight the marked difference between the percentage of pixels with positive trends in events over 50 mm and in the absolute annual maxima in Piemonte (the percentage of the territory with increasing absolute maximums exceeds the percentage with increasing number of events over 50 mm) and Veneto (the opposite). It should also be noted that in Piemonte, Emilia Romagna and Umbria the percentage of negative trends exceeds the percentage of positive ones.
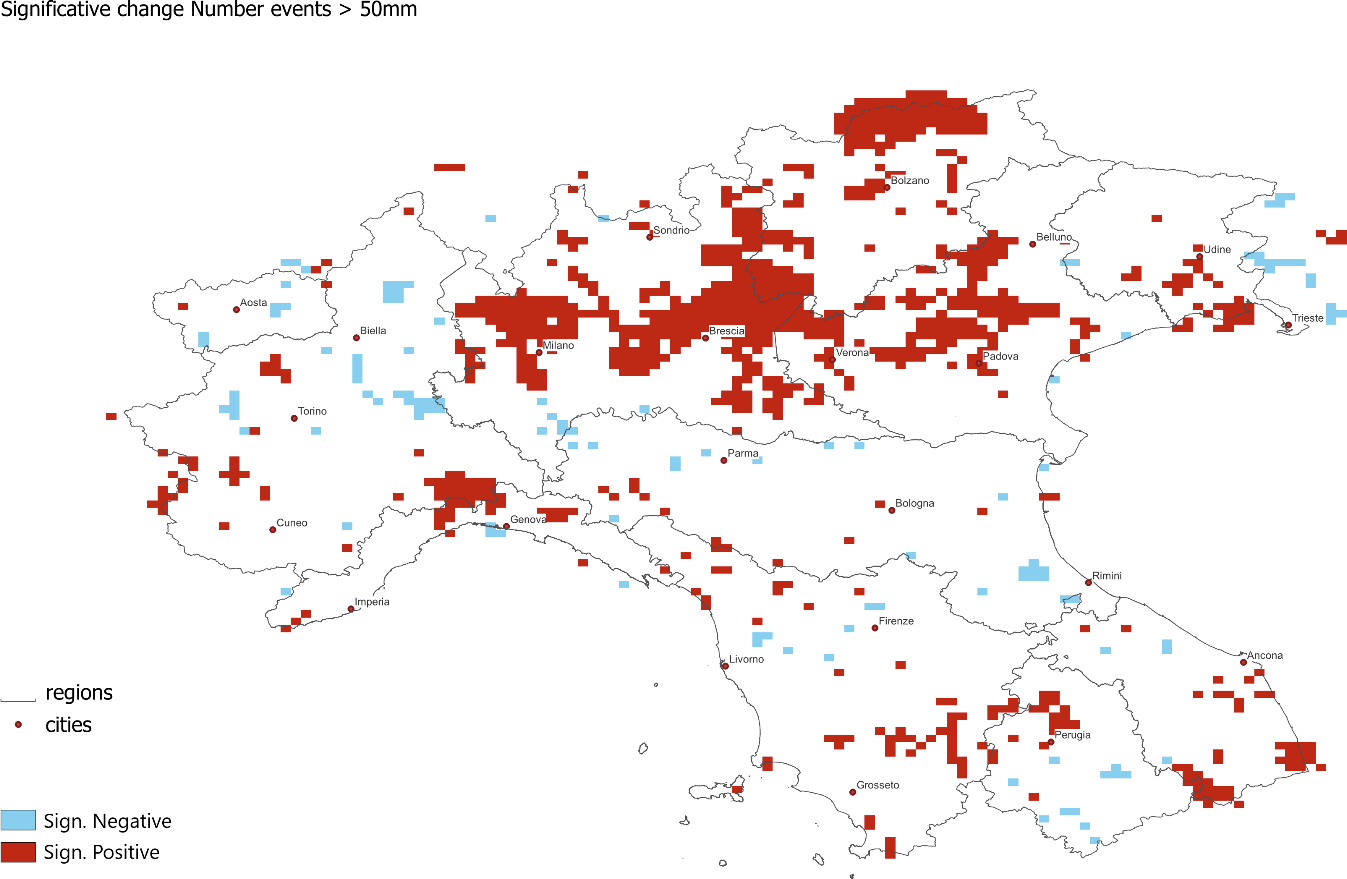
Fig. 10 shows the percentage change in absolute rainfall maxima between the two subperiods 1961-1990 and 1991-2023. The map was obtained by calculating for the two subperiods the multiyear average of annual absolute maximum daily precipitation for each pixel and the following calculation was used to obtain the percentage variation:
Percentage change = ((mean(1991-2023) - mean (1961-1990) / mean (1961-1990)) * 100
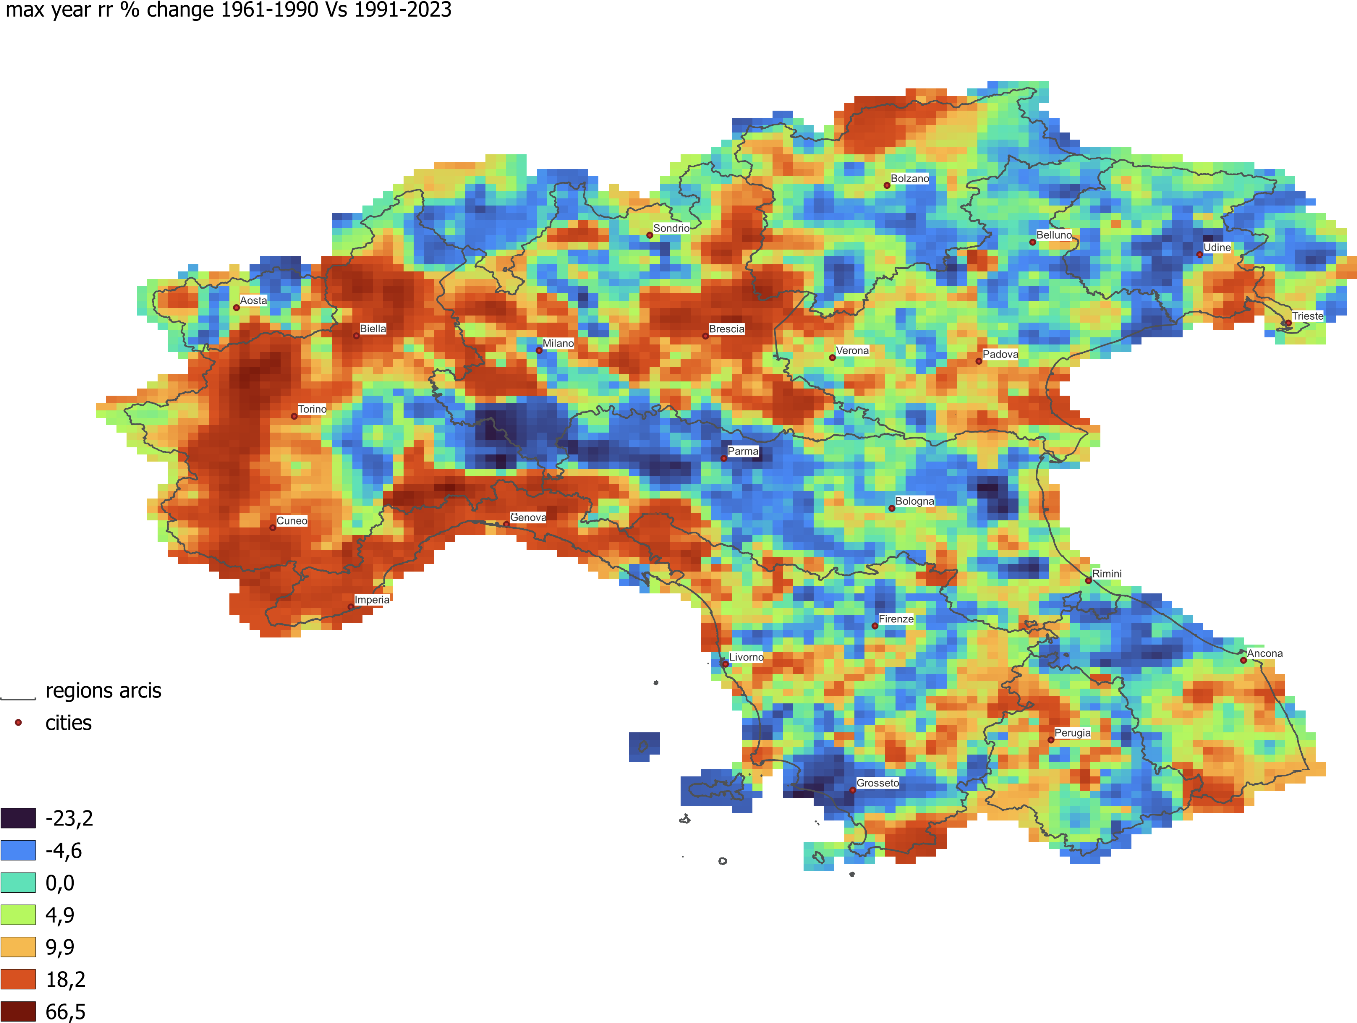
It is worth noting the good visual correlation existing between the areas in Fig. 10 with strong positive changes and the areas in Fig. 8 affected by significant positive trends in maximum yearly events.
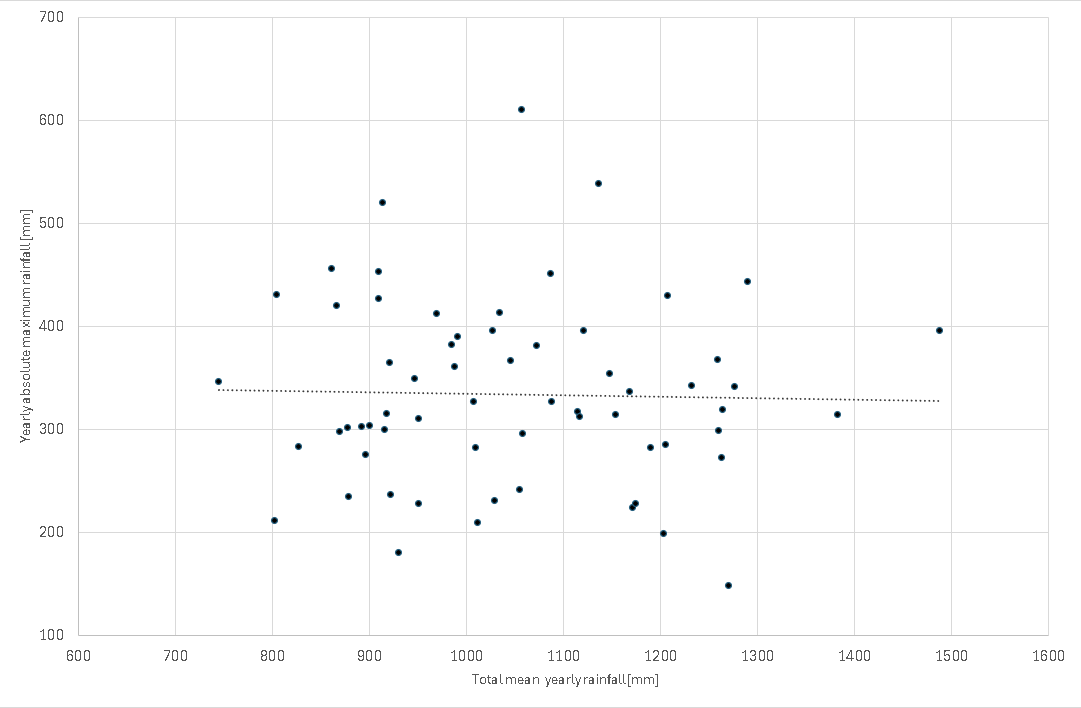
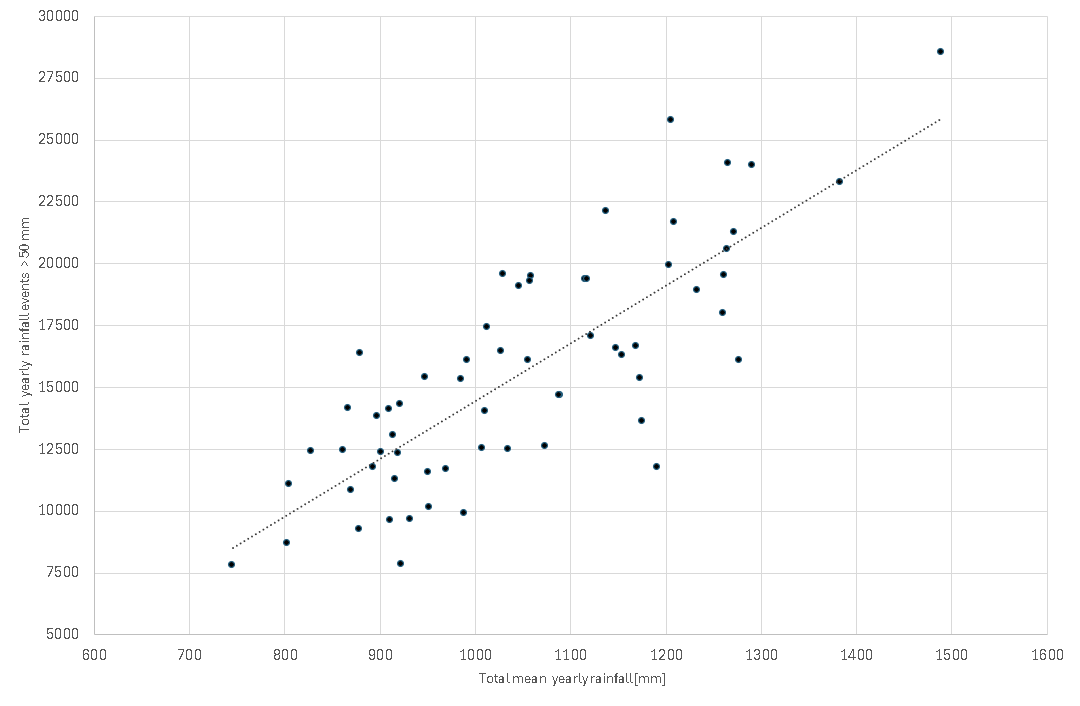
To disentangle the scale effects associated with the extreme precipitation intensity and frequency, it is useful to investigate the correlation of average yearly precipitation (Rmed) with the absolute maximum precipitation (RX_abs) (scatterplot in Fig. 14) and the number of annual events exceeding 50 mm (R>50), the latter represented in the scatterplot in Fig. 15.
The correlations under examination are both highly significant: R = 0.3726, p-Value = 0.002636 for Rmed vs. RX_abs, and R = 0.8011, p-Value = 0.002636 for Rmed vs. R>50. However, the determination coefficient (R²) highlights important differences in the explained variance: R² = 0.1389 for Rmed vs. RX_abs, and R² = 0.6418 (highly significant) for Rmed vs. R>50.
This suggests that the share of variance explained by mean precipitation is much more limited for RX_abs than for R>50. In our view, this can be attributed to the fact that R>50 is primarily driven by macroscale and mesoscale phenomena, while RX_abs is predominantly influenced by local-scale (beta mesoscale) factors, such as the triggering mechanisms of storm events that lead to high-intensity precipitation.
Fig. 11 shows the percentage change in the number of days with rainfall greater than 50 mm between the periods 1961-1990 and 1991-2023, calculated using the same approach described for Fig. 10. It is important to note the good visual correlation existing between areas in Fig. 11 with strong positive changes and areas in Fig. 10 affected by significant positive trends in yearly events greater than 50 mm. On the other hand, the areas with negative trends in Fig. 10 (light blue) correspond to areas of more than 50% reduction in that number of days.
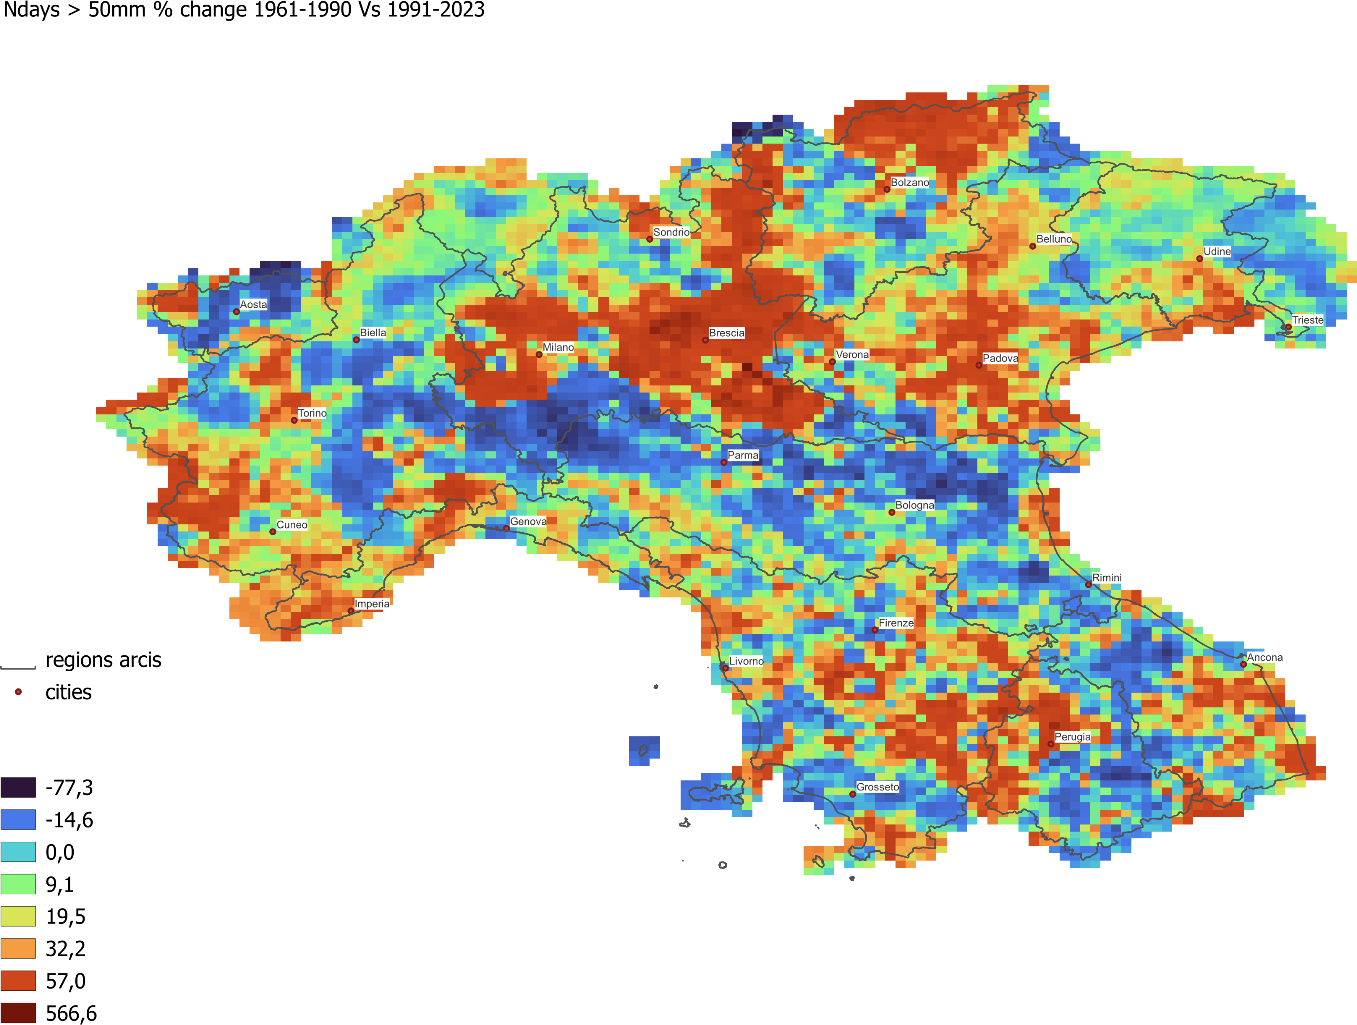
The correlation analysis performed between the percentage change in the number of days with rainfall greater than 50 mm and the percentage change in absolute maximum values evidence a Pearson correlation coefficient of 0. 5165 and a p-value less than 0.01 (highly significant).
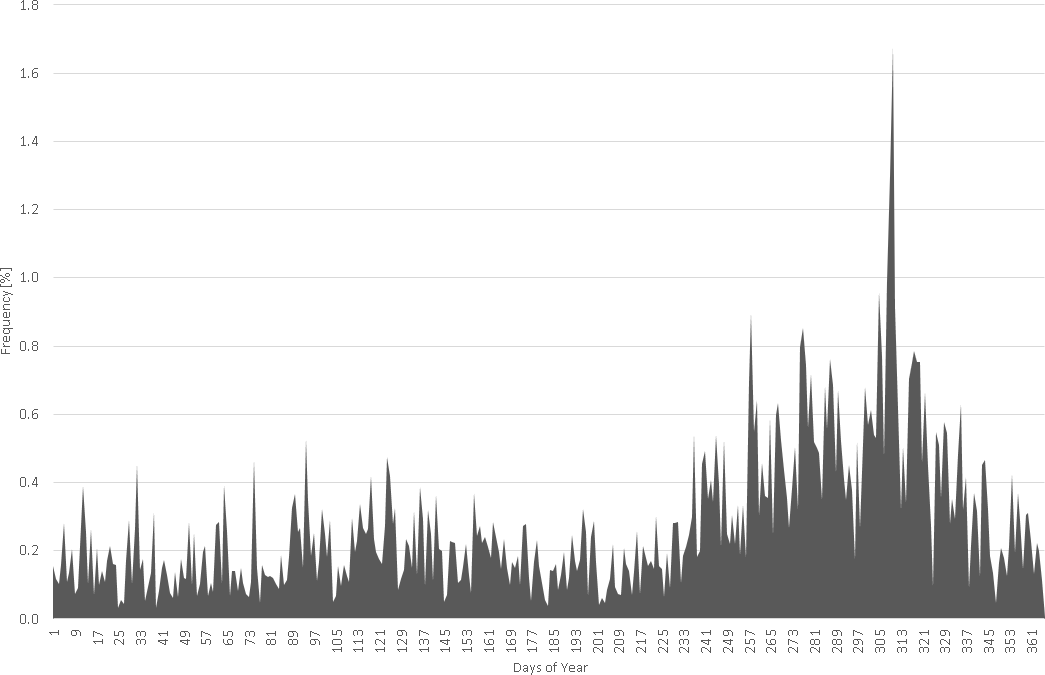
Fig. 12 plots the average daily frequency of events > 50 mm on the period 1961-2023, where there is a clear dominance of events during October/November periods.
Fig. 13 shows the monthly frequency of events > 50 mm (1991-2023 vs 1961-1990). Note that the frequency increases in the autumn and early winter period, with a growth peak in November. A significant frequency drop is recorded in August and smaller drops are observed from January to April.
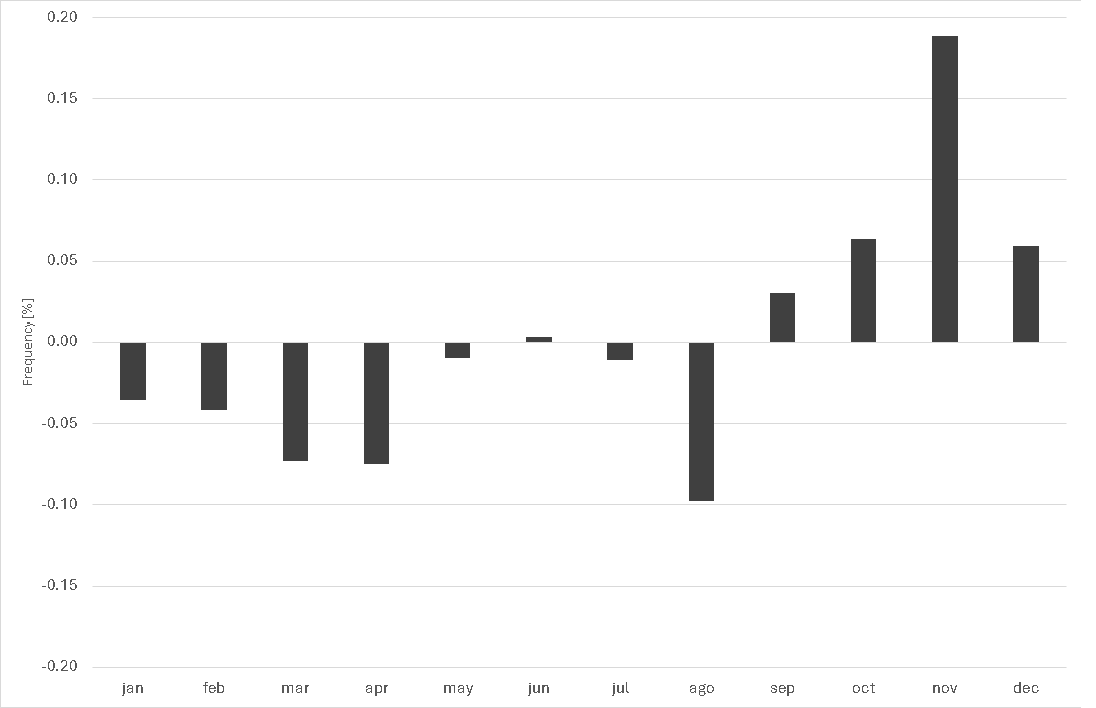
In summary, the diagram of frequency monthly variation highlights the increasing frequency of intense precipitation events in the autumn as already shown by Grazzini et al. (2019).
Increased frequency in autumn, mainly in November, could be possibly associated with changes in atmospheric circulation and with the increase of surface temperatures of Mediterranean sea which is the main source of humidity for precipitating systems that affect the Italian area although there is a significant contribution from Atlantic humidity in Central Northern Italy (Giustini et al., 2016).
Finally Tab. 2 presents a comparison of numerical distributions of rainfall events between two time periods: 1991-2023 (33 years) and 1961-1990 (30 years), the longer one has been normalized to 30 years multiplying values for (30/33). To evaluate the significance of the difference of number events per classes of daily precipitation intensities was performed the chi-squared test which results are reported in Tab. 3. As can be notified, all p-values are extremely small (close to 0) indicating that the differences between the two periods are highly significant. The significance of the changes has been identified for all the classes. Specifically, only for the class (0-25) , the lower one, there is a significant decrease in the events, for all the other higher classes there is a significant increase in the events.
| Class | Total num (1961-1990) | Total num (1991-2023) | Total num (1991-2023) * | Variation (%) |
|---|---|---|---|---|
| 0-25 | 20440061 | 21395771 | 19450701 | -4.8 |
| 25-50 | 1724348 | 1929040 | 1753673 | 1.7 |
| 50-75 | 318995 | 382545 | 347768 | 9.0 |
| 75-100 | 80935 | 103922 | 94475 | 16.7 |
| 100-125 | 23836 | 35305 | 32095 | 34.6 |
| 125-150 | 8960 | 13868 | 12607 | 40.7 |
| 150-175 | 3692 | 6016 | 5469 | 48.1 |
| 175-200 | 1681 | 2800 | 2545 | 51.4 |
| 200-625 | 1618 | 2793 | 2539 | 56.9 |
| Class | Chi2 Statistic | P-Value | Significant trend |
|---|---|---|---|
| 0-25 | 24537.8464 | 0.0000E+00 | Negative |
| 25-50 | 247.2497 | 1.0329E-55 | Positive |
| 50-75 | 1241.6642 | 5.3781E-272 | Positive |
| 75-100 | 1045.0930 | 2.8372E-229 | Positive |
| 100-125 | 1219.6820 | 3.2202E-267 | Positive |
| 125-150 | 616.7956 | 3.7214E-136 | Positive |
| 150-175 | 344.7245 | 5.9702E-77 | Positive |
| 175-200 | 176.8105 | 2.4090E-40 | Positive |
| 200-625 | 204.0871 | 2.6791E-46 | Positive |
The analysis of North-Central Italy extreme precipitations over the period 1961-2023 from the ARCIS daily precipitation dataset, allows to obtain an updated precipitation climatology compliant with the WMO reference standards for the current climate.
Furthermore, with reference to extreme events, the dataset allows to have updated information on the status and variability of heavy rainfall, both in terms of intensity and frequency. The presented maps, which illustrate absolute rainfall maxima, number of days with precipitation greater than 50 mm and percentage changes between the two periods (1961-1990 and 1991-2023), provide a detailed picture of such phenomena.
From the analysis carried out it emerges that changes in the regime of precipitation extremes highlighted by ARCIS dataset are not evenly distributed. In fact, the signal of intensification mainly concerns specific areas of some North Italy regions (Piemonte, Lombardia, Liguria, Trentino Alto Adige e Veneto) while Friuli Venezia Giulia, Emilia Romagna and the Central Italy regions show an overall absence of trends.
The absence of a generalized increase highlights the importance of analyzing phenomena at beta (20-200 km) and gamma mesoscale (2-20 km), to fully understand the local impacts and the associated risks. The absence of trends in precipitation maxima for Toscana region obtained from ARCIS dataset agrees with the results of Fatichi and Caporali (2009) and Pinna (2014); results for Piemonte region are in agreement with those obtained by Bassi et al. (2011) while results for Lombardia are in agreement with Parisi et al (2014).
Moreover, it is worth noting that the areas experiencing the two absolute annual precipitation maxima in Italy – the Carnia region in Friuli Venezia Giulia (with over 3000 mm/year) and the northern shore of Lake Maggiore (2400 mm/year) (Mori, 1964; Frei and Schär, 1998) – exhibit overall stationarity in extreme precipitation.
This phenomenon is particularly fascinating because these maxima result from the interaction between the Alpine orography and the synoptic circulation. Therefore, the temporal variability of extreme precipitation in these areas can be regarded as an important indicator of the influence of synoptic-scale signals on the mesoscale climate. Another interesting phenomenon evident in Northern Italy is the presence of areas showing an increase in the frequency or intensity of precipitation adjacent to areas that exhibit no change, or even a decrease. This reflects one of the most remarkable characteristics of the climate system: its variability across all temporal and spatial scales (Franzke et al., 2020).
Based on our experience with local-scale analysis and forecasting in the Po Valley, we hypothesize that these observed trends result from mesoscale processes triggered by interactions with both larger-scale processes (e.g., synoptic circulation and air mass advection) and smaller-scale processes (e.g., boundary layer dynamics). This aligns with the idea of the Po Valley as a “laboratory for mesoscale meteorological processes,” a concept recently demonstrated in the context of tornado development (De Martin et al., 2024).
Precipitation is inherently a complex phenomenon, driven by causal factors across a wide range of scales, from macro- to microscale. At the macroscale, factors include westerlies and large blocking systems; at the mesoscale, phenomena such as foehn-stau mechanisms dominate; and at the microscale, processes such as boundary layer dynamics contribute energy and condensation nuclei to precipitating systems. Consequently, in our specific case, the frequency and intensity of extreme precipitation are influenced by a range of processes, including:
a) Mediterranean Sea temperature, which directly affects the flow of sensible and latent heat, warming and moistening the overlying air mass.
b) Temperature of cold air masses (polar continental, maritime, or Arctic) that reach the Mediterranean region from specific source regions.
c) Cyclogenetic activity within the basin, such as lee cyclogenesis in the Gulf of Genoa and the Balearic area, or the cutoff of Atlantic baroclinic waves (Mariani and Parisi, 2013; Carniel et al., 2024).
d) Synoptic disturbances (e.g., Atlantic baroclinic waves) reaching the basin (Carniel et al., 2024).
e) Orographic precipitation processes, particularly significant for the Mediterranean region due to the surrounding mountain ranges, including the Pyrenees, Alps, Apennines, and Atlas Mountains (Rotunno and Houze, 2007).
f) Other factors, such as convection organization, thermal and moisture stratification, precipitation efficiency, air-stream ascent mechanisms, interactions with orography, proximity to the sea, and vertical wind shear. The Mediterranean, with its warm sea (especially in autumn) and surrounding high orography, provides an ideal setting to study these phenomena (Khodayar et al., 2018).
About the above processes, only one subset currently shows indications of trends. For instance, with reference to point (a), Mediterranean Sea surface temperatures are rising, with the fastest warming occurring in the eastern Mediterranean and the northern half of the western Mediterranean, while the trend is weaker on the south part of Italy (Bonacci and Vrsalovi´c, 2022). This warming increases the potential moisture supply for precipitating systems, especially in autumn, when the temperature difference between the sea surface and the overlying air is greatest (Grazzini et al., 2019; Lavers and Villarini, 2015).
On the other hand, several studies identify large-scale precursors of Mediterranean extreme precipitation events. An upper-level trough (Rossby wave) often induces a warm, moist southerly airflow over the western Mediterranean (Pinto et al., 2013). More than half of these moist airflows are classified as Warm Conveyor Belts (WCB), highlighting the roles of baroclinic instability and large-scale lifting (Raveh-Rubin and Wernli, 2015).
Air trajectory analysis emphasizes the importance of large-scale transport and local sources of water vapour for precipitation systems, particularly during convective events. Remote origins, such as the North and subtropical Atlantic, contribute significantly to stratiform precipitation, while local sources like Mediterranean evaporation are more influential for convective systems ( Winschall et al., 2014). Within extratropical cyclones’ WCB, moisture advection often occurs via atmospheric rivers – narrow filaments of high integrated water vapor – which are precursors to heavy precipitation in mountainous regions, including Europe (Lavers and Villarini, 2013).
With reference to point (b) Nygard et al (2023), working on the 1979-2020 November to March period, stated that the extremeness of cold air masses reaching the Mediterranean basin from polar and arctic area has not decreased at the same rate with the warming climate, although the Arctic source areas of cold air masses have experienced Arctic amplification. Therefore, the thermal contrast with the warm air overlying the Mediterranean basin remains high and this translates into a greater potential supply for precipitating systems.
With reference to point (c), Carniel et al. (2024), analysing the frequency of explosive cyclones (ECs) in the Mediterranean from 1979 to 2020, highlighted that no clear linear trend is discernible in the data, as the number of ECs fluctuates significantly over the years. Periods of high activity, such as in the early 1980s and between 2009 and 2012, contrast with years of reduced or no activity, underscoring the variability in EC occurrences rather than a consistent increase or decrease over time.
The local nature of the intensity increase that emerges from the analysis of the ARCIS dataset translates into the fact that areas with significant increases in both the intensity of maximum precipitation and the frequency of extreme events, are often close to neighbouring areas that show a reduction in such phenomena. This leads us to wonder what the normal climatic conditions are to adopt for the planning of adaptation works to extreme rainfall. On this topic, the debate remains open; however, in our opinion, it would be essential to adopt an approach based on sufficiently large areas, such as those defined in the past by the National Hydrographic Service. In a publication dedicated to maximum precipitation over 1 to 5 days for the period 1921–1950, Northern Italy was divided into six homogeneous areas (Cati, 1981)
In any case, we believe that daily rainfall data from the last 50-70 years can provide valuable insights for planning adaptation activities. However, relying solely on 24-hour cumulative rainfall data is insufficient; it is essential to analyse shorter intervals (e.g., 1, 3, 6, and 12 hours) to gain a more detailed understanding. The ARCIS database, with its spatial coverage, offers a valuable tool for analyzing such phenomena, but it will be necessary to continue collecting high-quality data to identify any new trends or anomalies. This will be crucial for proper planning and to address any future changes in the rainfall regime.
In conclusion, precipitation extremes in North-Central Italy show strong local variability, rather than a homogeneous increase on a large scale. This highlights the need for flexible and targeted strategies of adaptation for climate risk management in its hazard, exposure, and vulnerability components. Infrastructure adaptive capacity and water resources planning will need to consider the geographic specificities of each area to ensure an effective response to climate change, protecting communities and minimizing damage caused by extreme events.
A final element worth of discussion is the issue of data quality, which is a critical element in gridded datasets. Such datasets are based on the data reconstruction in individual cells extreme precipitation events that are characterized by very high spatial and temporal variability.
In this context, it is worth noting that Sun et al. (2017) conducted a comprehensive review of data sources and estimation methods used in 30 currently available precipitation gridded datasets, which are based on rain gauges, satellite data, and reanalysis data. Their discrepancies analysis among these datasets revealed significant differences in both the magnitude and variability of precipitation estimates, with annual precipitation estimates differing by as much as 300 mm/year across the products.
Additionally, Mallakpour et al. (2022) conducted an analysis of six gridded precipitation datasets for the United States, focusing on the period from 1983 to 2017. Their study highlighted substantial discrepancies in the observed changes in the characteristics of both extreme and non-extreme precipitation events. In the specific ARCIS case, data validation was performed via:
– checks to eliminate spurious zero rainfall periods (no rainfall where other stations report rainfall) due to data digitization errors
– tests for statistical homogeneity (such as SNHT and Craddock-Vincent test) to eliminate data that did not meet the criteria
– synchronicity tests to ensure that all stations were aligned over the same observation period. In some cases, it was necessary to move the data by one day to synchronize the recording periods.
On the other hand, it is important to acknowledge that a significant source of inhomogeneity in worldwide rainfall measurement time series rises from the radical changes in observation technology that occurred mostly between 1980 and 2000. This period saw the transition from older manual or automatic stations with mechanical transduction to modern automatic stations with electronic transduction (WMO, 2021b). This technological shift was often accompanied by changes in measurement locations, introducing biases due to inconsistencies in meteorological instruments and sampling points.
From a broader perspective, it is crucial to recognize that inhomogeneities in meteorological measurements can result from various factors, including changes in measurement locations, observing technology (hardware), radiation shields, or the software algorithms used to convert instrument signals into meteorological variable values. To address such issues, the WMO recommends that data from automatic weather stations (AWS) be processed and adjusted before the discontinuation of manual measurements (Lukasova et al., 2024). However, this recommendation has been followed in only a limited number of cases, such as the Swiss meteorological network (Heimo et al., 2003).
In contrast, many weather station networks (mesonets) lack national and international coordination, suffer from poor maintenance, inadequate data quality and redundancy, as noted by Silvestri et al. (2022)
The work was carried on ARCIS dataset which refers to data from Northern Italy and from some regions (three) of Central Italy. This analysis was referred to some average precipitation characteristics for the period 1961-2023 and highlighted that precipitation patterns are stationary despite the presence of a significant interannual variability. The analysis was then extended to intensity and frequency trends of extreme precipitation and highlighted that 83% and 86% of the area does not show significant increases in frequency and intensity respectively, while 11% and 15% show significant increases and 2% and 3% show significant decreases. Finally, regarding seasonality, it was highlighted an extreme phenomena frequency increase in autumn (from October to December with a more marked increase in November), a weak decrease from January to April and a marked decrease in August. The obtained indications have significant implications in terms of agricultural and hydro-geological management.
Finally, we would like to point out that it would be important that the activities will expand also to the remaining part of the Italian Country to have a meteorological data homogeneous gathering system coming from Italian weather station networks (mesonets).
The authors thank the ARCIS researchers’ group for their precious volunteers-based work and in particular Dr. Valentina Pavan for her tempestive and kind reply to our requests on dataset metadata.
Alpert P., Ben-Gai T., Baharad A., Benjamini Y., Yekutieli D., Colacino M., Diodato L., Ramis C., Homar V., Romero R., Michaelides S., Manes A., 2002. The paradoxical increase of Mediterranean extreme daily rainfall in spite of decrease in total values. Geophysical Research Letters 29(11): 301-314
Antolini G., Auteri L., Pavan V., Tomei F., 2015. A daily high-resolution gridded climatic data set for Emilia-Romagna, Italy, during 1961-2010. International Journal of Climatology, August 2015, https://doi.org/10.1002/joc.4473
Barton Y., Rivoire P., Koh J., Ali M. Kopp J., Martius O., 2022. On the temporal clustering of European extreme precipitation events and its relationship to persistent and transient large-scale atmospheric drivers. Weather and Climate Extremes, Volume 38, December 2022, 100518.
Bassi M., Colombino G., Cremonini R., Masciocco L., 2011. Analisi delle piogge estreme in Piemonte. Atti del convegno Le modificazioni climatiche ed i rischi naturali, 53-58.
Bauer, V. M., & Scherrer, S. C. (2024). The observed evolution of sub-daily to multi-day heavy precipitation in Switzerland. Atmospheric Science Letters 25(9): e1240. https://doi.org/10.1002/asl.1240
Bonacci, O.; Vrsalovi´c, A., 2022. Differences in Air and Sea Surface Temperatures in the Northern and Southern Part of the Adriatic Sea. Atmosphere 2022, 13: 1158. https://doi.org/10.3390/atmos13071158
Brunetti M., Caloiero T., Coscarelli R., Gullà G., Nanni T., Simolo C., 2010. Precipitation variability and change in the Calabria region (Italy) from a high resolution daily dataset. https://doi.org/10.1002/joc.2233
Carniel C.E., Ricchi A., Ferretti R., Curci G., Miglietta M.M., Reale M., Serafini P., Wellmeyer E.D., Davolio S., Zardi D., Kantha L., 2024. A high-resolution climatological study of explosive cyclones in the Mediterranean region: Frequency, intensity and synoptic drivers. Q J R Meteorol Soc. 150: 5561–5582.
Cati L., 1981. Idrografia e idrologia del Po, Roma, Istituto Poligrafico e Zecca dello Stato, 310 pp.
De Martin F., Davolio S., Miglietta M.M., Levizzani V., 2024. A Conceptual Model for the Development of Tornadoes in the Complex Orography of the Po Valley. Monthly Weather Review 152(6): 1357-1377.
Doswell III C.A., Brooks H.E., Maddox R.A., 1996. Flash Flood Forecasting: An Ingredients-Based Methodology. Weather and forecasting 11(4): 560-581.
Fatichi S., Caporali E., 2009. A comprehensive analysis of changes in precipitation regime in Tuscany. International Journal of Climatology 29(13): 1883-1893.
Franzke C.L.E., Barbosa S., Blender R., Fredriksen H.-B., Laepple T., Lambert F., 2020. The structure of climate variability across scales. Reviews of Geophysics 58: e2019RG000657. https://doi.org/10.1029/2019RG000657
Frei C., Schär C., 1998. A precipitation climatology of the Alps from high-resolution rain-gauge observations. Int. J. Clim. 18(8): 873-900.
Gilbert R.O, 1987. Statistical methods for environmental pollution monitoring. Van Nostrand Reinhold, New York, 321 pp.
Giustini F., Brilli M. and Patera A., 2016. Mapping oxygen stable. isotopes of precipitation in Italy. Journal of Hydrology: Regional Studies 8(2016): 162-181.
Grazzini F., Craig G.C., Keil C.,Antolini G., Pavan V., 2019. Extreme precipitation events over northern Italy. Part I: A systematic classification with machine-learning techniques. Q J R Meteorol Soc. 146: 69-85. https://doi.org/10.1002/qj.3635
Heimo A. , Konzelmann T., 2003. SwissMetNet: Renewal of the Swiss Meteorological Networks. Proceedings of the International Conference on the Experiences with Automatic Weather Stations, Torremolinos, Spain, 19-21 February, 2003.
IPCC, 2023. Sections. In: Climate Change 2023: Synthesis Report. Contribution of Working Groups I, II and III to the Sixth Assessment Report of the Intergovernmental Panel on Climate Change [Core Writing Team, H. Lee and J. Romero (eds.)]. IPCC, Geneva, Switzerland, pp. 35-115, https://doi.org/10.59327/IPCC/AR6-9789291691647
Isotta F.A., Frei C., Weilguni V., Percec Tadic M., Lassegues P., Rudolf B., Pavan V., Cacciamani C., Antolini G., Ratto S.M., Munari M., Micheletti S., Bonati V., Lussana C., Ronchi C., Panettieri E., Marigo G., Vertacnik G., 2013. The climate of daily precipitation in the Alps: development and analysis of a high-resolution grid dataset from pan-Alpine rain-gauge data. Int J Climatol. 34(5): 1657-1675.
Katz J., 2023. Concepts across the Sciences: Stability and Change, USA Library of congress, https://blogs.loc.gov/teachers/2023/03/concepts-across-the-sciences-stability-and-change/
Khodayar S., Kalthoff N. , Kottmeier C. ,2018. Atmospheric conditions associated with heavy precipitation events in comparison to seasonal means in the western Mediterranean region. Climate Dynamics 51(3): 951-967.
Lavers D.A. , Villarini G., 2013. The nexus between atmospheric rivers and extreme precipitation across Europe. Geophysical Research Letters 40: 3259-3264. https://doi.org/10.1002/grl.50636
Lavers D.A. , Villarini G., 2015. The relationship between daily European precipitation and measures of atmospheric water vapour transport. International Journal of Climatology 35: 2187-2192. https://doi.org/10.1002/joc.4119
Lebon E., Dumas V., Pieri P., Schultz H.R. , 2003. Modelling the seasonal dynamics of the soil water balance of vineyards. Funct. Plant Biol. 30: 699-710.
Libertino A., Macchia S., Claps P., 2016. Nubifragi eccezionali in Italia: analisi preliminare di rilevanza sugli eventi 1920-2000, Atti del XXXV Convegno Nazionale di Idraulica e Costruzioni Idrauliche, Bologna, 14-16 Settembre 2016, 4 pp. (in Italian)
Libertino A., Ganora D., Claps P., 2018 Technical note: Space–time analysis of rainfall extremes in Italy - clues from a reconciled dataset. Hydrol. Earth Syst. Sci. 22: 2705-2715. https://doi.org/10.5194/hess-22-2705-2018
Libertino A., Ganora D., Claps P., 2019. Evidence for increasing rainfall extremes remains elusive at large spatial scales: the case of Italy. Geophysical Research Letters https://doi.org/10.1029/2019GL083371
Lukasova V., Varsova S., Onderka M., Bilcik D., Buchholcerov A., Nejedl P., 2024. Continuity of long-term climate data series after the transition from manual to automatic weather station. Contributions to Geophysics and Geodesy 54(3): 251-266.
Mallakpour I., Sadeghi M., Mosaffa H., Akbari Asanjan A., Sadegh M., Nguyen P., Sorooshian S., and AghaKouchak A., 2022. Discrepancies in changes in precipitation characteristics over the contiguous United States based on six daily gridded precipitation datasets. Weather Clim. Extrem. 36: 100433. https://doi.org/10.1016/j.wace.2022.100433
Mariani L., Parisi S., 2013. Extreme rainfalls in the Mediterranean area, in Storminess and environmental changes: climate forcing and responses in Mediterranean region. Diodato and Bellocchi (Eds.), Springer.
Mariani L. , Parisi S. , Cola G. , Failla O., 2012. Climate change in Europe and effects on thermal resources for crops. International Journal of Biometeorology 56: 1123-1134. https://doi.org/10.1007/s00484-012-0528-8
Mori A., 1964. Carta delle precipitazioni medie annue in Italia (trentennio 1921-1950), CNR, Istituto di geografia dell’Università di Pisa, Roma, Cartografia Riccardi (in Italian).
Nygard T., Papritz L., Naakka T., Vihma T., 2023. Cold wintertime air masses over Europe: where do they come from and how do they form? Weather Clim. Dynam. 4: 943-961. https://doi.org/10.5194/wcd-4-943-2023
Parisi S.G., Mariani L., Cola G., 2014. Extreme rainfall in the Lombardy region. Italian Journal of Agrometeorology 1: 19-28.
Pavan V., G.Antolini, G.Agrillo, L. Auteri, R. Barbiero, V. Bonati, F. Brunier, C.Cacciamani, O. Cazzuli, A. Cicogna, C. De Luigi, L. Maraldo, G. Marigo, R. Millini, E. Panettieri, S. Ratto, C. Ronchi, S. Saibanti, A. Sulis, F. Tomei, R. Tomozeiu, I. Torlai, G. Villani, 2013. The ARCIS Project. Italian Journal of Agrometeorology 2: 51-55.
Pavan V., Antolini G., Barbiero R., Berni N., Brunier F. Cacciamani C. Cagnati A., Cazzuli O., Cicogna A., De Luigi C., Di Carlo E., Francioni M., Maraldo L., Marigo G., Micheletti S. Onorato L., Panettieri E., Pellegrini U., Pelosini R., Piccinini D., 2018. High resolution climate precipitation analysis for north-central Italy, 1961–2015’. Climate Dynamics 52: 1-19.
Pinna S., 2014. La falsa teoria del clima impazzito, 158 pp. (in italian)
Pinto J.G., Ulbrich S., Parodi A., Rudari R., Boni G., Ulbrich U., 2013. Identification and ranking of extraordinary rainfall events over northwest Italy: the role of Atlantic moisture. Journal of Geophysical Research: Atmospheres 118: 2085-2097. https://doi.org/10.1002/jgrd.50179
Piotrowicz K., Ciaranek D., 2020. A selection of weather type classification systems and examples of their application. Theoretical and Applied Climatology 140: 719-730. https://doi.org/10.1007/s00704-020-03118-2
Pucik T., 2024. Meteorological analysis of extreme flash flood situation in the Valencia region, https://www.essl.org/cms/meteorological-analysis-of-extreme-flash-flood-situation-in-the-valencia-region/ (site visited at 27 June 2025)
Raveh-Rubin S., Wernli H., 2015. Large-scale wind and precipitation extremes in the Mediterranean – a climatological analysis for 1979-2012. Quarterly Journal of the Royal Meteorological Society 141: 2404-2417. https://doi.org/10.1002/qj.2531
Reid P.C., Hari R.E., Beaugrand G., Livingstone D.M., Marty C., Straile D., Barichivich J., Goberville E., Adrian R., Aono Y., Brown R., Foster J., Groisman P., Hélaouët P., Hsu H.H., Kirby R., Knight J., Kraberg A., Li J., Lo T.T., Myneni R.B., North R.P., Pounds J.A., Sparks T., Stübi R., Tian Y., Wiltshire K.H., Xiao D., Zhu Z., 2015. Global impacts of the 1980s regime shift. Glob Chang Biol. 22(2): 682-703. https://doi.org/10.1111/gcb.13106
Rotunno R., Houze R.A., 2007. Lessons on orographic precipitation from the Mesoscale Alpine Programme. Q. J. R. Meteorol. Soc. 133: 811-830.
Silvestri L., Saraceni M., Bongioannini Cerlini P., 2022. Quality management system and design of an integrated mesoscale meteorological network in Central Italy. Meteorological Applications 29: e2060. https://doi.org/10.1002/met.2060
Skipper S., Perktold J., 2010. Statsmodels: Econometric and statistical modeling with python. Proceedings of the 9th Python in Science Conference.
Sun Q., Miao C., Duan Q., Ashouri H.,Sorooshian S., Hsu K.-L., 2017. A review of global precipitation data sets: Data sources, estimation, and inter-comparisons. Reviews of Geophysics 56: 79-107. https://doi.org/10.1002/2017RG000574
Sun Q., Zhang X., Zwiers F., Westra S., Alexander L.V., 2021. A Global, Continental, and Regional Analysis of Changes in Extreme Precipitation. Journal of Climate 1 Jan 2021: 243-258. https://doi.org/10.1175/JCLI-D-19-0892.1
Winschall A., Sodemann H., Pfahl S. , Wernli H., 2014. How important is intensified evaporation for Mediterranean precipitation extremes? Journal of Geophysical Research: Atmospheres 119: 5240-5256. https://doi.org/10.1002/2013JD021175
World Meteorological Organization, 2021a. Updated 30-year reference period reflects changing climate, https://wmo.int/media/news/updated-30-year-reference-period-reflects-changing-climate (site visited the 3 January 2025)
World Meteorological Organization, 2021b. Guide to meteorological instruments and methods of observation (WMO guide n. 8), Geneva, CH, https://community.wmo.int/en/activity-areas/imop/wmo-no_8