https://doi.org/10.36253/ijam-3676
Received: July 23, 2025; Accepted: January 22, 2026; Published: September 15, 2026
Monitoring drought impacts through spatiotemporal analysis of climatic and vegetative indices in the Drâa River watershed, Morocco
1 Laboratory of Geosciences, Geotourism, Natural Hazards and Remote Sensing, Faculty of Sciences Semlalia, Cadi Ayyad University, Boulevard Prince My Abdellah, B.P. 2390, 40000 Marrakech, Morocco
2 Department of Geography, Université Laval, Pavillon Abitibi-Price, 2405, rue de la Terrasse, Quebec G1V 0A6, Canada
3 Department of Geology and Geological Engineering, Université Laval, Pavillon Adrien Pouliot 1065, avenue de la Médecine, Local 4309, Québec G1V 0A6, Canada
Emails: k.majdouli.ced@uca.ac.ma; algouti@uca.ac.ma; Najat.Bhiry@rec.ulaval.ca; john.molson@ggl.ulaval.ca; abalgouti@uca.ac.ma; k.lamrani.ced@uca.ac.ma; i.elkihal.ced@uca.ac.ma
*Corresponding author
Abstract. The Drâa River watershed, characterized by a semi-arid climate, is particularly vulnerable to the risk of desertification, a threat exacerbated by the effects of global warming. This study is based on an analysis of climatic and hydrological variations in the Drâa basin, using satellite and terrestrial data. Climatic indices including SPI and PDSI, and vegetation indices VCI, TCI, VHI and NDVI, were calculated to assess the impact of climatic conditions on water resources and vegetation cover. In addition, the water reflectance index (NDWI) was used to analyze variations in water level of the El Mansour Eddahbi reservoir. The remote sensing results were compared with records from local hydrological stations to ensure consistent and thorough interpretation. The analyses show that the Drâa watershed is currently experiencing the longest drought in its recorded history, although its intensity is lower than that observed between 1981 and 1984. Over a 23-year period (2000-2023), only 9 years were relatively wet, compared to 14 years of drought, according to the SPI index. These climatic conditions have put considerable pressure on water resources and vegetation cover, as evidenced by variations in vegetation indices and climatic parameters. The reduction in the surface area and perimeter of the El Mansour Eddahbi reservoir, observed by remote sensing, was corroborated by the decrease in water volume measured in situ. Prolonged droughts in this region therefore pose a significant threat to water and environmental resources.
Keywords: drought, remote sensing, climatic indices, vegetative indices, climate change.
Contents
Brightness Temperature-Based Indices
Combined Reflectance and Brightness Temperature-Based Indices
Rainfall variation-based indices
Observed climatic and hydrological parameters
Highlights
- –The impacts of drought were assessed in the Drâa basin using satellite indices.
- –Significant vegetative stress was detected during the main drought episodes.
- –Strong correlations confirm the influence of climatic factors on vegetation.
- –Validation tests, based on ground data, confirmed the reliability of the results.
Introduction
Drought, a recurring natural phenomenon with dramatic consequences, is one of the most complex challenges facing arid and semi-arid regions such as Morocco. Although drought is not a new concept in Morocco (the country has always experienced alternating dry and wet periods), in recent years, the frequency of periods vulnerable to drought risk has become increasingly important and alarming (Stour & Agoumi, 2008; Hadria et al. 2019; Lahbous, 2023; Gumus et al., 2024; Bijaber et al., 2024). With an economy largely based on agriculture, Morocco therefore faces major challenges related to increasing aridity, especially in its arid and semi-arid regions (Hadri et al., 2022; Lebdi & Maki, 2023).
At the national level, the impacts of drought are not limited to the environment. In economic terms, for example, the effects are significant. Lahbous et al. (2023) showed that successive droughts have caused a significant decline in agricultural value added, which has significantly reduced the national gross domestic product (GDP). This situation exacerbates the vulnerability of the rural population and threatens the country’s food security. In 2017, the World Bank published a report on environmental costs in Morocco (Dahan, 2017), estimating that environmental degradation accounts for a loss of about 3.5% of national GDP. Among these costs, the degradation of water resources stands out, accounting for around 1.6% of GDP, surpassing air pollution, which in turn accounts for 1.05% of GDP. In addition, degraded soils, affected by erosion and land conversion into desertified areas, also contribute significantly to environment-related economic losses (Dahan, 2017).
In this context, the Drâa River watershed, a semi-arid region in southern Morocco, stands out for its increased vulnerability to drought. The Drâa watershed is particularly vulnerable due to its dependence on groundwater to meet the needs of the local population (Ouysse et al., 2010). However, this vital resource is seriously threatened by persistent meteorological drought, exacerbated by extreme adverse weather conditions. Rainfall deficits, coupled with rising temperatures and a wide temperature range, are significantly reducing wetlands, with direct impacts on vegetation cover, surface water and groundwater (Saouabe et al., 2022; Sadiki & Hanchane, 2024). Adverse climatic conditions, combined with increasing demographic and industrial pressures, have placed the Drâa basin in a critical and alarming situation. In response to these challenges, it has become imperative to implement rigorous management strategies to preserve the region’s water resources.
In this context, several studies have been conducted to map the areas most affected by the adverse effects of meteorological drought (Auclair, 1987; Agoussine et al., 2003, 2004; Schulz et al., 2004, 2008; Weber, 2004; Aït Hamza et al., 2010; Ouysse et al., 2010; Bentaleb, 2011, 2015; Baki et al., 2017; Mehdaoui et al., 2018; El Qorchi et al., 2023). However, drought management in this region, particularly in terms of forecasting and assessing its impact on water resources, remains a major challenge. When it comes to studying and managing climate risks, the availability of in situ climate and hydrological data, as well as the methods used to collect this information, continue to be key obstacles (Wang et al., 2015; Aksu et al., 2022b). New space technologies and remote sensing tools provide a variety of capabilities for monitoring climatic phenomena over large areas and long periods of time (Ji & Peters, 2003; Hao & Singh, 2015; Wang et al., 2015; Li et al., 2016; Bijaber & Rochdi 2017; Eyoh et al., 2019; Bashit et al., 2022; Houmma et al., 2023; Serbouti et al., 2023). The use of satellite sensors has replaced the traditional method based on calculating climate indices from terrestrial data measured and recorded by a limited network of meteorological and hydroclimatic stations. These stations are often inadequate and unrepresentative, especially in desert regions, which make up a significant portion of the catchment area under study. Moreover, many climate indices require data series of at least 30 years to provide convincing results. To illustrate, hydroclimatic indices such as the Standardized Precipitation Index (SPI), the Standardized Precipitation-Evapotranspiration Index (SPEI) (McKee et al. 1993), and the Palmer Drought Severity Index (PDSI) (Palmer, 1965; Li et al., 2016; Zkhiri et al., 2018; Kim et al., 2021) are often used to assess hydroclimatic drought over large spatiotemporal areas. In this context, several studies have been conducted to use satellite data in the study of drought in Morocco. The analysis of the Palmer Drought Index (PDSI) by Waroux et al. (2013) revealed a clear trend of increasing drought in the Aoulouz argan grove region over the last few decades, mainly due to the increase in mean annual temperatures, thus higher evapotranspiration and less recharge. In fact, the increase in temperature appears to be the main factor affecting the health of argan trees, limiting their natural regeneration and accelerating the degradation of the local ecosystem. According to Elair et al. (2023), the use of SPI, VCI, TCI, and VHI indices showed that the Marrakech-Safi region experienced significant variations in drought frequency between 1984 and 2022, with periods characterized by moderate to severe drought events. Several critical droughts were identified from 1981 to 2017, interspersed with periods of rainfall. However, studies indicate an increasing trend in the frequency, duration and intensity of droughts in recent decades, highlighting the challenges of water resource management and agriculture in the region (Choukrani et al., 2018). Combined analyses of remote sensing indices such as SPI, SPEI, STI, TCI and GRACE-DSI have revealed a significant worsening of drought episodes in the Bouregreg catchment located in the north-western part of Morocco. This intensification is not the result of a significant decrease in precipitation, which has remained stable overall, but rather of a growing water imbalance, fueled by a significant increase in temperature. The increase in evapotranspiration catalyzed by global warming has thus exacerbated the agricultural and hydrological forms of drought in the region (Ait Dhmane et al, 2024).
The Drâa watershed is no exception to the recent national trend of increasing drought. However, its vast surface area and the diversity of its topographic and climatic conditions make monitoring this phenomenon particularly complex. The objective of this study is to assess the risk of drought in the basin using several indices derived from satellite data for the period between 1960 and 2023. More specifically, it aims to analyze the spatial and temporal variability of drought using satellite indices based on reflectance and brightness temperature, to evaluate their performance in detecting drought events and their frequency, and to identify the most vulnerable areas of the Drâa watershed. These indices are then compared with field data provided by the Drâa-Oued Noun Water Basin Agency, as well as with trend analyses of raw climatic parameters such as precipitation and temperature.
Materials and methods
Study area
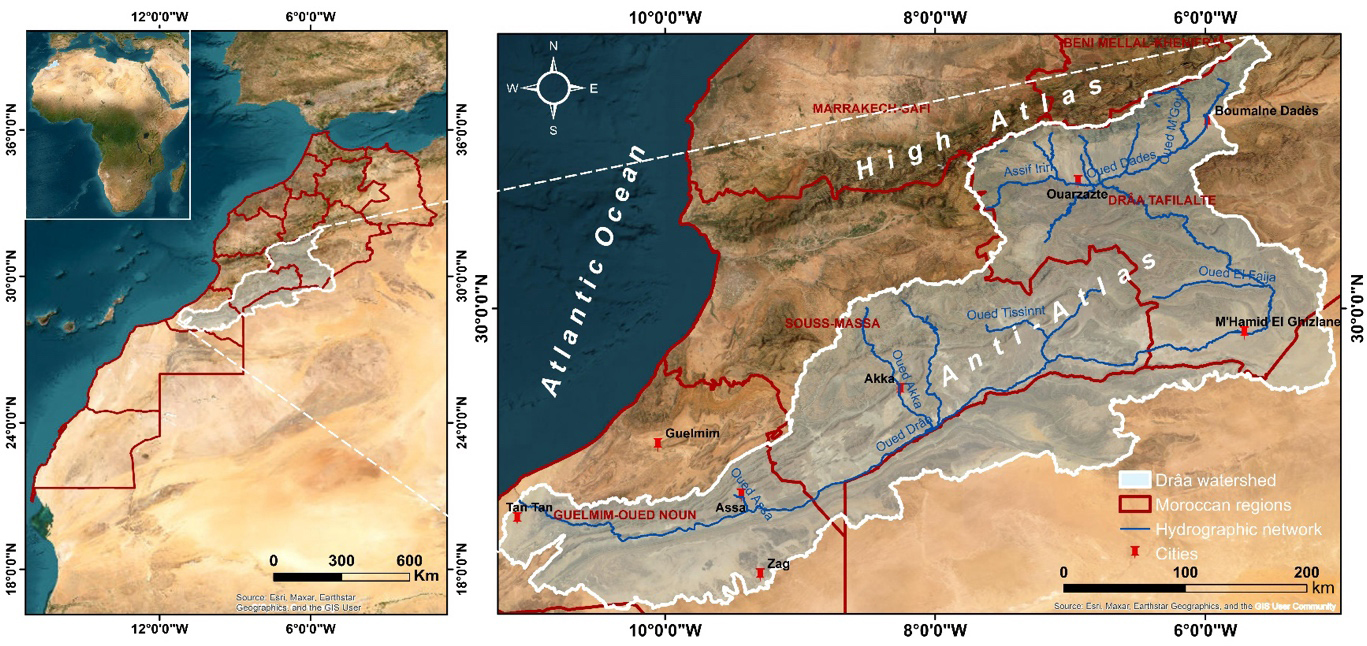
The Drâa River watershed is located in the southern part of Morocco and covers an area of approximately 93,729 km2. It is bounded to the north by the foothills of the High Atlas, from Jbel Toubkal to Jbel M’Goun, and to the south by the Saharan basin and the border with Algeria. It is bordered to the east by the Todgha and Rhis valleys and to the west by the Guelmim and Souss Massa basins (Figure 1). The Drâa is a region where geography, geology and the availability of water resources are closely linked. Its climate, which is semi-arid in the north and becomes Saharan south of M’Hamid El Ghizlane, is mainly influenced by its geographical position between the High Atlas and the Anti-Atlas, as well as its proximity to the Atlantic Ocean (DRPE, 2008; Schulz et al., 2004). The region suffers from pronounced aridity, especially in the Anti-Atlas, although cool winds from the Atlantic bring some moderation to the climate. However, the high frequency of anticyclones contributes to a severe lack of precipitation (ABHDON, 2009). From a hydrological point of view, the Drâa basin includes the longest river (Drâa River) in Morocco, with a length of 1100 km. It rises at the confluence of the Dadès and Ouarzazate rivers, at the El Mansour Eddahbi dam, and follows a winding course before emptying into the Atlantic Ocean. This great length crosses a variety of geographical and topographical contexts, giving rise to a division into the Upper, Middle and Lower Drâa, each with distinct geographical and hydrological characteristics (Figure 1) (ABHDON, 2013).
Data sources
Remote sensing data
a) NOAA and VIIRS sensor images
The National Oceanic and Atmospheric Administration (NOAA) is a platform equipped with a network of satellites, ocean buoys, meteorological stations and other instruments designed to collect variable precision, real-time information on climatic and oceanic conditions worldwide. These data are publicly accessible via a number of digital platforms. In order to characterize the meteorological aridity of our vast study area over a period of about forty years, we used data presented by NESDIS STAR (National Environmental Satellite, Data, and Information Service - Center for Satellite Applications and Research), accessible through the link https://www.star.nesdis.noaa.gov/star/index.php.
A detailed analysis of environmental conditions and climate trends using indices based on precipitation, temperature and evapotranspiration potential was made possible by using the TerraClimate database. This high-resolution data source (approximately 4 km resolution) provides a monthly overview of a number of hydrological and climatic variables essential for characterizing drought in a given region. The data are available from 1958 to the present and can be accessed free of charge at https://www.climatologylab.org/terraclimate.html.
b) Google Earth Engine data
In order to document the spatiotemporal variation of the normalized vegetation index, we used the Google Earth Engine platform (https://code.earthengine.google.com/), which provides a large collection of historical and current satellite data from different sensors such as Landsat, MODIS and Sentinel. For this purpose, we used Java scripts to visualize NDVI maps of the Drâa watershed based on data extracted from Landsat 5 satellite sensors for the years 1984, 1989, 1994, and 1999, as well as from the MOD13Q1 satellite sensor for the years 2000-2023. The resulting maps are then stored, processed, and used to monitor drought trends over time.
Data from land based hydrological stations: Precipitation and volume variations of the El Mansour Eddahbi Dam
Gathering stations provide accurate and localized rainfall measurements that are essential for the calibration and verification of satellite data. These stations were established and are currently managed by the Drâa Oued Noun Water Basin Agency. Based on a network of 27 rain gauge stations distributed upstream and downstream in the Drâa basin, we were able to establish interpolations based on real data, allowing us to assess the validity and accuracy of the results obtained by remote sensing platforms.
Because we work with satellite data, it is essential to perform pre-processing on downloaded images to ensure data reliability and quality. For information presented in image form, we have applied the necessary atmospheric and radiometric corrections. These are aimed at adjusting pixel values to correct for variations in sensor sensitivity and aligning images to correct for geometric distortions. As for the data corresponding to point measurements of climatic parameters at specific stations, usually acquired in CSV (comma-separated values) format, we prepared the database by selecting the time intervals and calculating the monthly and annual sums and averages for each climatic parameter to be used in the calculation of the indices. These preliminary steps are crucial before proceeding with spline interpolation with barriers to obtain the final map. In general, the approach used in this study aims to monitor drought trends over a 50-year period, focusing on the current situation (Figure 2). This monitoring was done using satellite climate indices from NOAA, TerraClimate and Google Earth Engine. A large watershed like the Drâa, with inaccessible desert areas, poses enormous problems in terms of data availability. In this study, new space technology has proven very useful, with online information used to produce maps suitable for management and decision-making in these areas. The resulting cartographic maps were validated using real data collected along the Drâa River, based on a correlation between the products of the different data sources.
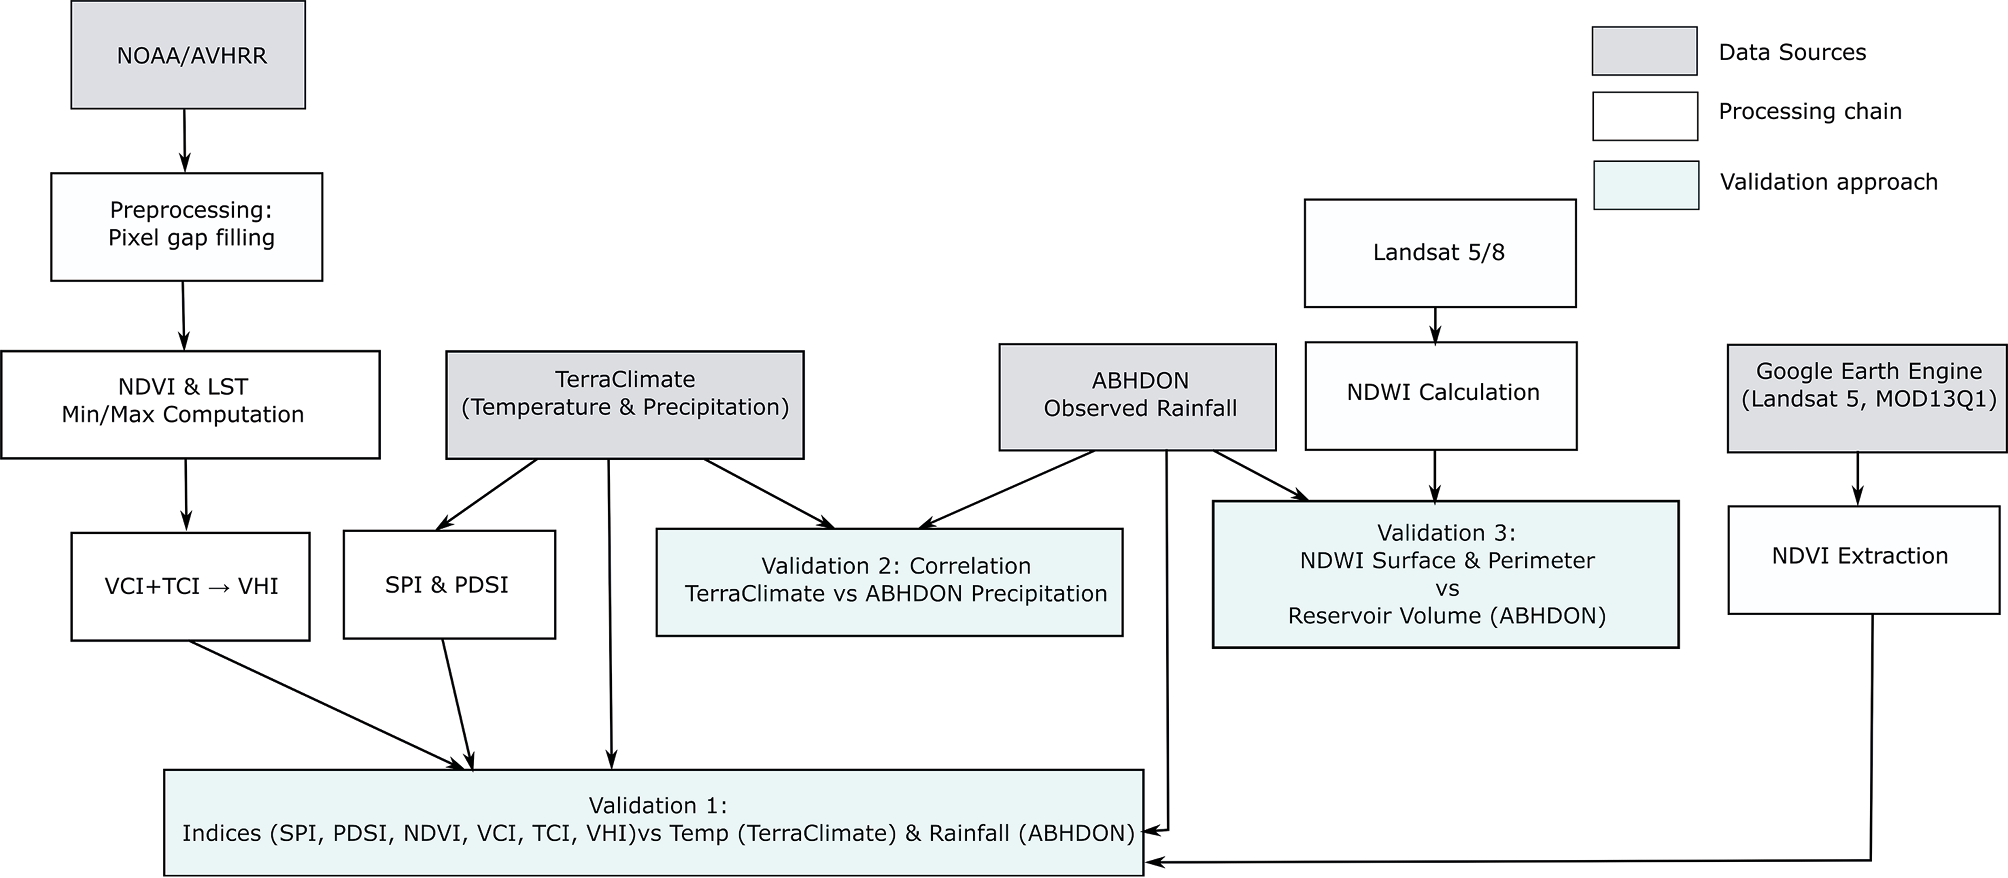
Severe weather conditions have a significant impact on the size of water reservoirs. In this regard, as a third validation, we used the large El Mansour Eddahbi reservoir in the Drâa watershed as a reference. Using the Normalized Difference Water Index (NDWI) and volume measurements carried out by the Drâa Oued Noun Water Basin Agency, we carried out a detailed study of the temporal variation of its surface area and perimeter in order to identify dry and wet years for this reservoir, which receives most of its annual rainfall from the Tidili-Iriri and Dadès-M’Goun tributaries.
Drought indices
a) Reflectance-Based Indices
NDVI (Normalized Difference Vegetation Index)
Proposed by (Rouse et al., 1973) as an index of vegetation health and density, NDVI is currently considered the most widely used indicator for monitoring terrestrial vegetation over large areas. This index is defined by the following formula:
NDVI=
where NIR and RED are reflectances in the near infrared and red bands, respectively. NDVI varies from -1 to +1, with positive values close to 1 indicating dense, healthy vegetation, and low negative values indicating a lack of vegetation or non-vegetated surfaces, which can be water or bare soil.
VCI (Vegetation Condition Index)
The VCI is a vegetative stress index expressed as a function of maximum, current and minimum NDVI values over a period of time (Liu & Kogan 2002). It differs from NDVI in its ability to analyse vegetation conditions for heterogeneous areas (Kogan, 1990), which is due to its ability to separate the short-term climatic signal from the long-term ecological signal (Kogan & Sullivan, 1993). VCI values generally vary between 0 and 100, with a zero value corresponding to extremely poor vegetation conditions and maximum values close to 100 indicating optimal vegetation conditions, and can be defined as:
VCI =
NDWI (Normalized Difference Water Index)
The NDWI introduced by (McFeeters, 1996) is a reflectance-based index commonly used to identify and monitor the presence of water on the Earth’s surface. The NDWI uses reflected radiation in the near infrared and visible green light to enhance the presence of water features while eliminating the presence of soil and terrestrial vegetation (McFeeters, 1996). The NDWI formula is generally defined as follows:
NDWI =
b) Brightness Temperature-Based Indices
TCI (Temperature Condition Index)
This thermal index is essentially based on the Earth’s surface temperature. It was developed at NOAA in 1995 (Kogan, 1997), and is calculated using images from NOAA’s AVHRR sensor. This index is very useful for characterizing thermal stress over long periods of time and over large areas (Kogan, 1997). Combined with other vegetation indices such as VCI, it provides a more comprehensive assessment of the vegetation condition of a given area. It is calculated as follows (Layelmam, 2015):
where LSTmax is the maximum surface temperature of the period studied, LSTmin is the minimum surface temperature of the period studied and LST (i) is the surface temperature of the month concerned.
c) Combined Reflectance and Brightness Temperature-Based Indices
VHI (Vegetation Health Index)
Because it combines a thermal factor and plant reflectance, the VHI is the most appropriate indicator for vegetation. This index was developed by (Kogan, 1995), and is very effective in terms of studying and managing agricultural drought by assessing vegetation health. It works by combining the Vegetation Condition Index (VCI) and the Temperature Condition Index (TCI), while relying on their negative correlation, to detect, monitor and provide early warning of the frequency and intensity of agricultural drought (Justice et al. 1998; Seiler et al. 1998). It is expressed by the following equation:
VHI = ɑ VCI + β TCI
where α and β are coefficients assigned to each of these combination factors and refer to the negative correlation between the thermal index and the plant index. These coefficients are equal to 0.5, according to (Wilhite et al., 2000).
d) Rainfall variation-based indices
SPI (Standardized Precipitation Index)
The SPI index (McKee et al., 1993, 1995) is a powerful yet easy to calculate tool that requires only precipitation data to quantify precipitation deficits or surpluses. It measures variations in precipitation relative to historical averages over a specified period, whether deficit or surplus, over periods ranging from 3 months to 2 years. Its optimal calculation requires monthly measurements over 20 to 30 years, ideally 50 to 60 years, although missing data can affect the reliability of the results (WMO, 2012). The SPI index can be expressed as:
SPI =
where P is the total precipitation for a given period (mm), Pm is the historical mean precipitation for the period (mm), and σP is the historical standard deviation of precipitation for the period (mm).
PDSI (Palmer Drought Severity Index)
The PDSI is a meteorological drought index developed by Palmer (Briffa et al., 1994; Scian & Donnari, 1997; Cook et al., 1999). Its ultimate goal is to provide standardized measurements of moisture conditions so that comparisons can be made using this index between different locations and between different months. To achieve this, the PDSI relies on data on precipitation, current and past temperatures, and available soil moisture (Mika et al., 2004), However, it does not directly consider surface hydrological resources (groundwater, rivers, reservoirs), that can influence drought conditions (Layelmam, 2015). The PDSI index is calculated using:
where X (i-1) is the PDSI of the previous period, and Z(i) is the moisture anomaly index which is calculated by the following formula:
Z(i) = K(P-Pc)
where K is a weighting factor (see Alley 1984), P is the current precipitation (mm), and Pc is the CAFEC precipitation (mm; Climatically Appropriate for Existing Conditions), representing the amount of rainfall needed to maintain a balanced water supply (i.e., neither drought nor excessive humidity) under normal climatic conditions. It is expressed as: CAFEC = Potential Evapotranspiration (PE) + Recharge + Runoff − Soil Moisture Loss/Gain.
Results
Reflectance-Based Indices
VCI
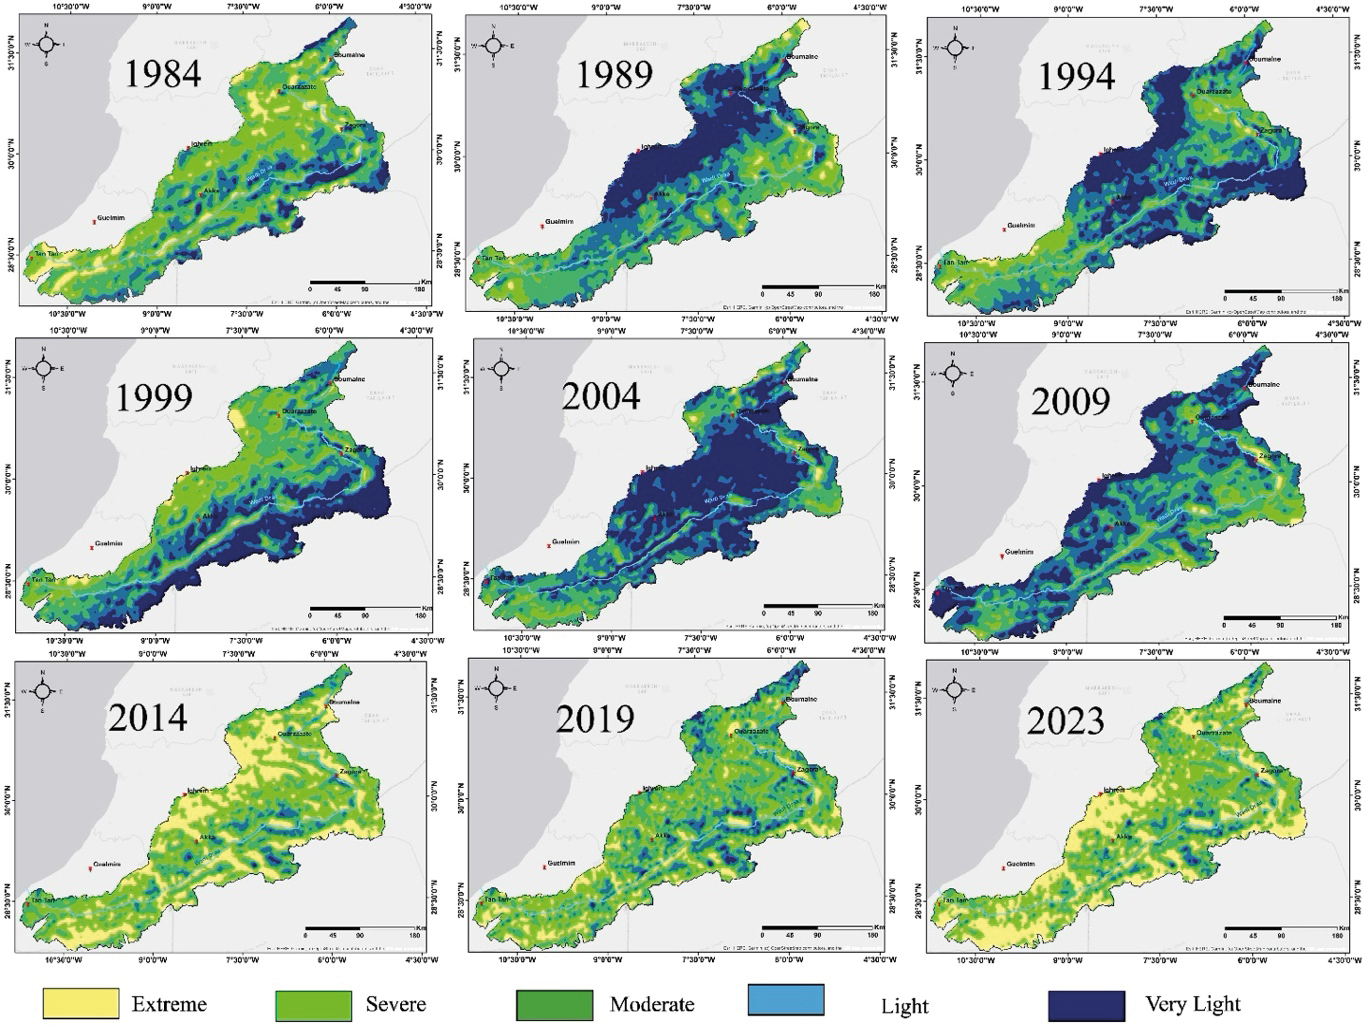
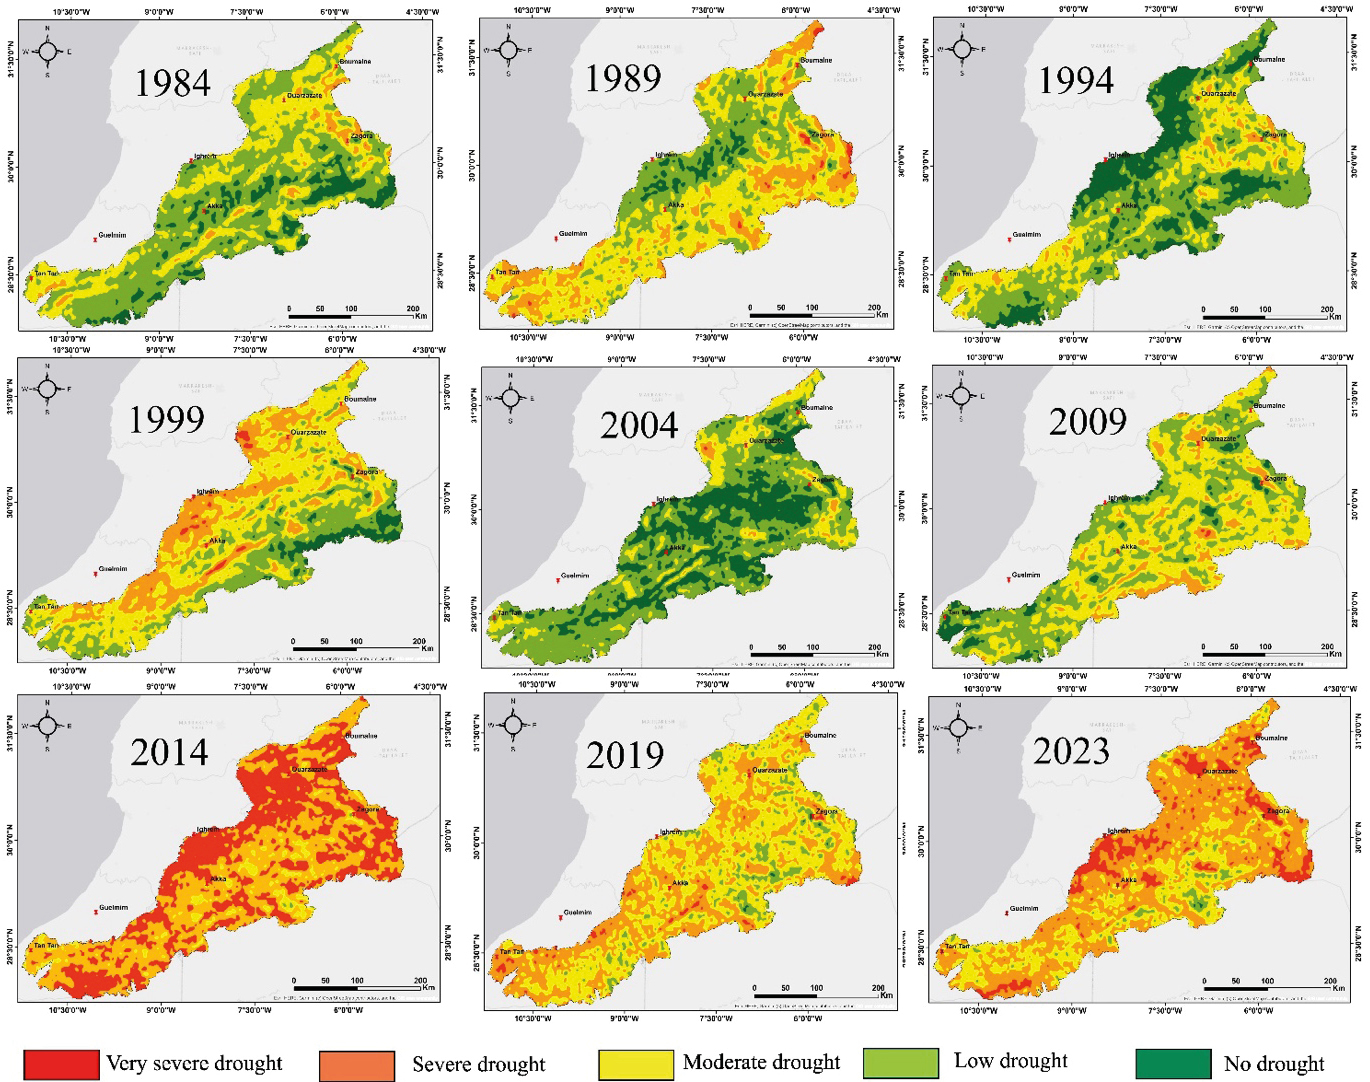
The map of spatiotemporal variation of the Vegetation Condition Index (VCI) (Figure 3) shows an increasing trend towards drought between 1984 and 2023. During the period from 1989 to 2009, conditions appear relatively normal, with slight fluctuations observed between 1989 and 2009, and spatially between the High Atlas and Anti-Atlas regions. These fluctuations can be attributed to topographic variations, which have a direct influence on the amount of precipitation and the diurnal temperature variations. In fact, the varied topography of the mountainous areas of the High Atlas and Anti-Atlas results in distinct microclimates. Higher altitudes generally receive more precipitation, while lower areas can be more arid. Since 2009, a significant increase in drought has been observed, leading to a progressive deterioration of vegetation conditions and an increase in periods of water stress. This deterioration could be linked to climate change, which is strongly affecting precipitation patterns and temperatures.
NDVI
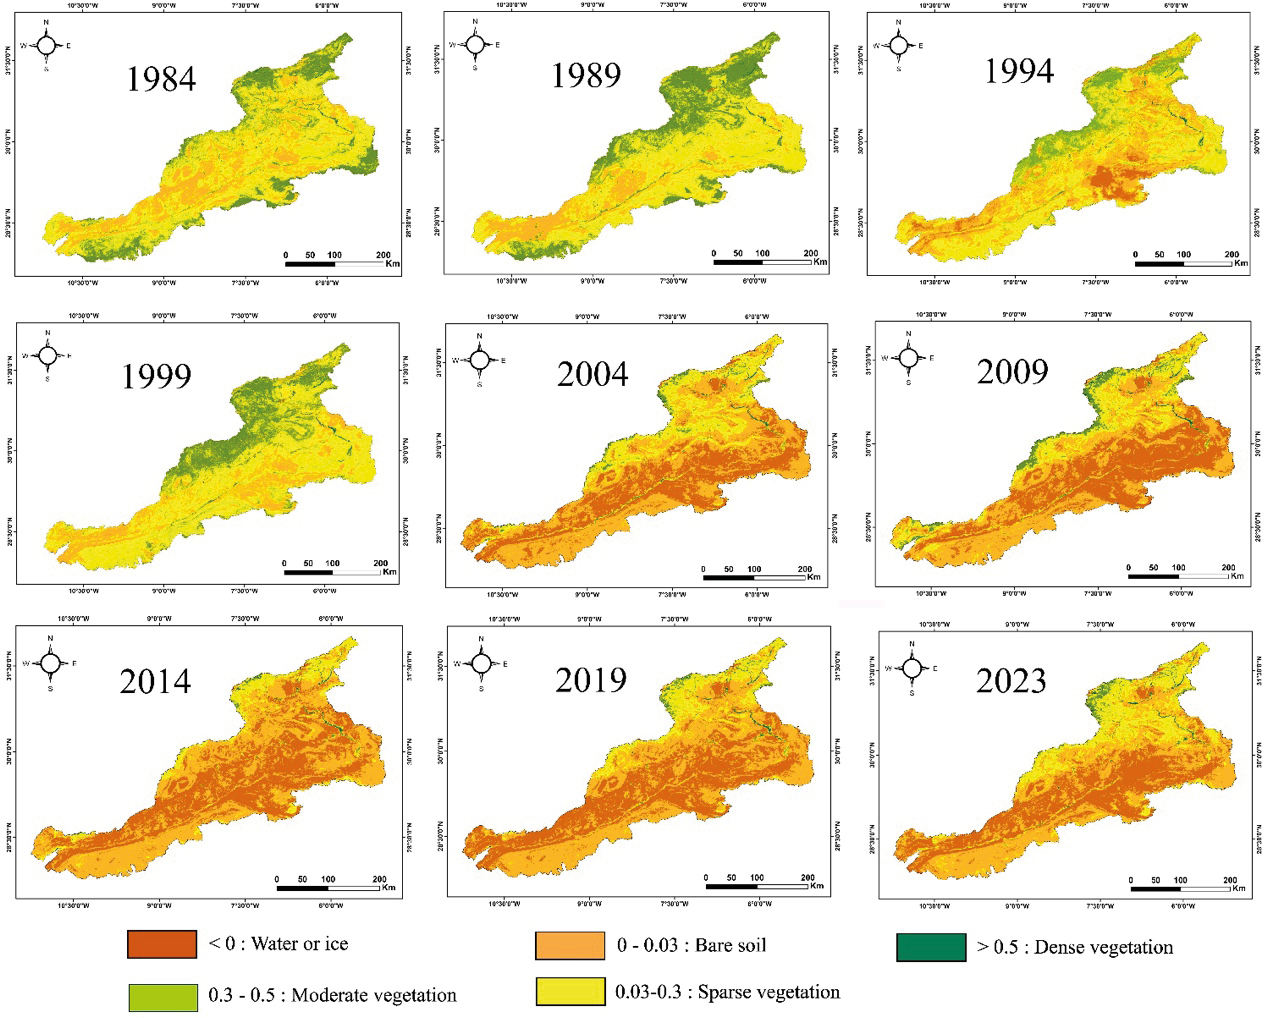
Analysis of the normalized vegetation index (NDVI) in Figure 4 clearly indicates a significant shift in the climatic conditions of the Drâa watershed since the 2000s. Even land in the Atlas regions shows progressively lower NDVI values, specially from 2004 to 2023. Bare soil and Saharan zones occupy about three quarters of the watershed surface area, which is explained by regional climatic conditions. These changes indicate a gradual degradation of vegetation cover, highlighting water stress and a decline in biological productivity. Analysis of the NDVI data during this period shows the severe impact of the climatic conditions on the ecosystem of the Drâa watershed. Green zones with high NDVI values continue to show resilience, especially in the foothills of the high mountains, largely benefiting from the effect of snowmelt. These areas of dense vegetation also extend along the Drâa River, from the High Dadès in the east and Tidili-Iriri in the west, to Mhamid El Ghizlane in the south (Figure 1).
Brightness Temperature-Based Indices
TCI
As shown in Figure 5, the temporal variation of the temperature condition index (TCI) shows some cyclicity. Any year with extremely high temperatures could indicate a period of drought, followed four years later by a year with lower temperatures, indicating wet conditions.
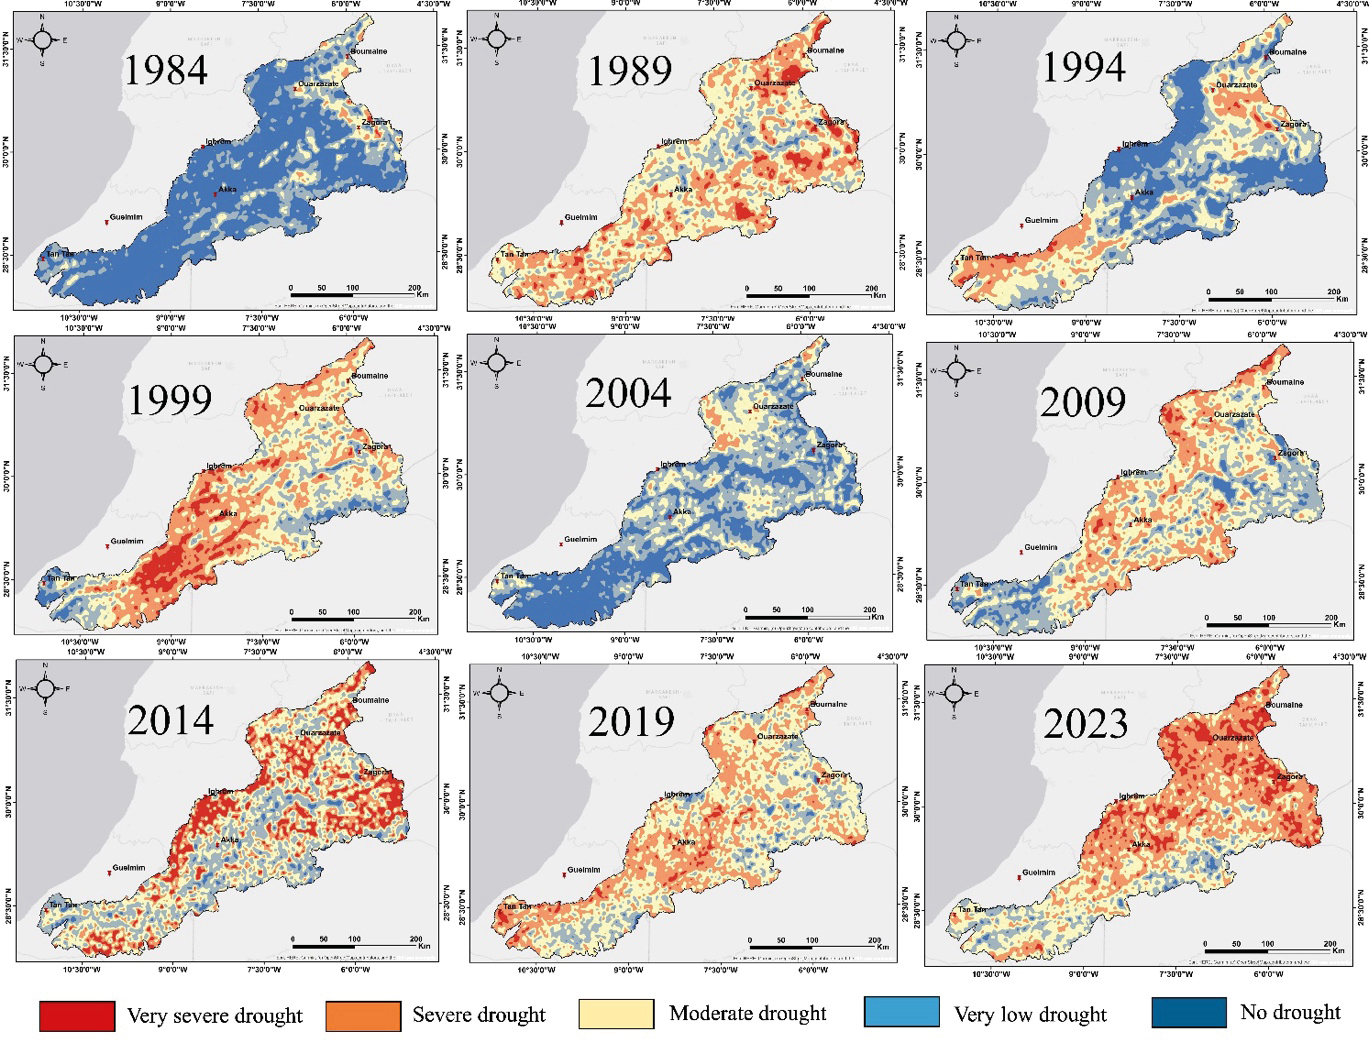
This index examines the effect of temperature on vegetation, showing that even the lowest temperatures can have a negative effect on plant cover. Therefore, it is important to use this index alongside the Vegetation Condition Index (VCI) rather than in isolation. The combination of these two indices results in the Vegetation Health Index (VHI). Basically, years with favorable vegetation conditions are confirmed by the VHI, enhancing the reliability of the conclusions drawn from their analysis.
Combined Reflectance and Brightness Temperature-Based Indices
VHI
With regards to the Vegetation Health Index (VHI), the observed trends are consistent with those of the NDVI, VCI and TCI. Initially, conditions appear favorable throughout the watershed, with varying intensity due to the different microclimates of each region, influenced by their specific topographic context. However, from 2004 onwards, the calculations show a significant upheaval, with the class indicating unfavorable vegetation conditions invading almost the entire watershed. This trend indicates an alarming drought, which can be corroborated by the other indices based on the local meteorological conditions, hence the importance of a multidimensional analysis of the indices for a complete and accurate understanding of the drought in the study area.
Rainfall variation-based indices
SPI
Analysis of the graph showing variations in the Standardized Precipitation Index (SPI) for the Drâa watershed from 1950 to 2023 reveals several important trends (Figure 7). During this period, the SPI shows marked variability, with prolonged episodes of severe drought, particularly notable in the years 1961, 1962, 1976, 1982-1985, 1999-2002 and 2016-2023 (with the exception of the year 2018-2019), when SPI values fall below -1.5, indicating exceptionally dry conditions. In contrast, significant peaks of excess precipitation occur between 1952-1957, 1963-1969, 1988-1994, 1996-1998, 2003-2007, and 2014-2015, with SPI values reaching +1.5, indicating periods of abundant precipitation.
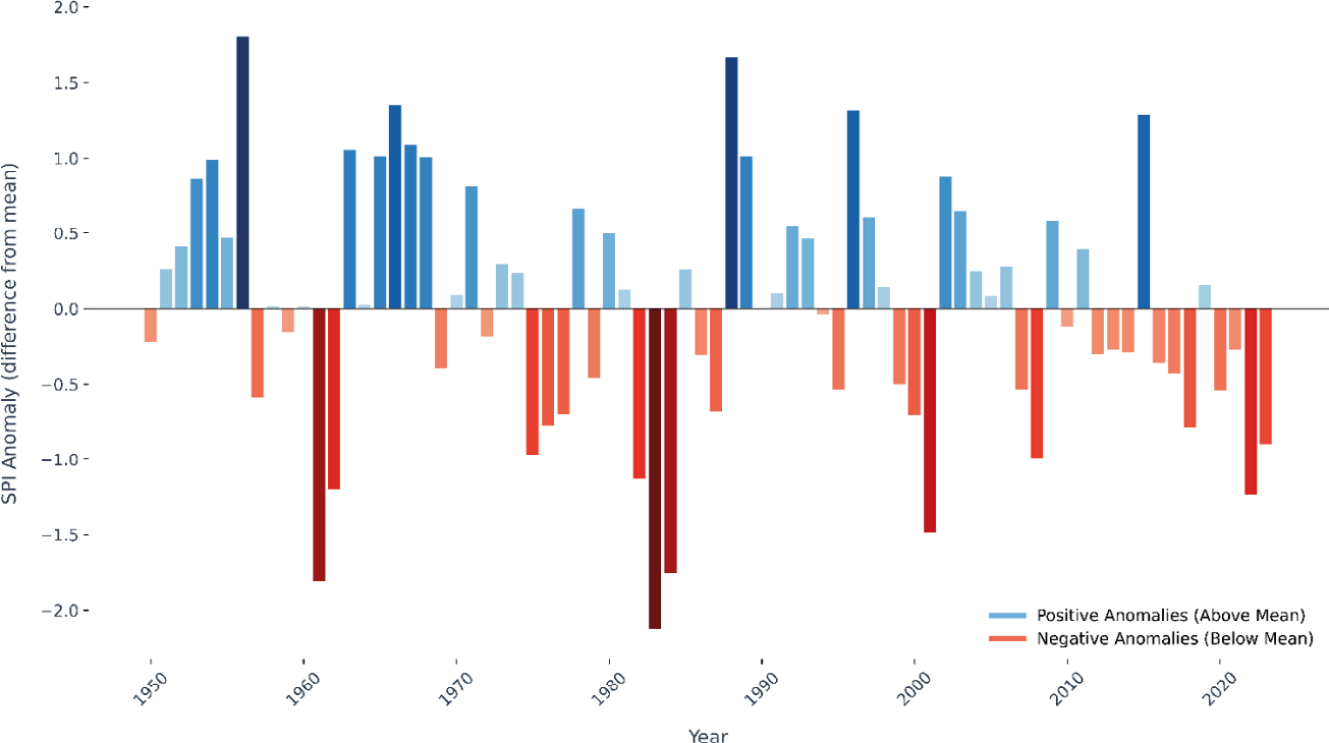
The overall trend in the SPI appears to oscillate between periods of intense drought and excess precipitation, with a notable variation in the frequency of events between the 1990s and 2000s. Prior to 2002, droughts had a significant amplitude but a limited duration of 3 or 4 years at most, while wet periods were more prolonged, with somewhat lower amplitudes. Since 2002, wet periods have become rarer, with an average amplitude and generally lasting only one or two consecutive years. On the other hand, a precipitation deficit extends over about 17 years, from 2007 to 2023, with a few one-year breaks, as in 2014-2015 and 2018-2019. In terms of SPI, over a period of 23 years (2000-2023) the watershed has experienced only 9 relatively wet years compared with to 14 dry years. These rainfall deficits, spread over a long period, and in parallel with the rise in temperatures, confirms the results of the other indices reflecting vegetation health.
PDSI
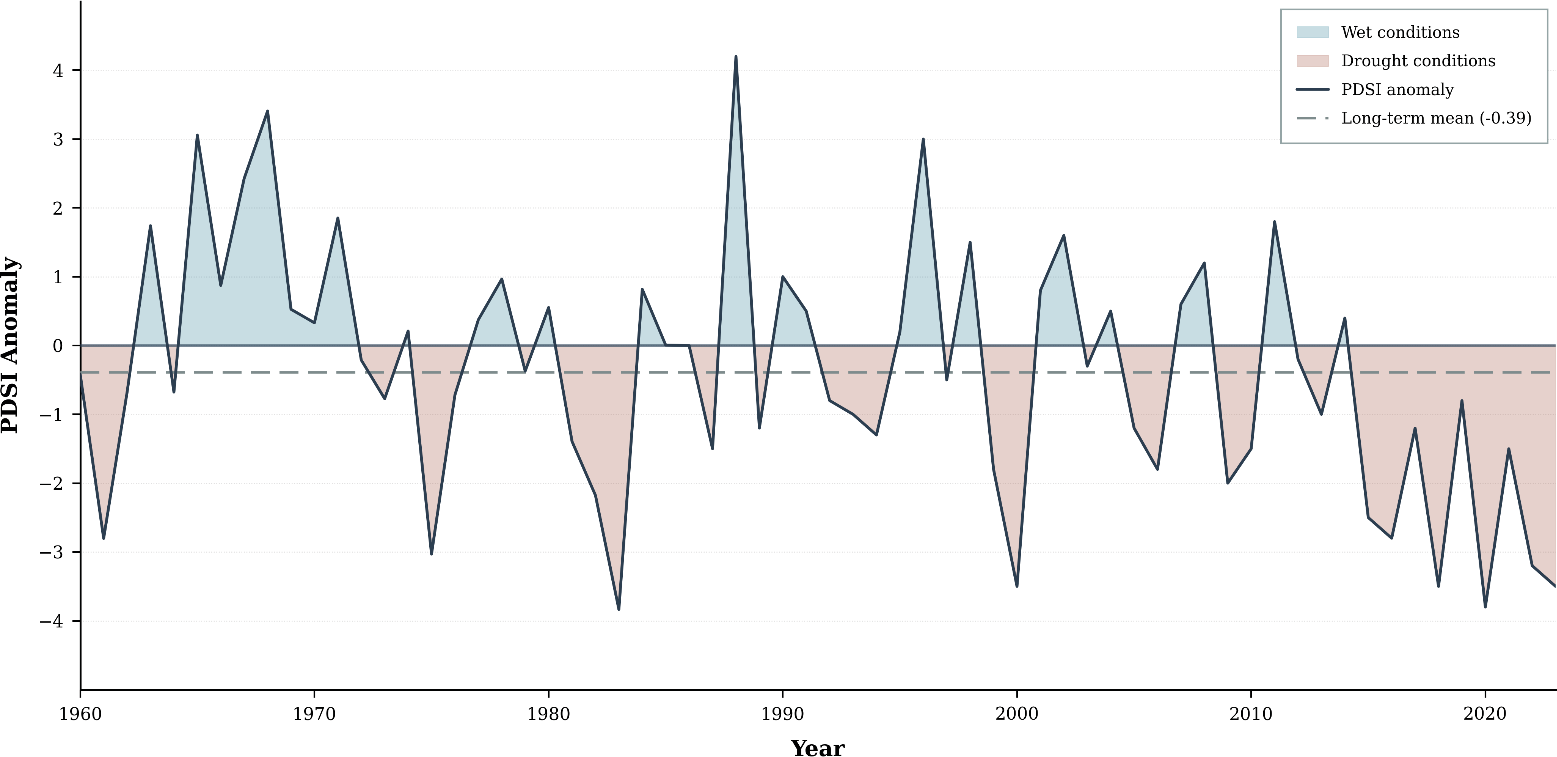
Variations in the Palmer Drought Severity Index (PDSI) corroborate the fluctuations observed through the SPI indices (Figure 8). This is to be expected, as the Palmer index is based on similar parameters to those used to assess rainfall deficits and surpluses. The periods most severely affected by drought, identified by the lowest PDSI values, include the intervals 1982-1984, 1999-2000, and the long dry period from 2015 to the present day. Conversely, wet periods are less frequent, with significant peaks recorded in the years 1987-1989, 2002, and 2014. These observations confirm the harmonization of drought and precipitation indices in the assessment of climatic conditions in the watershed, underlining their complementarity in the analysis of climatic trends.
Validation of findings
Observed climatic and hydrological parameters
As a performance test, we implemented a rigorous validation, comparing the results with variations in climatic parameters. Specifically, we compared precipitation data from 27 hydrological stations along the Drâa River with temperatures provided by the TerraClimate satellite and with the results of drought indices derived from remote sensing.
To assess the performance of the TerraClimate satellite itself, we compared spline-with-barriers interpolation based on precipitation data provided by the Drâa-Oued Noun Hydraulic Basin Agency with those derived from satellite observations. This comparison allowed us to calculate a correlation index, which serves as a basis for assessing the accuracy of the data provided by TerraClimate. A high correlation index, on the order of 79% (Figure 9), confirms the reliability of the satellite data. This not only ensures the accuracy of the climate data used in our analyses, but also increases confidence in the
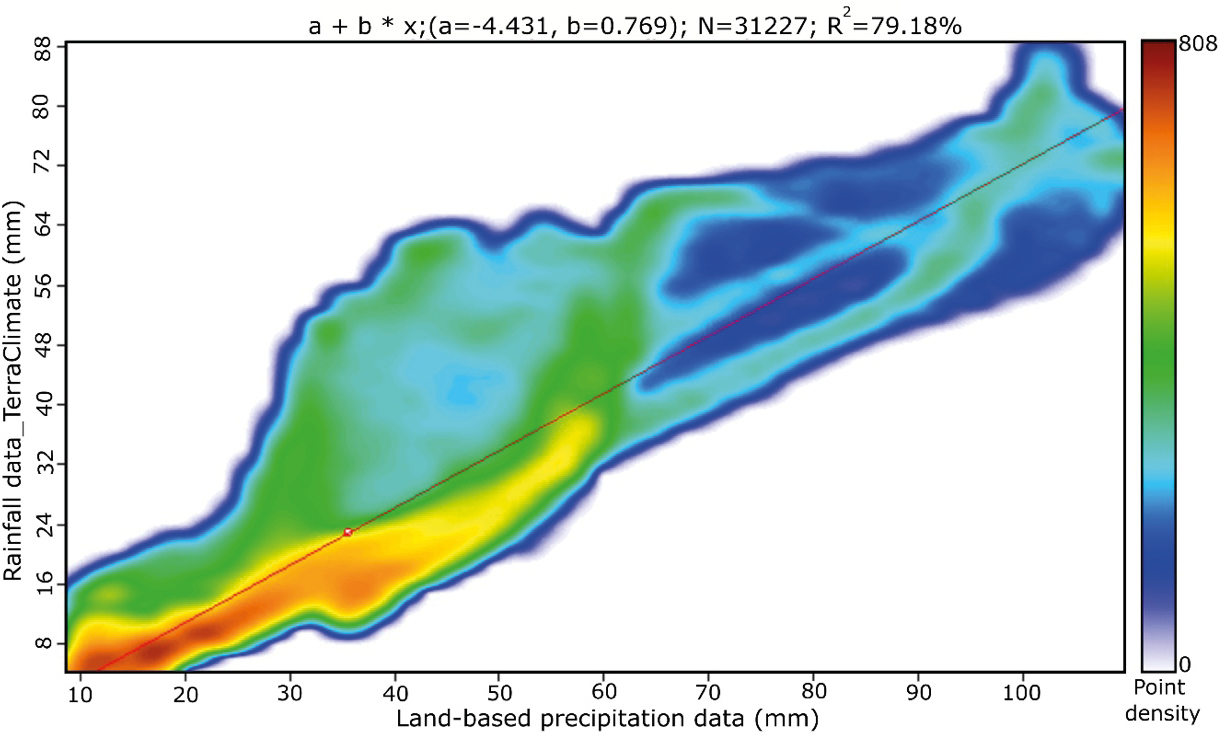
results obtained and their relevance to the assessment drought conditions and climate trends in the Drâa catchment.
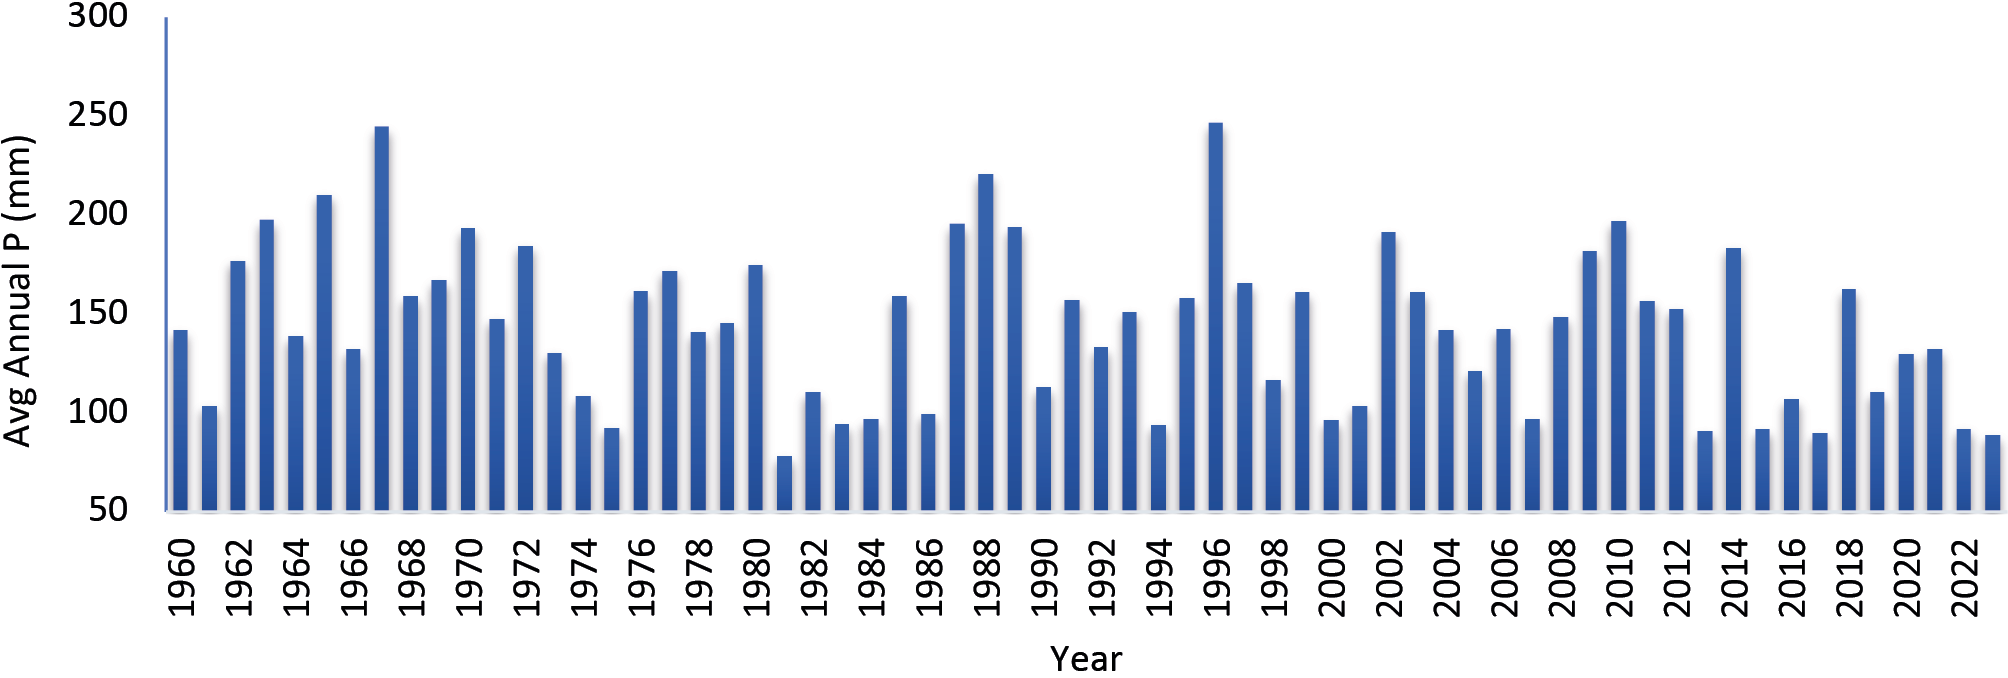
Figure 10 illustrates the variations in mean annual precipitation in the Drâa watershed, as determined by “spline with barriers” interpolation using ArcGIS software, between 1960 and 2023. In general, the pattern of oscillations reveals a downward trend in annual precipitation in the watershed over time. There were significant precipitation peaks, with values reaching 244.5 mm in 1967, and 246.5 mm in 1996. In contrast, troughs reflect periods of low precipitation, with minimum values dropping to 85.9 mm in 2023. It is important to note that it has now been 27 years (1996-2023) since the Drâa watershed recorded an average annual rainfall of more than 200 mm. This observation underscores a prolonged downward trend in precipitation levels in the region, reflecting a significant change from previous periods when higher values were common.
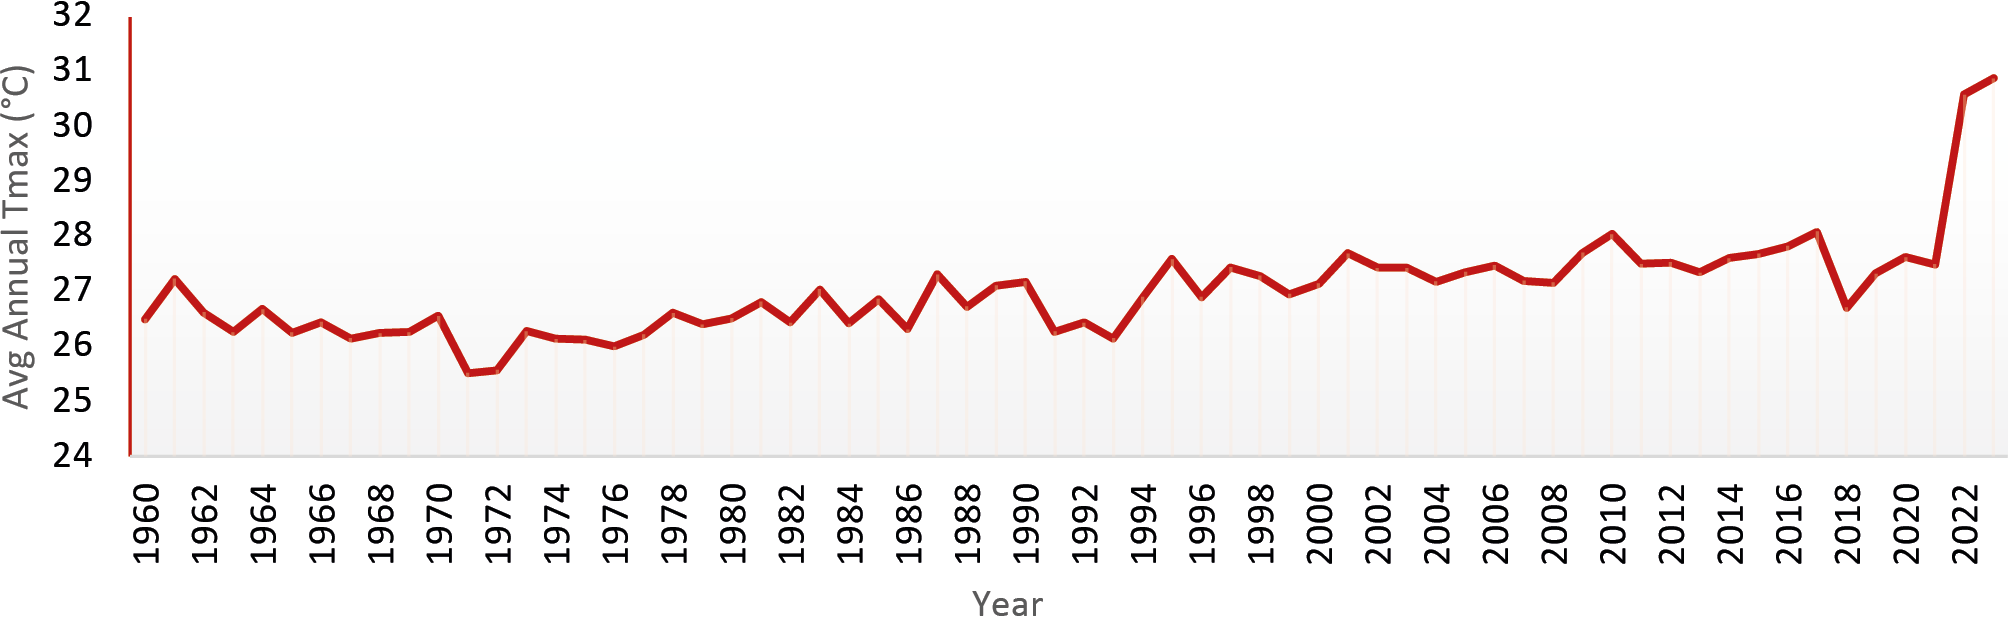
With regard to maximum temperatures (Figure 11), an interpolation based on satellite data provided by TerraClimate shows variations in maximum temperatures in the Drâa watershed from 1960 to 2023. The graph derived from this analysis shows a general trend of increasing temperatures over the past several decades. Maximum temperatures have ranged from a low of 25.5°C in 1971 to a high of 30.6°C in 2023. In other words, the region has experienced an average increase of 5°C over the past 52 years. More specifically, in the last two decades, i.e. between 2000 and 2023, the maximum temperature has risen by 3°C, from 27.6°C in 2000 to the peak recorded in 2023. This increasing trend in maximum temperature raises significant concerns about the future impacts of global warming on the watershed. It is crucial to consider how these changes could affect local ecosystems, water resources and living conditions in the region as temperatures continue to rise.
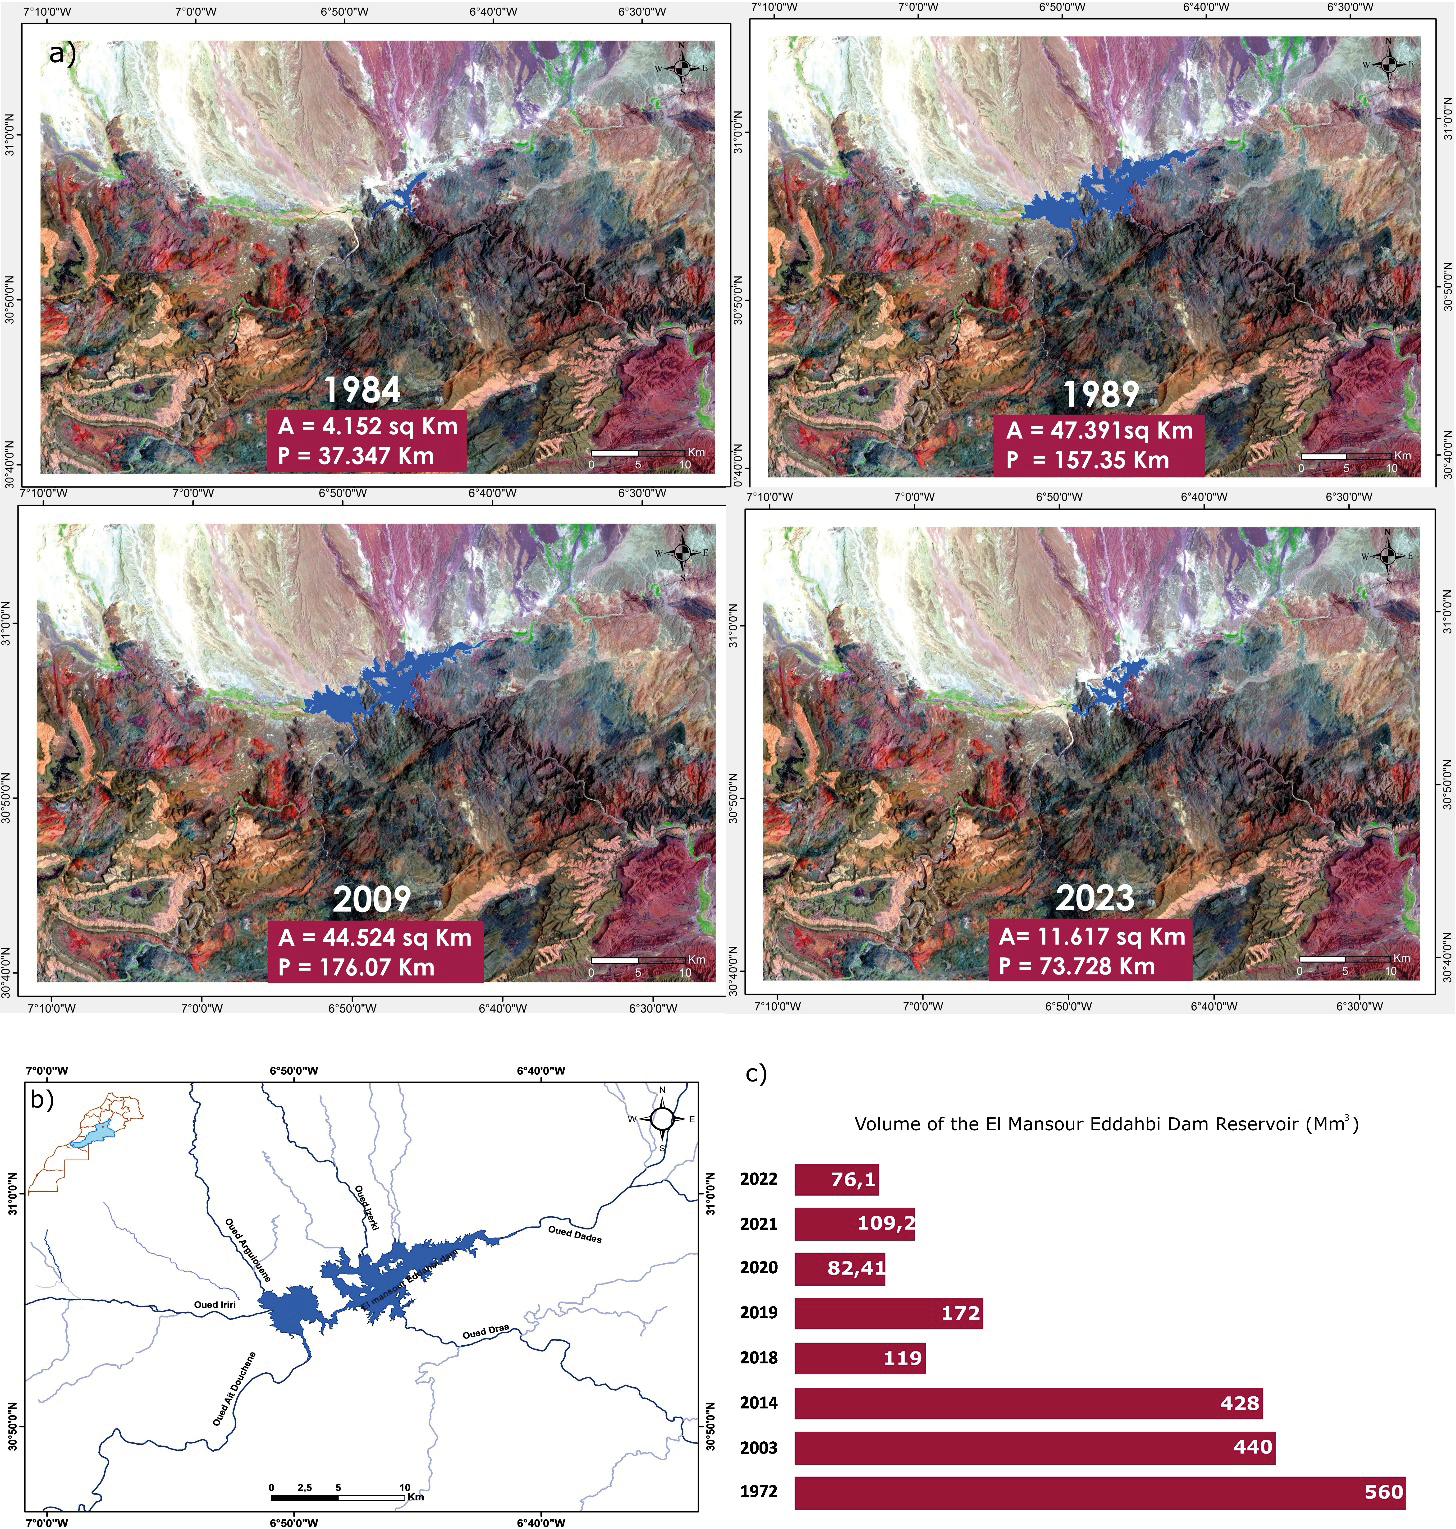
In a third validation step, we applied the Normalized Difference Water Index (NDWI) to the El Mansour Eddahbi reservoir to monitor its spatio-temporal evolution in response to climatic variations (Figure 12). Analysis of the data covering forty years, from 1984 to 2023, reveals the significant influence of rainfall deficits on the reservoir extent. In 1984, following two consecutive years of drought, a sharp reduction in the reservoir’s water surface area was observed (4,152 km²). By contrast, in 1989, the wettest year of the period according to annual precipitation records, drought indices and vegetation vitality indices saw a substantial increase in reservoir surface area and perimeter (47.39 km² and 157.35 km, respectively). Although wet years became less frequent after 2000, some, such as 2009, still resulted in significant increases in reservoir surface area and perimeter (44.52 km² and 176.07 km, respectively). From that date onwards, the gradual decline in precipitation, combined with rising temperatures and increased evaporation rates, has severely affected water levels. By 2023, the reservoir had shrunk considerably (11 km² in area and 73 km in perimeter), clearly illustrating the devastating effects of drought on the regional water resources. Surface and perimeter variations derived from the NDWI were validated by reservoir volume measurements provided by the Drâa Oued Noun Water Agency, covering the period from dam construction in 1972 to 2023, with a particular focus on key years (Figure 12).
Discussions
Vegetation indices include NDVI and NOAA indices include VCI, TCI and VHI. Although they are based on different measurement principles - NDVI is based on the reflectance of vegetation surfaces, while NOAA indices are based on brightness temperature - these indices ultimately show variations in time and space, with a trend towards a decrease in vegetation cover in recent decades. It is important not to interpret the results of these indices in isolation, as they provide only a partial overview of vegetation health. Vegetation health can be adversely affected not only by periods of drought, but also by flooding. In addition, heavy rainfall combined with extremely low temperatures can also adversely affect vegetation health. It is therefore important to complement the analysis of these indices with other information to obtain a complete picture. It should also be emphasized that the indices analyzed refer to vegetation health for only the month of April over the nine years of comparison (1984, 1989, 1994, 1999, 2000, 2004, 2009, 2014, 2019, 2023). April is chosen as the reference month because at this time vegetation growth is most sensitive to environmental conditions. This explains, for example, why the drought indices show a severity in 2014, even though there was significant precipitation in that year (Figures 10). Indeed, this precipitation only occurred in September, November and December, and not during critical vegetation months such as April. Focusing on the variation in VHI index, an index that assesses vegetation health by integrating vegetation conditions, we can observe that the health of the vegetation cover varies according to topography, proximity to the High Atlas, and fluctuations in meteorological parameters. One year is not enough to restore vegetation after three or four consecutive years of drought, even if rainfall increases. In fact, vegetation health has deteriorated from 2009 to 2023, despite some slightly wetter periods between 2014-2015 and 2018-2020. The same trends apply to the NDVI index, except that this index clearly illustrates the progression of desertification over most of the watershed. The ubiquitous green belt (Figure 6) represents the south-facing slope of the High Atlas, with their elevations and relatively favorable climate for crop development.
The results obtained from the SPI and PDSI indices show a strong correlation with variations in precipitation and maximum temperatures. In fact, these indices confirm the trends revealed by the raw climate data (Figures 10 and 11). To illustrate this correlation, it is relevant to look at the years considered the wettest on the basis of high annual precipitation (244.5 mm in 1967, 222.6 mm in 1988 and 246.5 mm in 1996). In fact, the SPI indices for these years are 1.50 in 1967, 2.15 in 1988 and 1.80 in 1996. These high values indicate a period of exceptionally above-average rainfall, confirming the trend towards wetter conditions during these years.
The PDSI is also part of this correlation with variations in raw climatic parameters. To illustrate this correlation, we have analyzed in detail the years most prone to drought, as well as the wettest periods according to the available data. The year 2023, for example, characterized by particularly dry conditions, shows an extremely low PDSI index of -3.50, accompanied by a high average maximum temperature of 30.6°C. This result confirms a severe and persistent drought situation. On the other hand, the year 1971, which records the lowest mean maximum temperature (25.5°C) of the period (1960-2023) and an annual rainfall of 147.8 mm, is associated with a PDSI index of 3.40. This value indicates relatively wet and humid conditions and suggests a low vulnerability to drought this year. The 83% positive correlation between the SPI and PDSI indices (Figure 13), illustrated by the scatterplot and fitted regression line, confirms their strong relationship, indicating that water deficits detected by the SPI are well reflected by the PDSI. PDSI increases when SPI increases, as precipitation is the main variable influencing both indices.
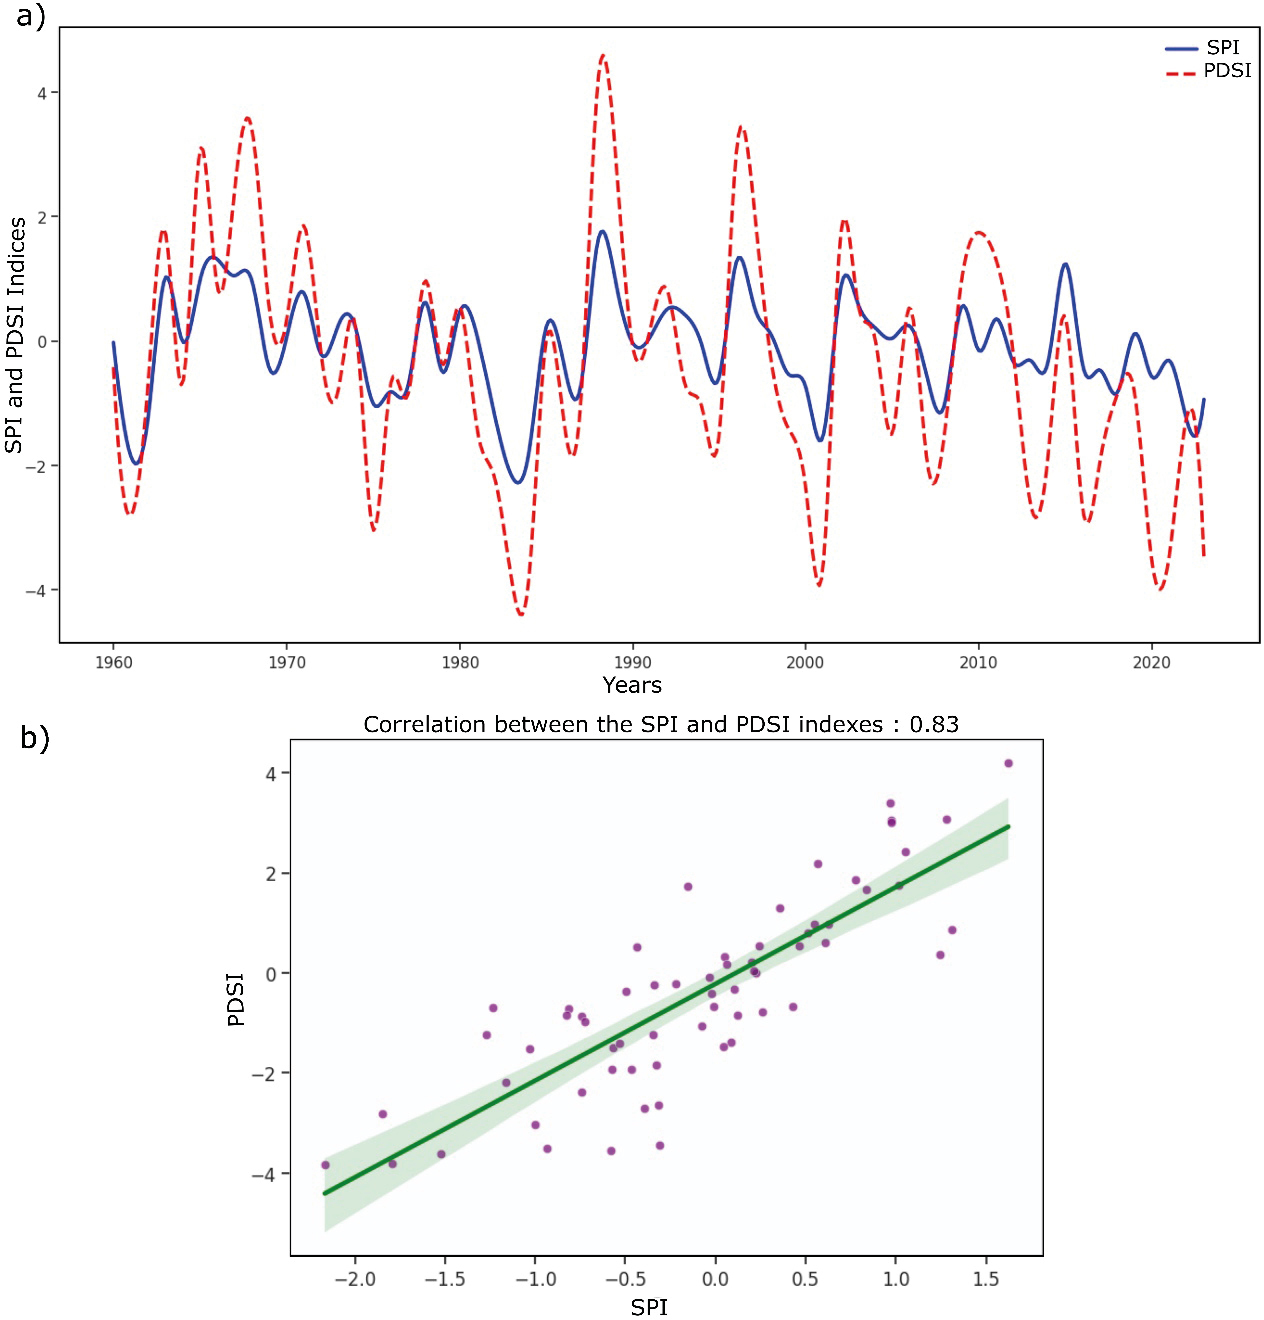
The SPI measures precipitation anomalies directly, so when it is positive, it means that there is an excess of rainfall compared to normal. Since the PDSI also incorporates this precipitation into its calculation, an increase in the SPI generally indicates a recharge of soil moisture, thus reducing water stress and leading to a rise in the PDSI. However, the PDSI responds more slowly to variations in SPI, as it takes into account evapotranspiration and the soil’s capacity to retain water, which can dampen or delay its variations compared to the SPI.
The response of surface water bodies to weather conditions is often direct and rapid, particularly in semi-arid environments where water availability is heavily influenced by rainfall variability and evaporation processes. In this context, large reservoirs are highly sensitive indicators of hydroclimatic stress. The El Mansour Eddahbi reservoir, which regulates surface water resources in the Upper Drâa sub-basin, is an essential indicator for assessing the hydrological impacts of drought at the basin scale. The results highlight a close link between climate variability and surface water dynamics, as evidenced by the strong correlation between surface variations derived from NDWI and measured reservoir volumes. Periods characterized by pronounced rainfall deficits lead to a rapid contraction in reservoir extent, reflecting reduced inflows and increased evaporation due to rising temperatures. Conversely, episodic wet years lead to short-lived recoveries in reservoir surface area, illustrating the system’s dependence on interannual precipitation variability rather than long-term storage resilience. Overall, the consistency between the NDWI maps and the observed variations in reservoir volume confirms the relevance of remote sensing-based hydrological indices for monitoring surface water dynamics in regions where data are scarce.
Beyond validation objectives, these results highlight the vulnerability of surface water resources in the Drâa basin to prolonged drought conditions and reinforce the importance of further studies in this region for effective water resource management.
Conclusion
As part of this study, the results derived from satellite imagery were validated using ground-based data. Today, data availability is no longer a major barrier to studying drought risk over time and space. Thanks to sources such as NOAA and TerraClimate, along with band analysis from satellite images like Landsat, Modis, and others, it is now possible to access essential global parameters. These datasets allow for the calculation of various drought indices, enable correlation with observed conditions, and support the development of representative maps illustrating the evolution of climatic situations. The Drâa watershed, like much of Morocco, has long experienced alternating dry and wet periods. However, in recent decades, the frequency of drought years has significantly increased, marked by greater severity and broader spatial extent. The few relatively wet years are no longer sufficient to restore water resources or regenerate vegetation cover. Located in the southern part of Morocco, the Drâa Basin’s climatic context makes it particularly vulnerable to meteorological, hydrological, and hydrogeological droughts. Since the droughts of the 1980s, the region has shown a cyclic pattern of alternating dry and wet seasons, with a recurrence interval of approximately two to three years. Yet, since the 2000s, both the frequency and impact of drought years have intensified, particularly in terms of vegetation loss and declining water availability in the reservoir of the El Mansour Eddahbi dam. This situation is reflected in the variation of several indicators including the Vegetation Condition Index (VCI), Temperature Condition Index (TCI), Vegetation Health Index (VHI), and the Normalized Difference Vegetation Index (NDVI), along with climate-based indices including the Standardized Precipitation Index (SPI), the Palmer Drought Severity Index (PDSI), and the Normalized Difference Water Index (NDWI) applied to the dam reservoir. The interpretation of resulting maps and graphs required an integrated approach, combining advanced remote sensing data with ground observations from hydrological stations across the Drâa watershed, to ensure a coherent and comprehensive analysis. Ultimately, the findings have confirmed that the observed variations closely follow the fluctuations of key climatic parameters—namely, annual average precipitation and average maximum temperatures.
Acknowledgments
We gratefully acknowledge the invaluable support of all individuals and institutions that contributed to the completion of this study. Particular appreciation is extended to the Centre National pour la Recherche Scientifique et Technique (CNRST), Rabat, Morocco, for its financial support through the “PhD-Associate Scholarship” program. We also wish to thank the Agence du Bassin Hydraulique Drâa-Oued Noun, with special recognition to its Director, Mr. Essanhajy, and hydrogeological engineer, Mr. Aoujil, for their technical assistance and collaboration. We are especially grateful to the Ministère des Relations internationales et de la Francophonie and the Natural Sciences and Engineering Research Council of Canada for their support to the third and fourth authors, respectively.
References
Abatzoglou JT, 2013. Development of gridded surface meteorological data for ecological applications and modelling. International Journal of Climatology, 33(1): 121–131. https://doi.org/10.1002/joc.3413
Agence du Bassin Hydraulique de Drâa Oued Noun (ABHDON), 2009. Eaux de surface. Avenue Mohamed VI, BP 1351, Guelmim, Maroc.
Agence du Bassin Hydraulique de Drâa Oued Noun (ABHDON), 2013. Eaux de surface. Avenue Mohamed VI, BP 1351, Guelmim, Maroc.
AghaKouchak A, Cheng L, Mazdiyasni O, Farahmand A, 2014. Global warming and changes in risk of concurrent climate extremes: Insights from the 2014 California drought. Geophysical Research Letters, 41(23): 8847–8852. https://doi.org/10.1002/2014GL062308
Agoussine M, Bouchaou L, 2004. Les problèmes majeurs de la gestion de l’eau au Maroc. Sécheresse, 15(2): 187–194.
Agoussine M, 2003. Les divers aspects de l’hydrologie en régions arides et semi-arides – cas du sud-est marocain. Terre & Vie, Rabat, 70.
Agoussine M, Saidi MEM, Igmoullan B, 2004. Reconnaissance des ressources en eau du bassin d’Ouarzazate (Sud-Est marocain). Bulletin de l’Institut Scientifique, Rabat, section Sciences de la Terre, 26: 81–92.
Aït Hamza M, El Faskaoui B, Fermin A, 2010. Les oasis du Drâa au Maroc. Hommes & Migrations, 1284: 56–69.
Ait Dhmane L, Saidi ME, Moustadraf J, Rafik A, Hadri A, 2024. Spatiotemporal characterization and hydrological impact of drought patterns in northwestern Morocco. Frontiers in Water, 6: 1463748. https://doi.org/10.3389/frwa.2024.1463748
Aksu H, Cetin M, Aksoy H, Yaldiz SG, Yildirim I, Keklik G, 2022. Spatial and temporal characterization of standard duration-maximum precipitation over Black Sea Region in Turkey. Natural Hazards, 111(3): 2379–2405. https://doi.org/10.1007/s11069-021-05141-6
Alley WM, 1984. The Palmer Drought Severity Index: Limitations and assumptions. Journal of Applied Meteorology and Climatology, 23(7): 1100–1109. https://doi.org/10.1175/1520-0450(1984)023<1100:TPDSIL>2.0.CO;2
Auclair L, 1987. Maroc présaharien: bois de feu et désertification. Forêt Méditerranéenne, 9(1): 41–48.
Bentaleb A, 2011. Pompage d’eau et désertification dans la Moyenne Vallée du Draâ: le cas du palmier Mezguita (Maroc). Insaniyat, 51–52. https://doi.org/10.4000/insaniyat.1257
Bentaleb A, 2015. Vulnérabilité oasienne: valorisation et développement territorial dans les zones arides marocaines. Cas: Oasis du Drâa moyen. Dans: XIVᵉ Conférence Internationale Annuelle de l’Intelligence Territoriale “Développement durable des territoires vulnérables”, octobre 2015, Ouarzazate, Maroc. https://halshs.archives-ouvertes.fr/halshs-01741493
Baki S, Hilali M, Kacimi I, Mahboub A, 2017. Caractérisation hydrogéologique et cartographie des ressources en eau dans le bassin versant de l’oued Rhéris (Sud-Est du Maroc). Bulletin de l’Institut Scientifique, Rabat, Section Sciences de la Terre, 38: 29–43.
Bashit N, Ristianti N, Ulfiana D, 2022. Drought assessment using remote sensing and geographic information systems (GIS) techniques (Case study: Klaten District). International Journal of Geoinformatics, 18(5): 115–127. https://doi.org/10.52939/ijg.v18i5.2393
Bijaber N, El Hadani D, Saidi M, Svoboda MD, Wardlow BD, Hain CR, Poulsen CC, Yessef M, Rochdi A, 2018. Developing a remotely sensed drought monitoring indicator for Morocco. Geosciences, 8(2): 55. https://doi.org/10.3390/geosciences8020055
Bijaber N, Rochdi A, Yessef M, El Yacoubi H, 2024. Mapping the structural vulnerability to drought in Morocco. International Journal of Engineering and Geosciences, 9(2): 264–280.
Briffa KR, Jones PD, Hulme M, 1994. Summer moisture variability across Europe, 1892–1991: An analysis based on the Palmer Drought Severity Index. International Journal of Climatology, 14(5): 475–506. https://doi.org/10.1002/joc.3370140502
Cherkaoui Dekkaki H, 2001. Contribution à l’étude hydrogéologique des nappes alluviales de Fezouata et Ktaoua (Moyenne vallée du Drâa). Mémoire de D.E.S.A., École Mohammadia d’Ingénieurs, Rabat, Maroc.
Choukrani G, Hilali A, Bouri S, 2018. Diagnostic et projection future du changement climatique en zone aride: Cas de la région Marrakech-Safi (Maroc). Larhyss Journal, 36: 49–63.
Cook ER, Meko DM, Stahle DW, Cleaveland MK, 1999. Drought reconstructions for the continental United States. Journal of Climate, 12(4): 1145–1162. https://doi.org/10.1175/1520-0442(1999)012
Dahan S, 2017. Gestion de la rareté de l’eau en milieu urbain au Maroc. Banque mondiale, Washington, DC. https://documents1.worldbank.org/curated/en/488091516133312338/pdf/summary-report.pdf
Direction de la Recherche et de la Planification de l’Eau (DRPE), 2008. Étude d’actualisation du plan directeur d’aménagement intégré des ressources en eau (PDAIRE) du bassin hydraulique du Drâa. Marché n°106/2008/DRPE, Rapport inédit.
El Qorchi F, Yacoubi Khebiza M, Omondi OA, Karmaoui A, Pham QB, Acharki S, 2023. Analyzing temporal patterns of temperature, precipitation, and drought incidents: A comprehensive study of environmental trends in the Upper Drâa Basin, Morocco. Water, 15(22): 3906. https://doi.org/10.3390/w15223906
Elair C, Rkha Chaham K, Hadri A, 2023. Assessment of drought variability in the Marrakech-Safi region (Morocco) at different time scales using GIS and remote sensing. Water Supply, 23(11): 4592–4624. https://doi.org/10.2166/ws.2023.283
Eyoh A, Okeke F, Ekpa A, 2019. Assessment of the effectiveness of the vegetation condition index (VCI) as an indicator for monitoring drought condition across the Niger Delta region of Nigeria using AVHRR/MODIS NDVI. European Journal of Earth and Environment, 6(1).
Gumus V, El Moçayd N, Seker M, Seaid M, 2024. Future projection of droughts in Morocco and potential impact on agriculture. Journal of Environmental Management, 367: 122019. https://doi.org/10.1016/j.jenvman.2024.122019
Hadri A, Saidi MEM, El Khalki EM, Aachrine B, Saouabe T, Elmaki AA, 2022. Integrated water management under climate change through the application of the WEAP model in a Mediterranean arid region. Journal of Water and Climate Change, 13(6): 2414–2442. https://doi.org/10.2166/wcc.2022.039
Hadria R, Boudhar A, Ouatiki H, Lebrini Y, Elmansouri L, Gadouali F, Hayat Lionboui HL, Benabdelouahab T, 2019. Combining use of TRMM and ground observations of annual precipitations for meteorological drought trends monitoring in Morocco. American Journal of Remote Sensing, 7(2): 25. https://doi.org/10.11648/j.ajrs.20190702.11
Hao Z, Singh VP, 2015. Drought characterization from a multivariate perspective: A review. Journal of Hydrology, 527: 668–678. https://doi.org/10.1016/j.jhydrol.2015.05.031
Houmma H, Ismaguil I, Gadal S, El Mansouri L, Garba M, Gbetkom PG, Mamane Barkawi MB, Hadria R, 2023. A new multivariate agricultural drought composite index based on random forest algorithm and remote sensing data developed for Sahelian agrosystems. Geomatics, Natural Hazards and Risk, 14(1): 2223384. https://doi.org/10.1080/19475705.2023.2223384
Justice CO, Vermote E, Townshend JRG, Defries R, Roy DP, Hall DK, Salomonson VV, Privette JL, Riggs G, Strahler A, Lucht W, Myneni RP, Knyazikhin Y, Running SW, Nemani RR, Wan Z, Huete AR, van Leeuwen W, Wolfe RE, Giglio L, Muller J-P, Lewis P, Barnsley MJ, 1998. The Moderate Resolution Imaging Spectroradiometer (MODIS): Land remote sensing for global change research. NASA Publications, 28. https://digitalcommons.unl.edu/nasapub/28
Kim J-S, Park S-Y, Lee J-H, Chen J, Chen S, Kim T-W, 2021. Integrated drought monitoring and evaluation through multi-sensor satellite-based statistical simulation. Remote Sensing, 13(2): 272. https://doi.org/10.3390/rs13020272
Kogan FN, 1990. Remote sensing of weather impacts on vegetation in non-homogeneous areas. International Journal of Remote Sensing, 11(8): 1405–1419. https://doi.org/10.1080/01431169008955102
Kogan FN, 1997. Global drought watch from space. Bulletin of the American Meteorological Society, 78(4): 621–636. https://doi.org/10.1175/1520-0477(1997)078
Kogan FN, Sullivan J, 1993. Development of global drought-watch system using NOAA/AVHRR data. Advances in Space Research, 13(5): 219–222. https://doi.org/10.1016/0273-1177(93)90548-P
Lahbous M, Touzani L, Ousidahou A, 2023. La sécheresse et son impact sur l’économie marocaine. La Revue d’économie et d’environnement, 3(2): 20–42. https://revuecoenvi.org/index.php/laree/article/view/28
Layelmam M, 2015. Calcul des indicateurs de sécheresse à partir des images NOAA/AVHRR. Rapport de recherche, IAV, CRTS, CRASTE-LF. https://hal.archives-ouvertes.fr/hal-00915461
Lebdi F, Maki A, 2023. La sécheresse au Maghreb: diagnostic, impacts et perspectives pour le renforcement de la résilience du secteur agricole. Tunis: FAO. https://doi.org/10.4060/cc7126fr
Ji L, Peters AJ, 2003. Assessing vegetation response to drought in the northern Great Plains using vegetation and drought indices. Remote Sensing of Environment, 87(1): 85–98. https://doi.org/10.1016/S0034-4257(03)00174-3
Li J, Zhou S, Hu R, 2016. Hydrological drought class transition using SPI and SRI time series by loglinear regression. Water Resources Management, 30(2): 669–684. https://doi.org/10.1007/s11269-015-1184-7
Liu W, Kogan FN, 2002. Monitoring Brazilian soybean production using NOAA/AVHRR based vegetation condition indices. International Journal of Remote Sensing, 23: 1161–1179.
McFeeters SK, 1996. The use of the normalized difference water index (NDWI) in the delineation of open water features. International Journal of Remote Sensing, 17(7): 1425–1432. https://doi.org/10.1080/01431169608948714
McKee TB, Doesken NJ, Kleist J, 1993. The relationship of drought frequency and duration to time scales. Dans: Proceedings of the 8th Conference on Applied Climatology, 179–186. American Meteorological Society.
McKee TB, Doesken NJ, Kleist J, 1995. Drought monitoring with multiple time scales. Dans: Proceedings of the 9th Conference on Applied Climatology, 233–236. American Meteorological Society, Dallas, TX.
Mehdaoui R, Mili EM, Seghir A, 2018. Caractérisation à l’aide du SPI de la sécheresse climatique dans le bassin versant de Ziz (Sud-Est, Maroc). European Scientific Journal, 14(21): 177–194.
Ouysse S, Laftouhi N-E, Tajeddine K, 2010. Impact of climate variations on water resources in the Drâa basin (Morocco): Correlation between precipitation and evapotranspiration variability in the Drâa basin. Dans: Proceedings of the International Conference on Participatory and Integrated Management of Water Resources in Arid Zones (GIRE3D), Ouarzazate, Morocco.
Palmer WC, 1965. Meteorological drought. Office of Climatology Research Paper No. 45. Washington DC: US Weather Bureau.
Rouse JW, Haas RH, Schell JA, Deering DW, 1973. Monitoring vegetation systems in the Great Plains with ERTS (Earth Resources Technology Satellite). Dans: Proceedings of 3rd Earth Resources Technology Satellite Symposium, Greenbelt, MD, USA, décembre 10–14, pp. 309–317.
Sadiki A, Hanchane M, 2024. Apport des SIG et de la télédétection dans le suivi et la cartographie du lac de barrage Mansour Eddahbi (Sud-Est du Maroc). Espaces, Revue de Géographie, (11-12): 19–25.
Saouabe T, Naceur KA, El Khalki EM, Hadri A, Saidi ME, 2022. GPM-IMERG product: A new way to assess the climate change impact on water resources in a Moroccan semi-arid basin. Journal of Water and Climate Change, 13(7): 2559–2576. https://doi.org/10.2166/wcc.2022.403
Schulz W, 2004. Reconstructing mediatization as an analytical concept. European Journal of Communication, 19(1): 87–101. https://doi.org/10.1177/0267323104040696
Schulz O, Busche H, Benbouziane A, 2008. Decadal precipitation variances and reservoir inflow in the semi-arid Upper Drâa Basin (South-Eastern Morocco). Dans: Zereini F, Hötzl H (éds). Climatic Changes and Water Resources in the Middle East and North Africa, Environmental Science and Engineering, pp. 165–178. Springer, Berlin, Heidelberg. https://doi.org/10.1007/978-3-540-85047-2_13
Scian B, Donnari M, 1997. Retrospective analysis of the Palmer Drought Severity Index in the semi-arid Pampas region, Argentina. International Journal of Climatology, 17(3): 313–322. https://doi.org/10.1002/(SICI)1097-0088(19970315)17:3<313::AID-JOC112>3.0.CO;2-W
Seiler RA, Kogan F, Sullivan J, 1998. AVHRR-based vegetation and temperature condition indices for drought detection in Argentina. Advances in Space Research, 21(3): 481–484. https://doi.org/10.1016/S0273-1177(97)00884-3
Serbouti I, Chenal J, Pradhan B, Diop EB, Azmi R, Abdem SAE, Adraoui M, Hlal M, Bounabi M, 2024. Assessing the impact of agricultural practices and urban expansion on drought dynamics using a multi-drought index application implemented in Google Earth Engine: A case study of the Oum-Er-Rbia watershed, Morocco. Remote Sensing, 16: 3398. https://doi.org/10.3390/rs16183398
Stour L, Agoumi A, 2008. Climatic drought in Morocco during the last decades. Hydroécologie Appliquée, 16: 215–232.
Wang Q, Shi P, Lei T, Geng G, Liu J, Mo X, Li X, Zhou H, Wu J, 2015. The alleviating trend of drought in the Huang-Huai-Hai Plain of China based on the daily SPEI. International Journal of Climatology, 35(13): 3760–3769. https://doi.org/10.1002/joc.4244
Waroux YLP, 2013. Dégradation environnementale et développement économique dans l’arganeraie d’Aoulouz (Maroc). Sécheresse, 24(1): 29–38.
Weber B, 2004. Untersuchungen zum Bodenwasserhaushalt und Modellierung der Bodenwasserflüsse entlang eines Höhen- und Ariditätsgradienten (SE Marokko). Thèse de doctorat.
Wilhite DA, 2000. Drought planning and risk assessment: status and future directions. Annals of Arid Zone, 39: 211–230.
Wilhite, D. A., Sivakumar, M. V. K., & Wood, D. A. (Eds.). (2000). Early Warning Systems for Drought Preparedness and Drought Management. Proceedings of the Expert Group Meeting, Lisbon, Portugal, 5–7 September 2000. Geneva, Switzerland: World Meteorological Organization (WMO).
World Meteorological Organization (WMO), 2012. Standardized precipitation index user guide (M. Svoboda, M. Hayes, & D. Wood). WMO-No. 1090. Genève: WMO. https://library.wmo.int/viewer/31481/download?file=wmo_1090_fr.pdf&navigator=1&type=pdf
Zhang A, Jia G, 2013. Monitoring meteorological drought in semiarid regions using multi-sensor microwave remote sensing data. Remote Sensing of Environment, 134: 12–23. https://doi.org/10.1016/j.rse.2013.02.023
Zkhiri W, Tramblay Y, Hanich L, Jarlan L, Ruelland D, 2018. Spatiotemporal characterization of current and future droughts in the High Atlas basins (Morocco). Theoretical and Applied Climatology, 135(1-2): 593–605. https://doi.org/10.1007/s00704-018-2388-6