A new spatial-temporal modelling approach for predicting rice drought in Indonesia using the Standardized Precipitation Index
1 Research Center for Climate and Atmosphere, National Research and Innovation Agency (BRIN), Jl. Raya Puspiptek 60, Tangerang Selatan 15310. Indonesia
2 Research Center for Geoinformatics, National Research and Innovation Agency (BRIN), Raya Jakarta-Bogor KM 46, Cibinong, Indonesia
3 Faculty of Earth Sciences and Technology, Bandung Institute of Technology, Jl Ganesha no 10. Bandung, Indonesia
4 Research Center for Energy Conversion Technology, National Research and Innovation Agency (BRIN), Jl. Raya Puspiptek 60, Tangerang Selatan 15310. Indonesia
*Corresponding author. E-mail: elza001@brin.go.id
Abstract. Agricultural drought poses a major threat to rice production in Indonesia, highlighting the need for dynamic prediction to support timely and effective management strategies. This study aims to develop a new approach for predicting rice drought stress that incorporates the characteristics of SPI3, emphasizing onset and trends, and to evaluate the model’s accuracy in predicting rice drought. The onset of SPI3 denotes conditions at the start of the planting season, while the SPI3 trend represents the four-month gradient from planting to harvest. The Normalized Difference Vegetation Index (NDVI) derived from MODIS was utilized to validate the spatial and temporal predictions of rice drought using the Proportion Correct (PC) method. The model performs most reliably in capturing severe droughts during the dry season, with accuracies in the very high drought category ranging from 60% to 85%. Performance declines in March and August, highlighting challenges during the transitions between wet and dry seasons. During the El Niño year, predictions aligned with observed very high drought (PC: 59–77%), whereas in the La Niña year, they matched the low drought category (PC: 72–76%). Comparable prediction accuracies in Indramayu and Bone indicate the feasibility of developing a generalized model for Indonesia’s diverse rice-producing areas. Future improvements should integrate higher-resolution data and machine learning, account for local irrigation practices, and expand validation across regions to enhance model transferability and comprehensively assess its performance.
Keywords: drought, rice, prediction, SPI3, NDVI.
– Rice production in Indonesia is highly susceptible to drought, with the damaged areas increasing sharply during El Niño years.
– The onset and trend of the 3-month Standardized Precipitation Index (SPI3) reflect drought risk across the growing season, making it a reliable predictor of rice drought.
– Negative SPI3 trends correspond to lower yields, while positive trends indicate higher yields, demonstrating SPI3’s predictive value for yield variability.
– The higher accuracy in predicting severe rice drought enhances early warning systems and enables proactive drought mitigation.
Drought, as a natural disaster, demonstrates a complex and cascading nature, leading to more severe impacts compared to single-disaster events. Agriculture is significantly affected by drought hazards, which are a primary cause of crop failures and pose a substantial threat to global food security (FAO, 2012; Zinat et al., 2020). Prior studies indicate that the duration and intensity of droughts are expected to increase significantly in the future (Zhou et al., 2023; Li et al., 2024). These findings confirm that drought represents a considerable future threat, underscoring the necessity of understanding its patterns and intensity for effective anticipatory action.
Rice serves as the staple food for over 280 million people in Indonesia. Rice fields cover approximately 7.4 million hectares across various regions of the country (BPS [Statistics Indonesia], 2024). Planting generally occurs twice a year, namely during the wet season planting (WSP) and the first dry-season planting (DSP1), with the possibility of a third planting in irrigated areas when water resources are sufficient (the second dry-season planting, DSP2). Rice production in Indonesia is highly susceptible to drought, particularly during the dry-season plantings (Naylor et al., 2007; Surmaini et al., 2015). El Niño events are often associated with droughts that significantly reduce rice production in Indonesia (D’Arrigo and Wilson, 2008; Surmaini et al., 2015; Boer and Surmaini, 2020). Data from the Ministry of Agriculture of the Republic of Indonesia indicate that prolonged droughts caused by moderate to strong El Niño events between 1990 and 2020 resulted in annual rice production losses ranging from approximately 500,000 to 1.7 million tons.
Droughts are typically classified according to their duration and impacts on various ecological and social contexts (Mishra and Singh, 2010). Consequently, they are generally categorized into four types: meteorological, agricultural, hydrological, and socio-economic droughts. The transition from meteorological drought to agricultural drought is particularly crucial for developing effective early warning systems for agricultural drought (Xu et al., 2023). Drought propagation refers to the transition from meteorological drought to other types of drought (Bhardwaj et al., 2020). Typically, droughts begin with insufficient precipitation, which subsequently reduces soil moisture and decreases surface and groundwater availability (Hao & Singh, 2015), ultimately leading to adverse effects on crops (Wu et al., 2020; Li et al., 2024).
The Standardized Precipitation Index (SPI) is widely recognized as one of the most the straightforward method for drought analysis and monitoring (McKee et al., 1993). Its widespread adoption can be attributed to its interpretability, comparability, standardized calculation methods (Zipper et al., 2016; Leng and Hall, 2019), flexibility, simplicity, and accessibility of data (Dai et al., 2020). In addition, SPI is easy to compute and demonstrates strong adaptability across both temporal and spatial scales (Pei et al., 2020). The SPI at a 3-month scale (SPI3) is particularly suitable for agricultural drought monitoring because it captures short to medium term precipitation deficits that directly affect soil moisture and crop growth (McKee et al., 1993; Zargar et al., 2011). Tsige et al. (2019) identified a strong relationship between SPI3 and agricultural drought, making it a valuable indicator for monitoring agricultural drought (Dai et al., 2020).
Although the SPI is a well-established and widely applied indicator for drought assessment, it frequently categorizes drought events based on static thresholds or classifications. This study introduces a novel interpretive framework by focusing on the gradual onset and trend dynamics of SPI3 as a predictive indicator for rice drought. Our approach emphasizes the temporal pattern and directionality of SPI3, monitoring how its values evolve before a drought fully manifests. To our knowledge, few studies examine SPI3 in this dynamic, trend-oriented manner specifically tailored for agronomic drought prediction in rice systems. The primary ratio for employing this index as a drought predictor is the recognition that rice growth and yield are influenced not only by conditions at the onset of planting but also throughout the entire growing period. By capturing the gradual escalation and directional shifts of SPI3 values, our method offers earlier detection of emerging drought stress aligned with critical rice growth stages, enabling a more sensitive and agronomically relevant early-warning tool. The objective of this study is to develop a rice drought prediction model that incorporates combined SPI3 characteristics, with an emphasis on the onset and trend dynamics, and to evaluate the model’s accuracy in predicting rice drought.
The model was constructed using data from two districts, namely Indramayu in West Java Province, representing the monsoon rainfall pattern, and Bone in South Sulawesi Province, exemplifying the local rainfall pattern. These regions serve as key centers of rice production and are vulnerable to drought occurrences. Indramayu is located in the western region of Indonesia, whereas Bone is situated in the central region (Figure 1).
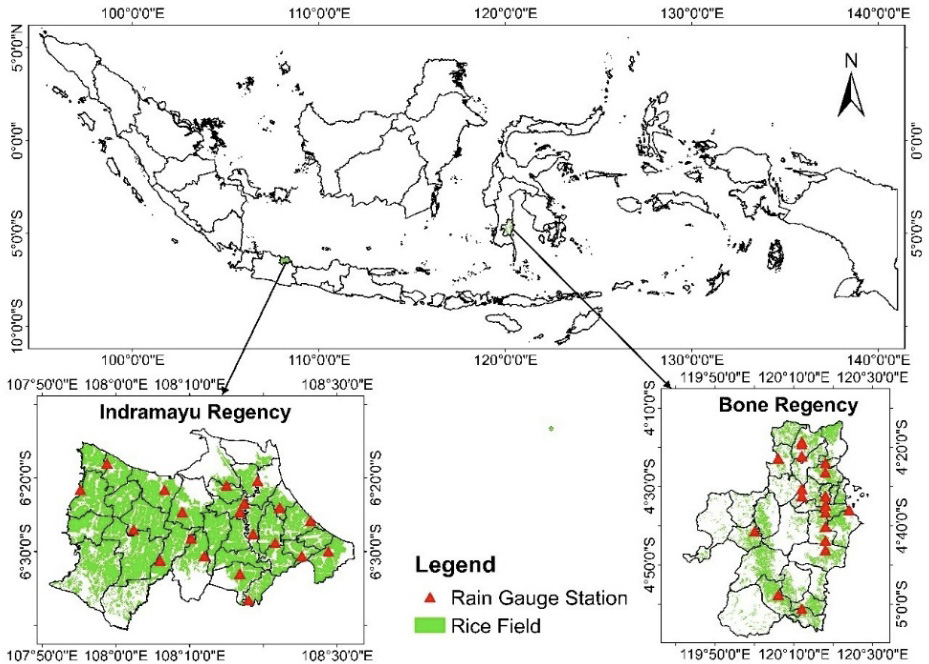
Daily meteorological data from 38 rain gauge stations in Indramayu and Bone, including rainfall, minimum and maximum temperatures, and solar radiation, were collected for the period 1982–2009. The spatial distribution of the rain gauge stations used in this study is shown in Figure 1. In addition, gridded rainfall data from the Climate Hazards Group InfraRed Precipitation with Station (CHIRPS) dataset for the years 2010–2019 were used for the SPI3 model application.
Soil data samples were collected from study fields in each sub-district of Indramayu and Bone. The data included drainage class, runoff potential, slope, soil layers, texture, organic carbon, pH, nitrogen content, bulk density, and cation exchange capacity.
In this study, management practices data were obtained through interviews with farmers. The data included sowing date, sowing density, row width, transplanting date, fertilizer application rates and dates, as well as irrigation application dates and amounts.
Data on crop phenology were obtained from the Book of Variety Description of Rice published by the Indonesian Center for Food Crops Research and Development (ICFORD). The data included crop varieties, emergence, flowering, maturity, heat units, biomass at each stage, and yield.
The Normalized Difference Vegetation Index (NDVI) was generated from MOD13Q1.061 Terra Vegetation Indices of MODIS TERRA, with a spatial resolution of 250 m and a temporal resolution of 16 days. The MODIS data underwent atmospheric correction to ensure reliable measurements of vegetation indices over time (de Oliveira and Epiphanio, 2012).
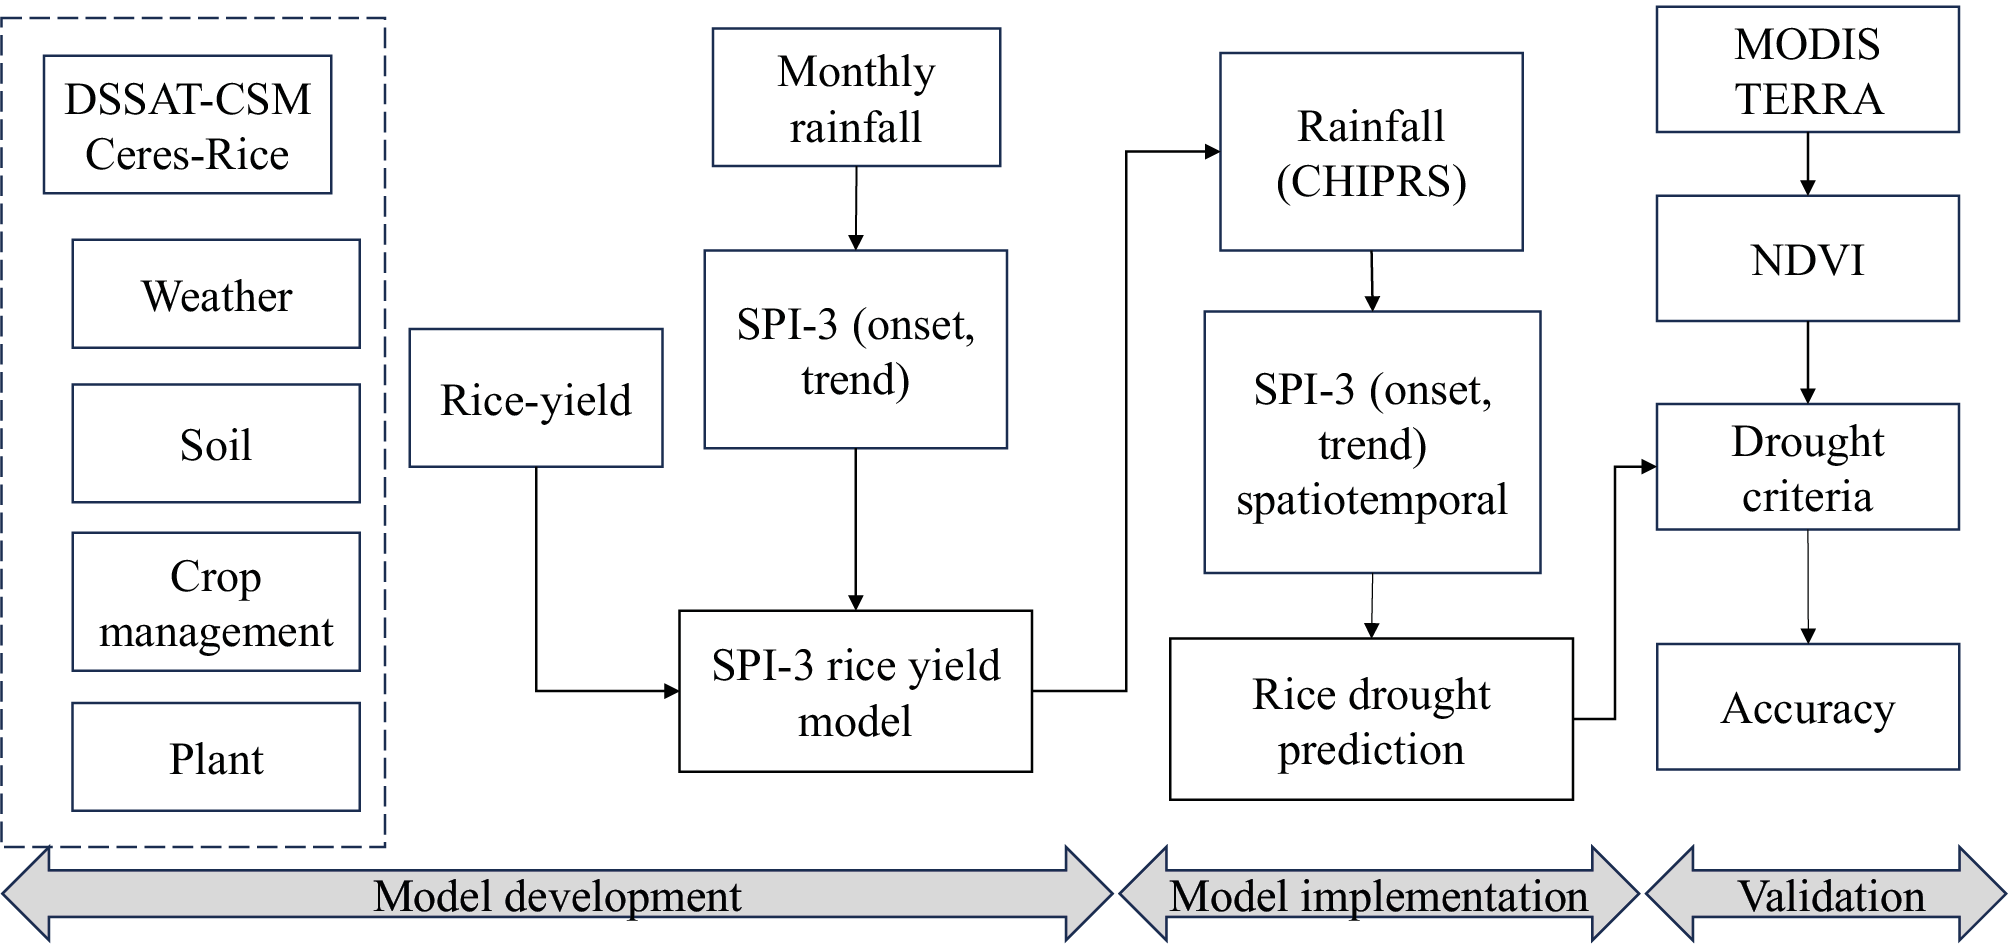
The method begins with the simulation of probable rice yields using the Decision Support System for Agro-technology Transfer (DSSAT) and the development of the SPI3–rice yield model. The model is implemented with SPI3, informed by gridded rainfall data from CHIRPS, to assess the spatial prediction of rice drought. The final step involves validating rice drought predictions using NDVI obtained from MODIS TERRA and evaluating prediction skill with the Proportion Correct (PC) method. Figure 2 presents the analysis flowchart.
The CERES-Rice model, a component of DSSAT (Hoogenboom et al., 2023; Jones et al., 2003), was used to simulate rice yield. The model has been validated and shown to provide high accuracy for the Indonesian region (Boer and Surmaini, 2020), with simulated rice yield results of R²-adj = 88% (P<0.01). Planting date scenarios were established at 10-day intervals during the dry season, specifically on the 5th, 15th, and 25th of February, March, April, and May in Indramayu, and in May, June, July, and August in Bone for the period 1982–2009. The rice variety used was Ciherang, with a common fertilizer application of 200 kg/ha of urea, applied twice at 10 and 40 days after planting. Planting distance was set at 25 × 20 cm, and transplanting was conducted 21 days after seedling emergence.
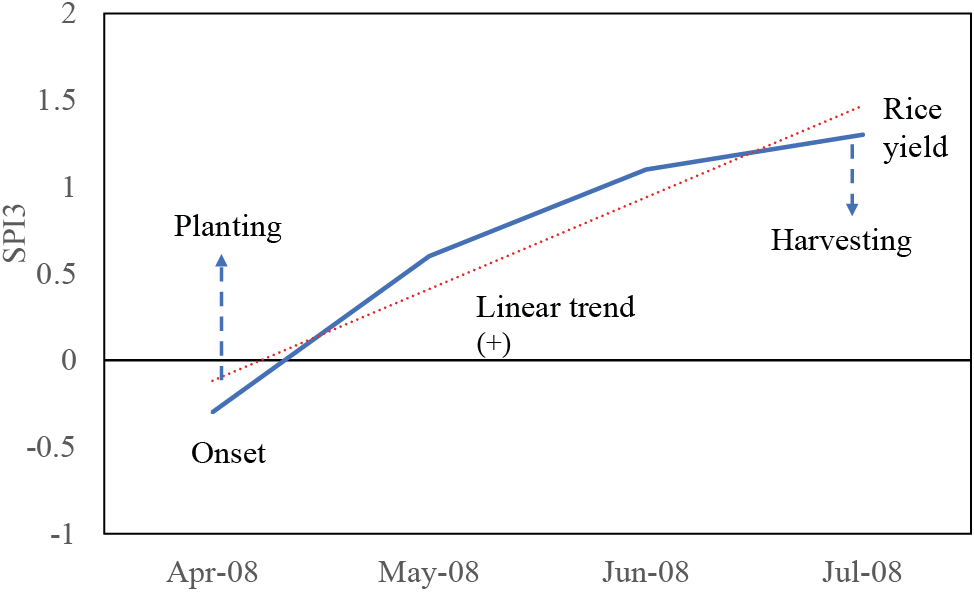
The SPI3 is calculated using the formula proposed by McKee et al. (1993). The SPI3 compares precipitation over a specific three-month period with historical records for the same period. The onset of SPI3 denotes its value at the beginning of the planting season. The SPI3 trend is defined by the gradient of SPI3 over four months, spanning from planting initiation to harvest, as shown in Figure 3. Rice yield predictions were generated one month prior to planting, providing an early warning of potential yield losses due to drought.
Linkage between the onset and trend SPI3 and rice yield
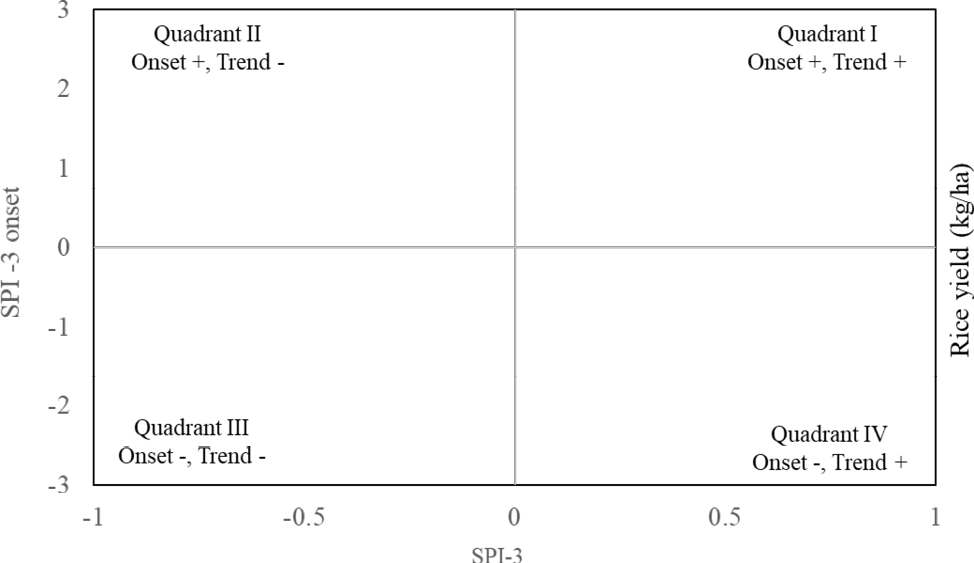
The Cartesian plane quadrants were utilized to examine the relationships between the onset and trend of SPI3 and rice yield (Figure 4). Quadrant (Q) I indicates the emergence of a positive SPI3 accompanied by an upward trend. Q II demonstrates the commencement of a positive SPI3, albeit with a declining trend. Q III depicts the onset of a negative SPI3, yet shows an upward trend. Finally, Q IV denotes the onset of a negative SPI3 with a declining trend. The SPI3 trend further provides insights into moisture dynamics, where a positive trend indicates an increase in moisture levels over time, whereas a negative trend signifies decreasing moisture levels.
Validation of rice drought prediction
This study employed NDVI to validate the spatial and temporal patterns of rice drought. In rice cultivation, which is particularly sensitive to variations in water availability, NDVI is instrumental in detecting early indicators of drought stress (Thapa et al., 2019). The dataset comprises two primary near-infrared (NIR) bands, which were employed to calculate NDVI following the formulation in Equation (1):
(1)
NDVI anomalies were calculated by comparing the monthly NDVI values for each year with a baseline period from 2014 to 2020. Negative anomalies indicated vegetation health below normal levels, suggesting the occurrence of water stress (Nanzad et al., 2019). The formula for NDVI anomaly is defined by Equation (2):
(2)
Where: NDVIobserved is the monthly median NDVI value for a specific time period. NDVIbaseline is the monthly median NDVI value over a baseline period.
Vegetation anomalies were classified into four severity levels based on NDVI anomaly values, determined by predefined thresholds, as shown in Table 1.
| Class | NDVI Anomaly Range | Drought level | Description |
|---|---|---|---|
| Class 1 | Anomaly > 0.05 | Low | Above-normal vegetation growth, likely resulting from surplus water availability |
| Class 2 | -0.05 ≤ Anomaly ≤ 0.05 | Moderate | Absence of significant water stress or drought conditions |
| Class 3 | -0.1 ≤ Anomaly < -0.05 | High | Minor drought conditions, characterized by vegetation experiencing moderate water stress |
| Class 4 | Anomaly < -0.1 | Very High | Signify severe drought conditions |
Proportion of Correct (PC) is recognized as the most straightforward for assessing the accuracy of categorical forecast systems. Its simplicity and ease of interpretation make it a useful baseline for evaluating model performance, particularly when class distributions are balanced (Nurmi, 2003; Wilks, 2019), and it has been widely used in drought prediction systems where ease of communication to stakeholders is critical (Wilks, 2019). This measure is derived by calculating the ratio of accurate predictions to the total number of predictions, as described by Equation (3). The schematic contingency for categorical forecasts is detailed in Table 2.
(3)
The PC methods commonly applied to analyze categorical data are based on contingency tables (Mason, 2012). The elements of equation 3 and Table 2 are defined as a (hits) represents the number of true positives, where the model predicted drought and drought was observed, b (false alarms) indicates the number of false positive, where the model predicted drought, although no drought was observed, c (misses) represents the number of false negative, where the model predicted no drought, but drought was occurred, d (correct rejections) indicates the number of true negatives, where the model correctly predicted no drought and no drought was observed, and n expresses the total number of observations.
| Forecast | Observed | ||
|---|---|---|---|
| Yes | No | Total | |
| Yes | a (Hits) | b (False alarms) | a+b |
| No | c (Misses) | d (Correct rejections) | c+d |
| Total | a+c | b+d | a+b+c+d= n |
The model was developed using historical data from 1982 to 2009, which served as the model construction. The validation process was conducted using an independent dataset covering the period 2014 to 2020, applied at monthly intervals. The choice of these periods was determined by the availability and consistency of reliable data, while the gap years (2010-2013) were excluded due to data incompleteness. This approach ensured that the model’s performance could be rigorously evaluated under independent conditions, thereby strengthening the reliability of its predictive capability. Additional validation was conducted for specific months in DSP1 (June) and DSP2 (October) during Neutral (2014), El Niño (2015), and La Niña (2017) years.
Association between SPI3 and rice yield
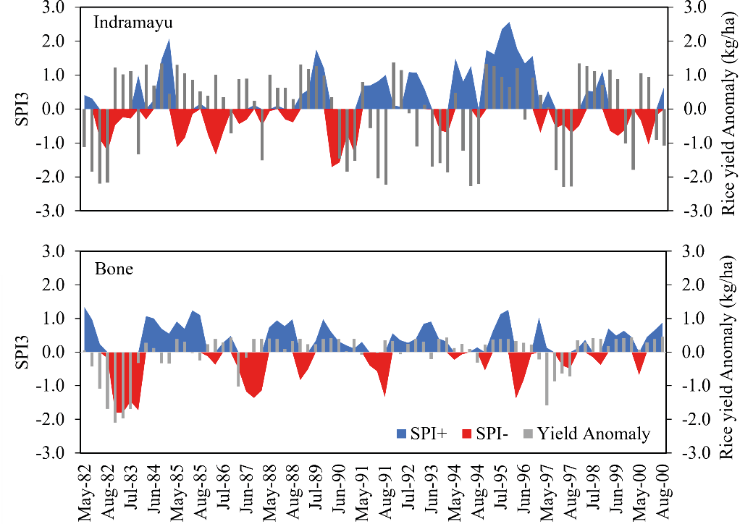
Figure 5 illustrates that the temporal patterns of SPI3 and rice yield anomalies show that periods of negative and positive rice yield anomalies are interspersed with dry and wet conditions throughout the study years. In Indramayu, notable drought events, indicated by negative SPI3 values, were recorded in 1982, 1991, and 1997. During these years, rice yield anomalies were markedly lower than average, reflecting a significant reduction in actual rice yields compared to typical levels. These events are associated with reduced WSP periods and production, consistent with the lower-than-average yield anomalies we observe in those years (Siswanto et al., 2022). In contrast, in Bone, yield declines occur only during extreme or prolonged drought, reflecting local hydroclimatic and management differences (Sunusi et al., 2024). This spatial heterogeneity in drought–yield relationships highlights a broader pattern seen across Indonesia, where rice yield responses to SPI-based drought indicators vary considerably depending on local agroclimatic conditions (Hendrawan et al., 2023).
The onset and trend SPI3 - rice yield model
Figure 6 was generated by combining data from the two study areas, Indramayu and Bone. These data were used to develop a prediction model designed to robustly capture agricultural drought events in distinct rainfall regimes, specifically the monsoonal rainfall in Indramayu and the local rainfall in Bone.
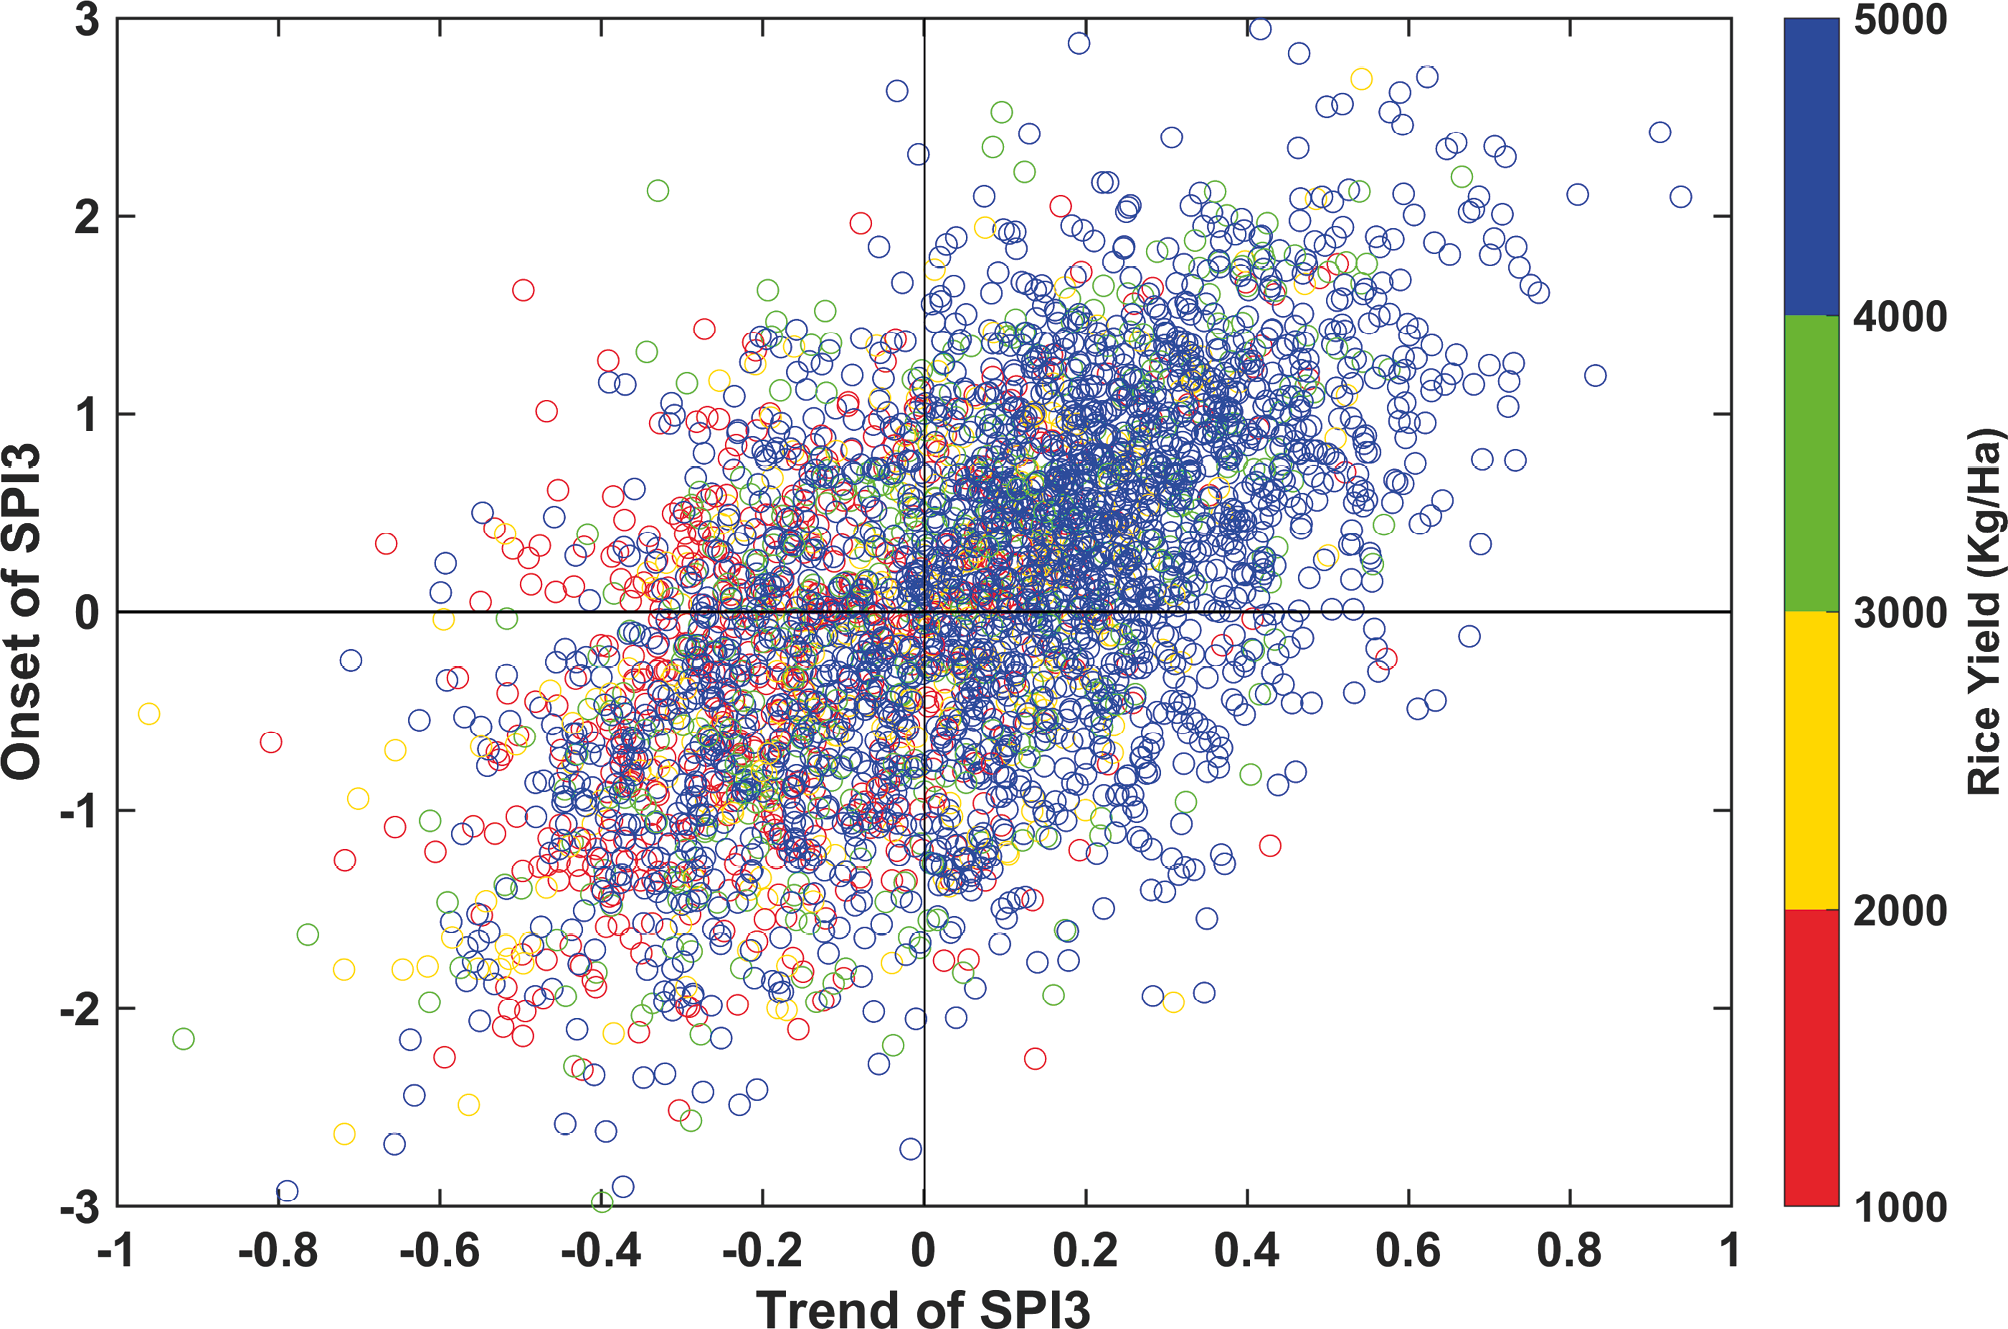
This figure reveals a clear association between the onset and trend of SPI3 and rice yields. Rice yields below 2 t/ha appear more frequently in Quadrants II and III, which are characterized by negative SPI3 trends indicating drier conditions during the growing season, consistent with other regional findings that SPI3 effectively captures drought-induced reductions in rice productivity (Surmaini et al., 2019). In contrast, Quadrants I and IV - marked by positive SPI3 trends and therefore wetter conditions show a higher incidence of rice yields exceeding 4 t/ha, suggesting improved moisture availability significantly mitigates drought-induced yield losses.
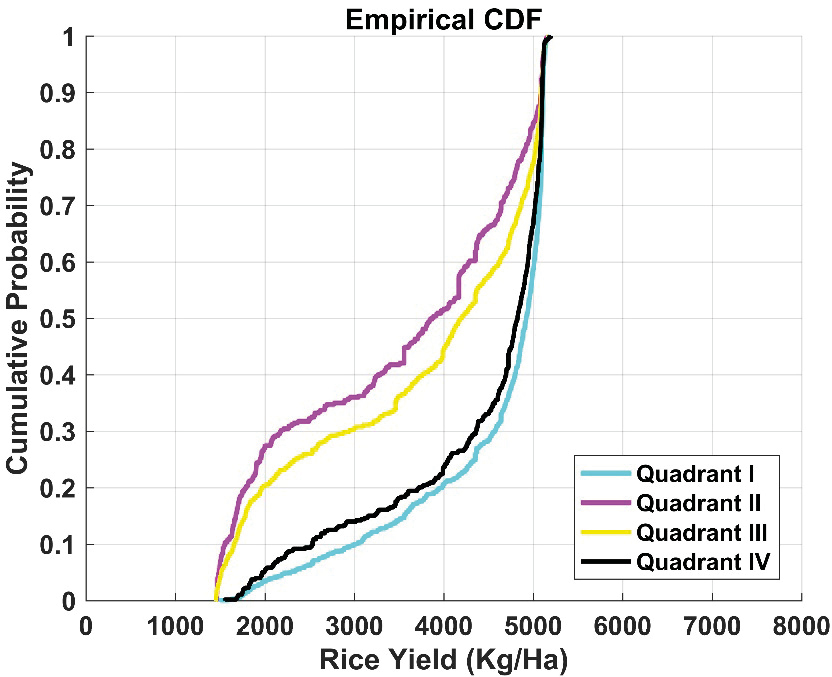
The Cumulative Distribution Function (CDF) offers a compelling visualization of the probability distribution of rice yields under the corresponding conditions in each quadrant. Figure 7 shows the CDF curves for QII and QIII, which demonstrate a gradual increase up to less than 4 t/ha, indicating that lower rice yields are more prevalent when both SPI3 trends are negative. In contrast, in QI and QIV, the CDF curves exhibit a steep increase once rice yields exceed 4 t/ha, suggesting that higher rice yields are more common when both the onset and trend of SPI3 are positive.
The rice drought category in each quadrant is assessed using a score based on a rice yield threshold of 2 t/ha, under the assumption that drought conditions result in yields falling below this level. The score is calculated by multiplying the percentage of rice yields below 2 t/ha in each quadrant by the probability of these yields occurring in that quadrant, relative to the total sample across all quadrants. The rice drought categories are classified into four levels, as presented in Table 3.
| Quadrant | Sample (%) Rice yield < 2 ton/ha (a) | Probability of rice yield < 2 ton/ha (b) | Score (axb) | Drought level |
|---|---|---|---|---|
| I | 15.194 | 0.034 | 0.005 | Low |
| II | 24.734 | 0.276 | 0.068 | High |
| III | 50.707 | 0.328 | 0.166 | Very high |
| IV | 9.364 | 0.130 | 0.012 | Moderate |
Skill of rice drought prediction
The performance of rice drought prediction across four drought categories from 2014 to 2020 is shown in Figure 8. The analysis was conducted monthly from January to December, comparing the model’s predictions with observed conditions using NDVI data from the MOD13Q1 product.
Figure 8 (a) displays rice drought predictions in Indramayu. In the low drought category, accuracy typically ranges from 50% to 80%. In the moderate category, accuracy varies between 40% and 70%, with reduced error bars indicating increased confidence. However, significant declines are observed in March and August, highlighting difficulties during the transitions between wet and dry seasons. The high category exhibits marginally higher accuracy (50-75%) compared to the moderate category, albeit with greater error margins. In the very high category, accuracy ranges from 60% to 85%, peaking in June and July during the dry season. These findings suggest that the model is more effective in predicting severe droughts during the dry season, while its performance diminishes during the wet and transitional seasons.
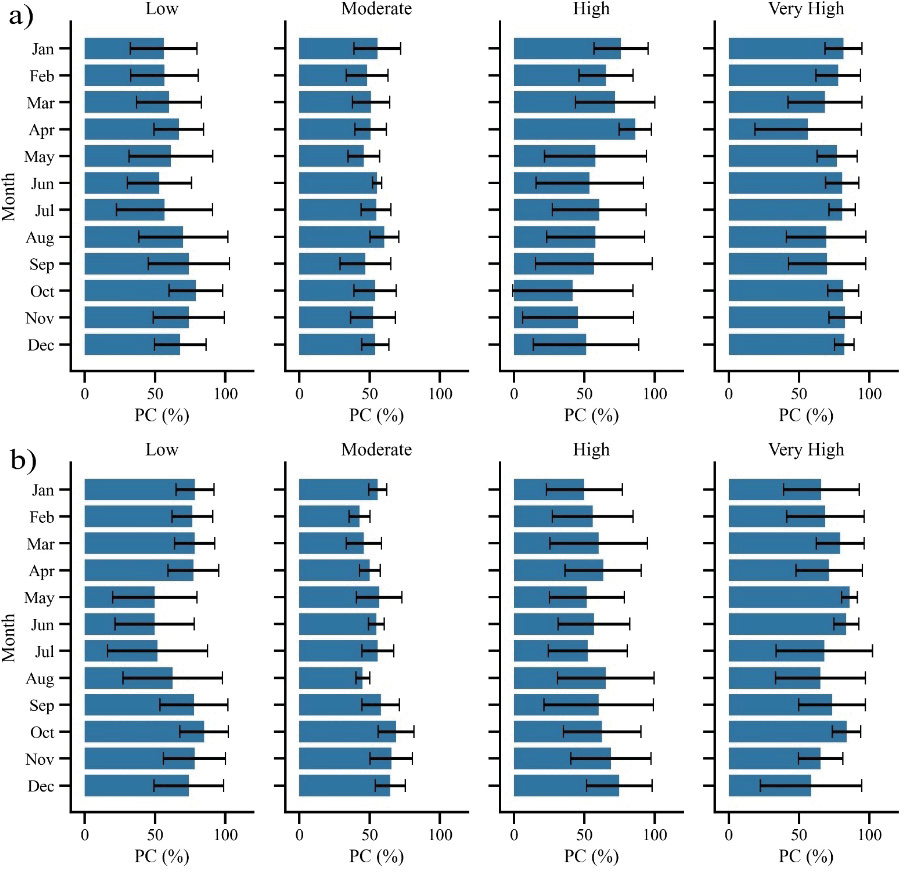
Figure 8 (b) displays the efficacy of rice drought prediction in Bone. In the Low drought category, accuracies vary between 50% and 75%, with large error bars indicating high variability. In the Moderate drought category, accuracies range from 40% to 60%, with narrower error margins, suggesting a higher level of confidence. The model’s accuracy for the High drought category ranges from 40% to 80%, with reduced performance observed during the wet season (October to December). This indicates challenges in accurately identifying severe drought events during the transitional dry–wet season. In the Very High category, accuracy improves across the months, ranging from 60% to 85%, suggesting enhanced performance. However, substantial uncertainty remains in predicting extreme drought conditions in April and September, highlighting challenges during transitions between the dry and wet seasons.
Figure 9 depicts the spatially predicted and observed rice drought for June (DSP1) and October (DSP2) in 2014, 2015, and 2017, corresponding to Neutral, El Niño, and La Niña years. The impact of ENSO on rice drought categories in the Indramayu and Bone regions shows a comparable pattern. During El Niño years, rice drought levels are typically higher than in Neutral years, whereas La Niña years generally exhibit lower levels.
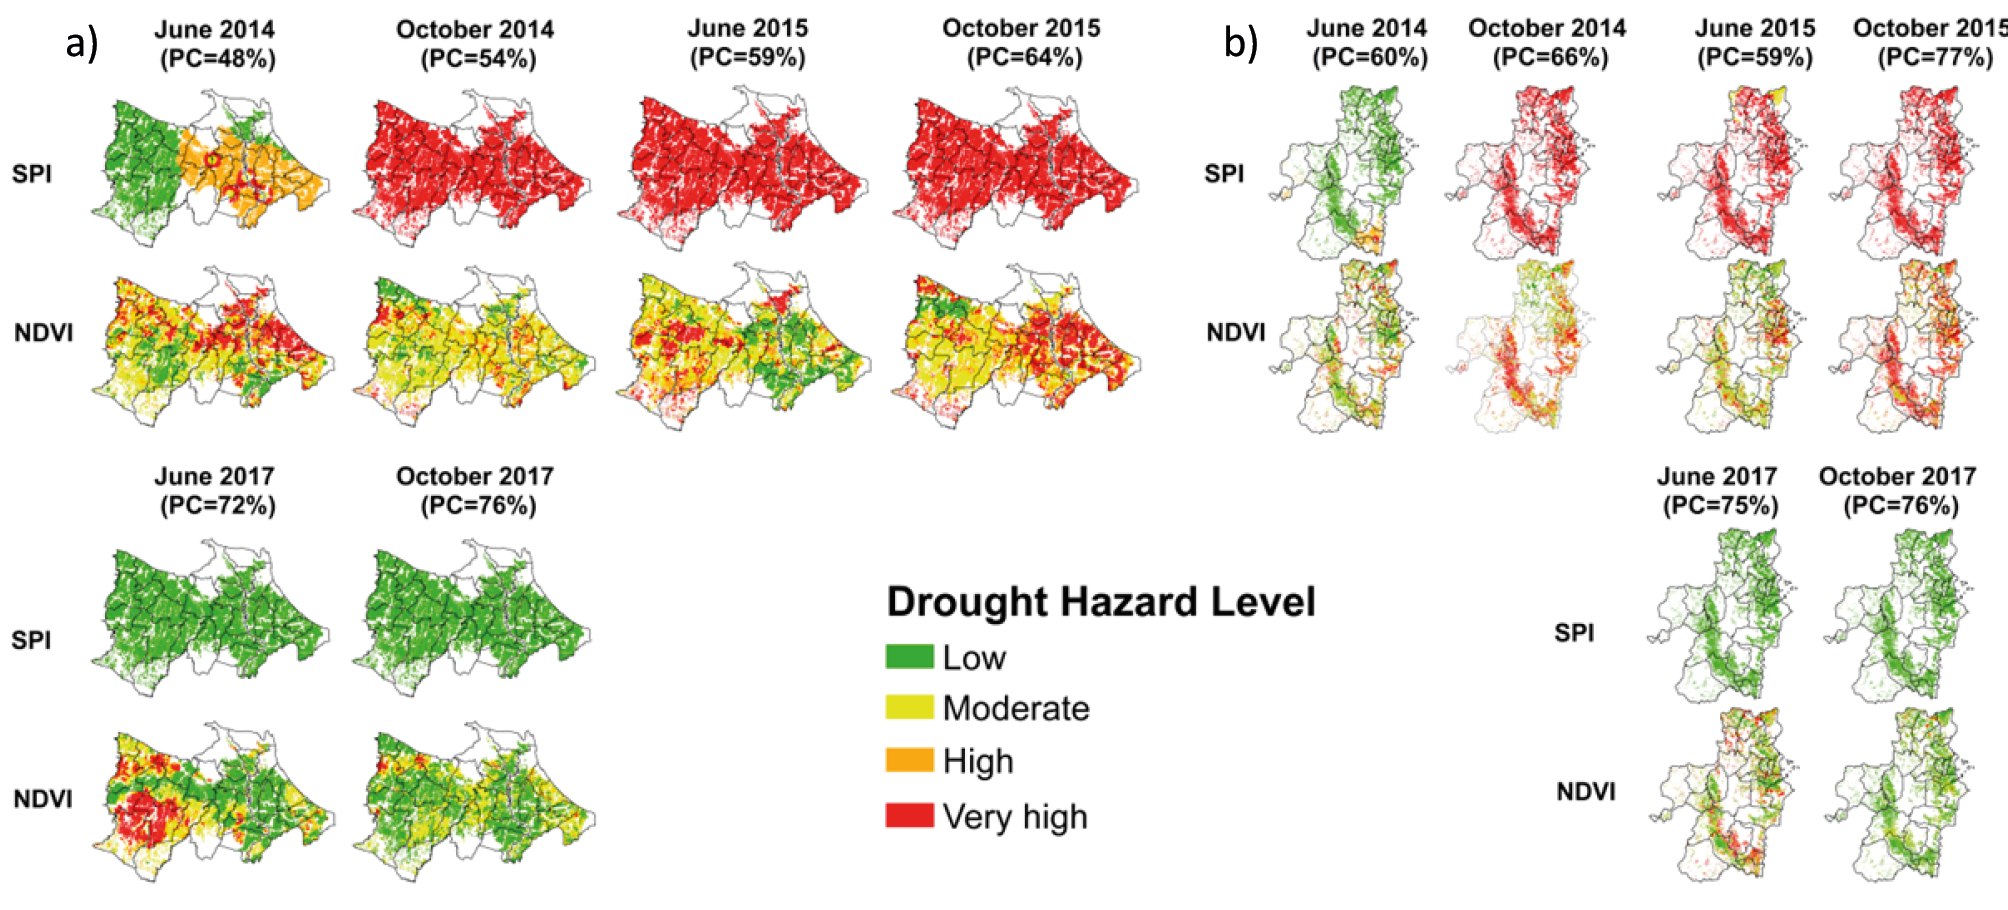
Predictions for October (DSP2) in the Neutral year (2014) and the El Niño year (2015) indicate very high rice drought categories, with the highest PC at 64% for Indramayu and 76% for Bone. In the La Niña year (2017), predictions for June (DSP1) and October closely aligned with the observed low drought category, with the PC for both regencies ranging from 72% to 76%. Observations, however, revealed areas with varying hazard levels from low to high. Rice drought prediction for October shows higher accuracy compared to June, indicating improved model performance during the peak of the dry season. This discrepancy reflects the complexities of local conditions influencing vegetation resilience during drought periods.
Figure 5 highlights the link between SPI3 and rice yield anomalies. In Indramayu, prolonged severe negative SPI3 values are associated with reduced rice yields, as evidenced in 1982, 1991, and 1997. This aligns with the findings of Prabnakorn et al. (2018), which indicate that SPI values below -1 often lead to significant yield reductions. Furthermore, Rejekiningrum et al. (2022) emphasized that regions experiencing increased drought frequency and duration are likely to experience substantial agricultural losses, which underscores the sensitivity of rice cultivation in Indramayu to persistent climate stress. Conversely, in Bone, episodes of negative SPI3 tend to be shorter and less severe, reflecting milder drought conditions with relatively limited impacts on rice productivity. This divergence underscores the role of regional climatic variability in shaping drought risk and agricultural outcomes. It also suggests that while Indramayu requires more robust drought-mitigation strategies, Bone may benefit from adaptive practices that focus on maintaining resilience during shorter-term drought.
Figure 6 illustrates that rice yields exhibit a specific response to SPI3, particularly in relation to the onset and trends, and their progression throughout the growing season. Negative SPI3 values in the early growing season may hinder crop establishment, whereas moisture deficits during the reproductive phase often lead to pronounced yield reductions as a result of water stress during grain development (Ray et al., 2015). In contrast, positive SPI3 values reflect favorable moisture availability, which promotes crop growth and has the potential to enhance yields (Gebrehiwot et al., 2011; Forootan et al., 2019). Our analysis strengthens earlier conclusions by indicating that SPI3 is effective not only in identifying drought occurrence but also in forecasting rice yield anomalies.
The accuracy of rice drought prediction varies across the four drought categories throughout the year, with higher accuracy observed in the low and very high drought categories. These observations align with the findings of Mohseni et al. (2021), who reported that satellite-based NDVI data, such as MOD13Q1, are effective in predicting both low and high drought events by clearly distinguishing between normal vegetation and stressed conditions. In contrast, the moderate drought category often shows reduced accuracy. This limitation arises because vegetation stress during moderate drought is relatively subtle, and the associated spectral changes may overlap with those observed under normal conditions. Consequently, NDVI alone may fail to discriminate intermediate drought intensities with sufficient precision (Zhang et al., 2016. Lee et al. (2021) further noted that incorporating additional variables, such as soil moisture or land surface temperature, enhances the accuracy of moderate drought detection by utilizing diverse datasets. Moreover, research using higher-resolution imagery, such as Landsat, has demonstrated improved accuracy in identifying severe droughts (Yang et al., 2023). Nevertheless, MOD13Q1 remains one of the most widely used products due to its temporal frequency and long historical record, even though its relatively coarse spatial resolution introduces challenges in capturing localized extreme drought events.
From an evaluation perspective, the PC method is widely used in drought monitoring because it provides an intuitive measure of correctly classified drought categories and offers a simple means of communicating forecast performance to stakeholders in early warning systems. However, PC has notable limitations, since missing an actual drought (miss) often carries more severe consequences than issuing a false alarm, leading to an overly optimistic view of forecast reliability. For this reason, PC is most effective when used in combination with additional skill scores that capture event-specific performance. Metrics such as the Heidke Skill Score, Cohen’s Kappa, and the Brier Score offer more comprehensive evaluations of categorical forecasts, allowing for a more balanced assessment of model reliability (Mason, 2003; Wilks, 2019).
The discrepancy between drought predictions and NDVI observations in Indramayu during DSP2 (October) of the Neutral year 2014, as well as DSP1 (June) and DSP2 (October) of the El Niño year 2015 (Figure 9a), can largely be explained by the dominance of irrigation infrastructure in the western part of the regency. While the model-based predictions classified these periods into higher drought categories, NDVI values suggested a relatively low drought category in certain areas. This divergence highlights the buffering effect of irrigation systems, which can sustain vegetation health even under negative SPI3 conditions by providing a reliable water supply. (Xiao et al., 2023). Consequently, NDVI may underestimate drought severity in irrigated regions, as vegetation remains green and photosynthetically active despite underlying hydrological stress (Rembold et al., 2019; Satapathy et al., 2024).
In Bone, the accuracy of drought prediction is enhanced by its extensive rainfed rice fields, which enable SPI3 to effectively capture NDVI patterns. Unlike irrigated systems, rainfed agriculture is directly influenced by rainfall anomalies, linking meteorological drought indices and vegetation dynamics more apparent (Rojas et al., 2011; Chen et al., 2025). However, predictive accuracy decreases during transitional months, such as the shift between the dry and wet seasons, when rainfall patterns become highly variable and less predictable. This is often accompanied by a broad error margin, reflecting increased uncertainty in distinguishing between short-term dry spells and the onset of sustained drought conditions (AghaKouchak et al., 2015).
These findings underscore that in regions with extensive irrigation networks, NDVI may fail to fully capture the agricultural impacts of meteorological drought, leading to discrepancies between predicted drought categories and observed vegetation responses. This suggests that integrating additional variables, such as irrigation coverage, groundwater use, could improve the accuracy of drought assessments (He et al., 2022; Purnamasari et al., 2025). For policymakers, this implies that drought early warning systems should incorporate both climatic indicators and agricultural water management practices to provide more reliable information for decision-making.
The prediction accuracies obtained for both regions are nearly identical, indicating that data from Indramayu and Bone can generate predictions with comparable reliability. This finding supports the broader objective of developing a generalized model for application across Indonesia, where diverse rainfall regimes and agroecological conditions prevail. Furthermore, to enhance drought prediction accuracy, future research should prioritize integrating higher-resolution data with machine learning techniques, which could improve both the accuracy and reliability of predictions. Incorporating local irrigation practices into prediction models is crucial, as such practices can significantly mitigate the impacts of drought and lead to discrepancies between observed NDVI and predicted rice drought. Finally, to improve the transferability of the model developed in this study, future work should emphasize validation across diverse regions, time periods, and climate regimes, thereby enabling a more comprehensive assessment of model accuracy and performance.
Several widely used data sources for operational SPI forecasts include the NOAA Climate Prediction Center, which issues global seasonal precipitation outlooks (NOAA, 2024); the ECMWF seasonal forecasting system, which provides ensemble-based precipitation predictions suitable for SPI calculation (ECMWF, 2023); the SPEIbase and Global Drought Observatory platforms, which disseminate SPI and related drought indices across varying time scales (GDO, 2024); and the BMKG’s national seasonal rainfall forecasts, which are routinely available for Indonesia (BMKG, 2023). Although our study was retrospective, these forecast products offer a clear pathway for future operationalization, enabling real-time or anticipatory rice drought prediction and strengthening the applicability of our framework for practitioners and policymakers.
This study proposes a rice drought prediction model that employs the onset and trend of SPI3 as key predictors. The model was developed using data from two major rice-producing regions characterized by contrasting rainfall patterns. The onset of SPI3 refers to its value at the beginning of the planting season, while the SPI3 trend is defined as the gradient over four months from planting initiation to harvest. Rice yield predictions were generated one month prior to planting, providing an early warning of potential yield losses due to drought. Yield estimation within the model was conducted using a crop simulation approach, and drought predictions were validated against NDVI observations.
Our study highlights that the association between the onset and trend of SPI3 is strongly linked to rice yield outcomes. Specifically, lower yields tend to occur under negative SPI3 trends, reflecting drier-than-normal conditions during the growing season, whereas higher yields are generally associated with positive SPI3 trends, indicative of wetter conditions. This relationship underscores the utility of SPI3 not only as a drought indicator but also as a predictor of potential yield variability.
Overall, the results demonstrate that the prediction model performs more reliably in capturing severe drought conditions, particularly during the dry season, whereas its performance declines during wet and transitional periods. In both Indramayu and Bone, accuracies in the very high drought category are consistently higher, with accuracy ranges between 60-85%, indicating the model’s strength in detecting extreme drought events. However, reduced accuracy and larger uncertainties during seasonal transitions highlight the challenges of predicting drought under highly variable climatic conditions. During El Niño years, rice drought categories are typically elevated compared to neutral years, with PCs ranging from 59% to 77%, whereas in La Niña years they correspond more closely with the observed low drought category, with PCs ranging from 72% to 76%.
The higher accuracy achieved for the very high rice drought category in this study is crucial for advancing rice drought prediction. Comparable prediction accuracies for Indramayu and Bone further support the feasibility of developing a generalized model applicable across Indonesia’s diverse agroecological conditions. Nevertheless, accuracy decreases during transitional periods, highlighting the challenges of maintaining predictive reliability amid rapidly changing rainfall patterns. Incorporating local irrigation practices into the model is essential, as such practices can markedly alter drought impacts and explain discrepancies between observed NDVI and predicted rice drought. In addition, expanding validation across multiple regions, time periods, and climate regimes is essential to enhance the model’s transferability and provide a thorough assessment of its accuracy, reliability, and overall performance under diverse agroclimatic conditions.
This study was partly supported by the Indonesian Agency for Agricultural Research and Development (Grant No. 83.3/PL.040/I.1/04/2016.K). We are grateful for the invaluable support provided by the Weather and Climate Prediction Laboratory, Bandung Institute of Technology.
AghaKouchak A., Melton F.S., Teixeira J., Anderson M.C., Wardlow B.D., Hainet C.R., 2015. Remote sensing of drought: Progress, challenges and opportunities. Reviews of Geophysics, 53 (2): 452–480
Bhardwaj K., Shah D., Aadhar S., Mishra, 2020. Propagation of meteorological to hydrological droughts in India. Journal of Geophysical Research: Atmospheres, 125(22): e2020JD03345.
BMKG., 2023. Seasonal Climate Outlook. Indonesian Agency for Meteorology, Climatology, and Geophysics. https://www.bmkg.go.id
Boer R., Surmaini E., 2020. Economic benefits of ENSO information in crop management decisions: case study of rice farming in West Java, Indonesia. Theoretical and applied climatology, 139(3–4): 1435–1446.
BPS [Statistics Indonesia] (2024). Statistical Yearbook of Indonesia 2024 vol 52. BPS-Statistic Indonesia. 801p.
Chen Y., Wang Y., Wu C., Maniçoba A., Jardim R.F., Fang M., Yao L., Liu G., Xu Q., Chen L., Tang X., 2025. Drought-induced stress on rainfed and irrigated agriculture: Insights from multi-source satellite-derived ecological indicators. Agricultural Water Management, 37: 109249
D’Arrigo R.D., Wilson R., 2008. El Niño and Indian Ocean influences on indonesian drought : implication for forecasting rainfall and crop productivity. International Journal of Climatology, 28: 611–616.
Dai M., Huang S., Huang Q., Leng G., Guo Y., Wang L., Fang W., Li P., Zheng X., 2020. Assessing agricultural drought risk and its dynamic evolution characteristics. Agricultural Water Management, 231:1-12.
de Oliveira J.C., Epiphanio J.C.N., 2012. Noise reduction in MODIS NDVI time series data based on spatial-temporal analysis. In Proceeding of 2012 IEEE International Geoscience and Remote Sensing Symposium ( pp. 2372-2375).
ECMWF., 2023. SEAS5: ECMWF Seasonal Forecasting System. European Centre for Medium-Range Weather Forecasts. https://www.ecmwf.int
FAO., 2012. Coping with water scarcity An action framework for agriculture and food security. FAO Water Reports. Food and Agriculture Organization of the United Nations. Viale delle Terme di Caracalla 00100 Rome, Italy
Forootan E., Khaki M., Schumacher M., Wulfmeyer V., Mehrnegar N., van Dijk A., et.al., 2019. Understanding the global hydrological droughts of 2003-2016 and their relationships with teleconnections. Science Total Environment, 650 (2): 2587–2604.
Gebrehiwot T., van der Veen A., Maathuis B., 2011. Spatial and temporal assessment of drought in the Northern highlands of Ethiopia. International Journal Applied Earth Observation, 13 (3): 309–321.
GDO., 2024. Global Drought Observatory. European Commission, Joint Research Centre. https://edo.jrc.ec.europa.eu/gdo
Hao Z., Singh V.P., 2015. Drought characterization from a multivariate perspective: A review. Journal of Hydrology, 527: 668–678.
He L., Tong L., Zhou Z., Gao T., Ding Y., Ding Y., Zhao Y., Fan W., 2022. A Drought Index: The Standardized Precipitation Evapotranspiration Irrigation Index. Water, 14(13): 2133.
Hendrawan V. S. A., Komori K., Kim W., 2023. Possible factors determining global-scale patterns of crop yield sensitivity to drought. PLoS ONE 18(2): e0281287
Hoogenboom G., Porter C.H., Shelia V., Boote K.J., Singh U., Pavan W., Oliveira F.A.A, Moreno-Cadena L.P., et al., 2023. Decision support system for sgrotechnology transfer (DSSAT) Version 4.8.2 (www.DSSAT.net). DSSAT Foundation, Gainesville, Florida, USA.
Jones J.W., Hoogenboom G., Porter C.H., Boote K.J. Batchelor W.D., Hunt L.A, Wilkens P.W., Singh U., Gijsman A.J., Ritchie, J.T., 2003. The DSSAT cropping system model. European Journal of Agronomi, 18: 235-265.
Lee S.J., Kim N., Lee Y.N., 2021. Development of integrated crop drought index by combining rainfall, land surface temperature, evapotranspiration, soil moisture, and vegetation index for agricultural drought monitoring. Remote Sensing 13(9): 1778.
Leng G., Hall J., 2019. Crop yield sensitivity of global major agricultural countries to droughts and the projected changes in the future. Science of The Total Environment Journal, 654: 811–821.
Li Q., Ye A., Wada Y., Zhang Y., Zhou J., 2024. Climate change leads to an expansion of global drought-sensitive area. Journal of Hydrology, 632: 1-9.
Mason I.B., 2012. Binary events. İn Jolliffe, I. T. and Stephenson, D.B (Eds). A practitioner’s guide in atmospheric science (2 nd Edition). Oxford. Wiley & Blackwell.
McKee T.B., Doesken N.J., Kleist J., 1993. The relationship of drought frequency and duration to time-scale. In: Proceeding of The Eighth Conference on Applied Climatology 17-22 January 1993 Anaheim, California (Fort Collins: Colorado State University) p 6.
Mishra A.K., Singh V.P., 2010. A review of drought concepts. Journal of Hydrology, 391(1-2): 202-216.
Mohseni F., Sadr M.K., Eslamian S., Areffian A., Khoshfetrat A., 2021. Spatial and temporal monitoring of drought conditions using the satellite rainfall estimates and remote sensing optical and thermal measurements. Advances in Space Research, 67(12): 3942-3959.
Nanzad L., Zhang J., Tuvdendorj B., Nabil M., Zhang S., Bai Y., 2019. NDVI anomaly for drought 611 monitoring and its correlation with climate factors over Mongolia from 2000 to 2016. Journal of Arid Environment. 164 : 69–77
Naylor R.L., Battisti D.S., Vimont D.J., Falcon W.P., Burke, M.B., 2007. Assessing risks of climate variability and climate change for Indonesian rice agriculture. PNAS, 104(19): 7752–7757.
NOAA., 2024. Climate Prediction Center: Seasonal Climate Outlooks. National Oceanic and Atmospheric Administration. https://www.cpc.ncep.noaa.gov
Nurmi P., 2003. Recommendations on the verification of local weather forecasts. ECMWF Operations Department. 18p.
Pei Z., Fang S., Wang L., WangW., 2020. Comparative analysis of drought ındicated by the spı and speı at various timescales in ınner Mongolia, China. Water, 12: 925.
Prabnakorn S., Maskey S., Suryadi F.X., de Fraiture C., 2018. Rice yield in response to climate trends and drought index in the Mun River Basin, Thailand. Science Total Environment, 621: 108–119.
Purnamasari D., Teuling A.J., Weerts A.H., 2025. Identifying irrigated areas using land surface temperature and hydrological modelling: application to the Rhine basin. Hydrology and Earth System Sciences, 29: 1483–1503.
Rejekiningrum P., Apriyana Y., Sutardi, Estiningtyas W., Sosiawan H., Susilawati H.L., Hervani A., Alifia A.D., 2022. Optimising water management in drylands to increase crop productivity and anticipate climate change in Indonesia. Sustainability, 14: 11672.
Thapa S., Rudd J.C., Xue Q., Bhandari M., Reddy S. K., Jessup K.E., Liu S., Devkota R.N., Baker J., Baker, S., 2019. Use of NDVI for characterizing winter wheat response to water stress in a semi-arid environment. Journal of Crop Improvement, 33(5): 633–648.
Tsige D,T., Uddameri V., Forghanparast F., Hernandez E.A., Ekwaro-Osire S., 2019. Comparison of meteorologicaland agriculture-related drought indicators across Ethiopia. Water, 11:(11).
Ray D. K., Gerber J.S., MacDonald G.K., West P.C., 2015. Climate variation explains a third of global crop yield variability. Nature Communications. 6: 5989 https://doi.org/10.1038/ncomms6989
Rembold F., Meroni M., Urbano F., Csak G., Kerdiles H., Perez-Hoyos L.G., Leo O., Negre T., 2019. ASAP: A new global early warning system to detect anomaly hot spots of agricultural production for food security analysis, Agricultural Systems, 168 : 247–257.
Rojas O., Vrieling A., Rembold F., 2011. Assessing drought probability for agricultural areas in Africa with coarse resolution remote sensing imagery. Sensing of Environment, 115: 343–352.
Satapathy T., Dietrich J., Ramadas M., 2024. Agricultural drought monitoring and early warning at the regional scale using a remote sensing-based combined index. Environment Monitoring Assessment, 196: 1132.
Siswanto S., Wardani K.K., Purbantoro B., Rustanto A., Zulkarnain F., Anggraheni E., Dewanti R., Nurlambang T., Dimyati M., 2022. Satellite-based meteorological drought indicator to support food security in Java Island. PLoS ONE, 17(6): e0260982.
Sunusi N., Auliana N.H., Jaya A.K., Siswanto, Herdian E.T., 2024. Mapping Meteorological Drought Periods in South Sulawesi Using the Standardized Precipitation Index with the Power Law Process Model. Journal of Environmental & Earth Sciences, 7(1): 438–456.
Surmaini E., Hadi T.W., Subagyono K., Puspito N.T., 2015. Early detection of drought impact on rice paddies in Indonesia by means of Niño 3.4 index. Theoriacl Applied Climatology, 121 (3–4): 669–684.
Surmaini E., Susanti E., Syahputra M.R., Hadi T.W., 2019. Exploring Standardized Precipitation Index for predicting drought on rice paddies in Indonesia. IOP Conference Series: Earth and Environmental Science, 303(1):012027
Surmaini E., Ramadhani F., Syahputra M.R., Dewi, E.R., Apriyana Y., 2020. Development of a paddy drought hazard forecasting system to cope with the impact of climate change. IOP Conf. Series: Earth and Environmental Science. 484: 012050
Wilks D. S., 2019. Statistical Methods in the Atmospheric Sciences (4th ed.). Amsterdam. Elsevier.
Wu B., Ma Z., Yan N., 2020. Agricultural drought mitigating indices derived from the changes in drought characteristics. Remote Sensing Environment, 244: 111813.
Xiao C., Zaehle S.,Yang H., Wigneron J.P., Schmullius C., Basto A., 2023. Land cover and management effects on ecosystem resistance to drought stress. Earth System Dynamics, 14: 1211–1237.
Xu Z., Wu Z., Shao, Q., He H., Guo X., 2023. From meteorological to agricultural drought: Propagation time and probabilistic linkages. Journal of Hydrology: Regional Studies, 46.
Yang Z., Huang Y., Duan Z., Tang J., 2023. Capturing the spatiotemporal variations in the gross primary productivity in coastal wetlands by integrating eddy covariance, Landsat, and MODIS satellite data: A case study in the Yangtze Estuary, China. Ecological Indicators, 149: 110154.
Zargar A., Sadiq R., Naser B., Khan F. I. 2011. A review of drought indices. Environmental Reviews, 19: 333–349.
Zhang J., Mu Q., Huang J., 2016. Assessing the remotely sensed Drought Severity Index for agricultural drought monitoring and impact analysis in North China. Ecological Indicators, 63: 296-309.
Zinat M.R.M., Salam R., Badhan M.A., Islam A.R.M.T., 2020. Appraising drought hazard during Boro rice growing period in western Bangladesh. International Journal of Biometeorology, 64(10): 1687–1697.
Zipper S.C., Qiu J., Kucharik C.J., 2016. Drought effects on US maize and soybean production: Spatiotemporal patterns and historical changes. Environmental Research Letters, 11: 094021.
Zhou S., Yu B., Zhang Y., 2023. Global concurrent climate extremes exacerbated by anthropogenic climate change. Science Advances, 9 (10): eabo1638.