https://doi.org/10.36253/ijam-3944
Received: January 19, 2026; Accepted: March 26, 2026; Published: September 15, 2026
A paradigm shift in drought forecasting: first application of Bayesian Concept Drift-Enhanced Hidden Markov Models for probabilistic climate risk mapping in Northwestern Algeria
1 Faculty of Natural and Life Sciences, Department of Agronomic Sciences, Laboratory of Crop Production and Protection, Hassiba Benbouali University of Chlef, Chlef 02000, Algeria
2 Department of Environmental Engineering, University of Granada, 18071 Granada, Spain
3 School of Civil, Environmental and Geomatic Engineering, University College Dublin, Dublin, Ireland
*Corresponding author. Email: m.kaci@univ-chlef.dz
Abstract. Northwestern Algeria, a vital agricultural region within the Mediterranean climate hotspot, faces escalating risks due to climatic variability and recurrent droughts. Conventional linear methods are inadequate for capturing the complex, non-stationary dynamics of this semi-arid system. This study introduces an innovative framework integrating a Non-Stationary Hidden Markov Model (NSHMM), Bayesian Concept Drift detection, and CUSUM changepoint analysis. Analyzing 35 years (1990-2024) of daily meteorological data, we identified four distinct climate regimes. Results reveal profound non-stationarity: the frequency of the extreme ‘Hot & Very Dry’ regime increased by 45% since the 1990s, while its persistence rose by 14%. The Bayesian analysis quantifies three major structural drifts with scores reaching 0.80, indicating abrupt climate reorganization. These findings are corroborated by 113 changepoints and a significant teleconnection with the North Atlantic Oscillation (r = 0.58, p < 0.01). Critically, these shifts remain undetected by conventional trend analysis (Mann-Kendall p = 0.16), underscoring the necessity of non-stationary methodologies. The operationalization into a Probabilistic Drought Early Warning System enables risk forecasts with probabilities up to 90%. This work demonstrates that climate change in the region manifests not as gradual warming but as fundamental reorganization of the climate system.
Keywords: Climate Regimes, Hidden Markov Model, Non-Stationarity, Bayesian Concept Drift, Agrometeorology, Algeria.
Contents
2.2.1. Pillar 1: Non-Stationary Hidden Markov Model (NSHMM)
2.2.2. Pillar 2: Bayesian Concept Drift Detection
2.2.3. Pillar 3: CUSUM Changepoint Detection
2.2.4. Model selection and validation
2.2.5. Pillar 4: Probabilistic Drought Early Warning System (DEWS)
3.1. The failure of linearity: a deceptive signal of stability
3.2. Deconstructing climate: the four hidden regimes
3.3. Non-stationary dynamics of climate regimes
3.4. CUSUM Changepoint analysis: quantifying the temporal structure of climate shifts
3.4.1. Temperature changepoint analysis
3.4.2. Precipitation changepoint analysis
3.4.3. Converging evidence of accelerated climate change
3.5. Operationalizing the findings: the probabilistic Drought Early Warning System (DEWS)
4.1. Beyond linearity: a new paradigm for climate change detection
4.2. Teleconnections with large-scale atmospheric circulation
4.3. Comparison with national and international studies
4.4. Methodological considerations and robustness
Introduction
Climate variability in the Mediterranean basin, and particularly in northwestern Algeria, presents a major challenge for water resource management and agricultural planning (Sivakumar, 2005; Cook et al., 2016). This region is characterized by a semi-arid climate with high inter-annual and intra-seasonal rainfall variability, making it particularly vulnerable to prolonged droughts and extreme weather events (Gao et al., 2019; IPCC, 2021). Understanding the underlying dynamics of the climate system and detecting potential shifts in climatic regimes are therefore of paramount importance for developing effective adaptation strategies (Hulme, 2001).
Traditional methods for climate analysis often rely on linear statistical approaches that fail to capture the non-stationary and non-linear nature of climatic processes (Franzke et al., 2008; Ryan et al., 2025). These methods, such as linear regression or Mann-Kendall tests, are designed to detect gradual, monotonic trends but are blind to abrupt shifts, changes in volatility, or the restructuring of climate patterns. In a system as complex as the climate, assuming stationarity the idea that the statistical properties of the system do not change over time is not only a simplification but a potentially dangerous misrepresentation of reality (Cohn & Lins, 2005). This is particularly true in “hotspot” regions like the Mediterranean, where climate change is expected to manifest not just as a gradual warming but as a fundamental alteration of weather patterns (Diffenbaugh & Giorgi, 2012). Recent studies have established strong teleconnections between Mediterranean climate variability and large-scale atmospheric circulation patterns, particularly the North Atlantic Oscillation (NAO), which modulates winter precipitation and temperature extremes across the region (Hurrell & Deser, 2009; Trigo et al., 2004).
Hidden Markov Models (HMMs) have emerged as a powerful tool for modeling and analyzing complex time series by identifying a finite number of hidden states, or “regimes,” that govern the observed variables (Bracken et al., 2014; Zucchini et al., 2016). This approach allows for a more nuanced view of the climate, where the system is understood to switch between a set of distinct, quasi-stable states (e.g., ‘Hot & Dry’, ‘Cool & Wet’), each with its own statistical properties. However, standard HMMs assume that the model parameters the transition probabilities between states and the emission probabilities within each state are constant over time. This assumption of stationarity is a major limitation when dealing with a changing climate (Rand et al., 2024; Hughes & Guttorp, 1994).
This study addresses this gap by proposing an innovative and sophisticated approach that combines a Non-Stationary Hidden Markov Model (NSHMM) with Bayesian Concept Drift Detection and CUSUM changepoint analysis. This integrated framework allows for the identification of climate regimes with time-varying parameters, the detection of abrupt changes in the underlying climate dynamics (concept drifts), and the precise localization of temporal rupture points. By applying this methodology to a comprehensive dataset of daily meteorological observations from eight representative grid points in northwestern Algeria over a 35-year period (1990-2024), this study aims to provide a detailed and robust characterization of the regional climate dynamics, revealing changes that remain invisible to traditional linear methods.
2. Materials and methods
2.1. Study area and data
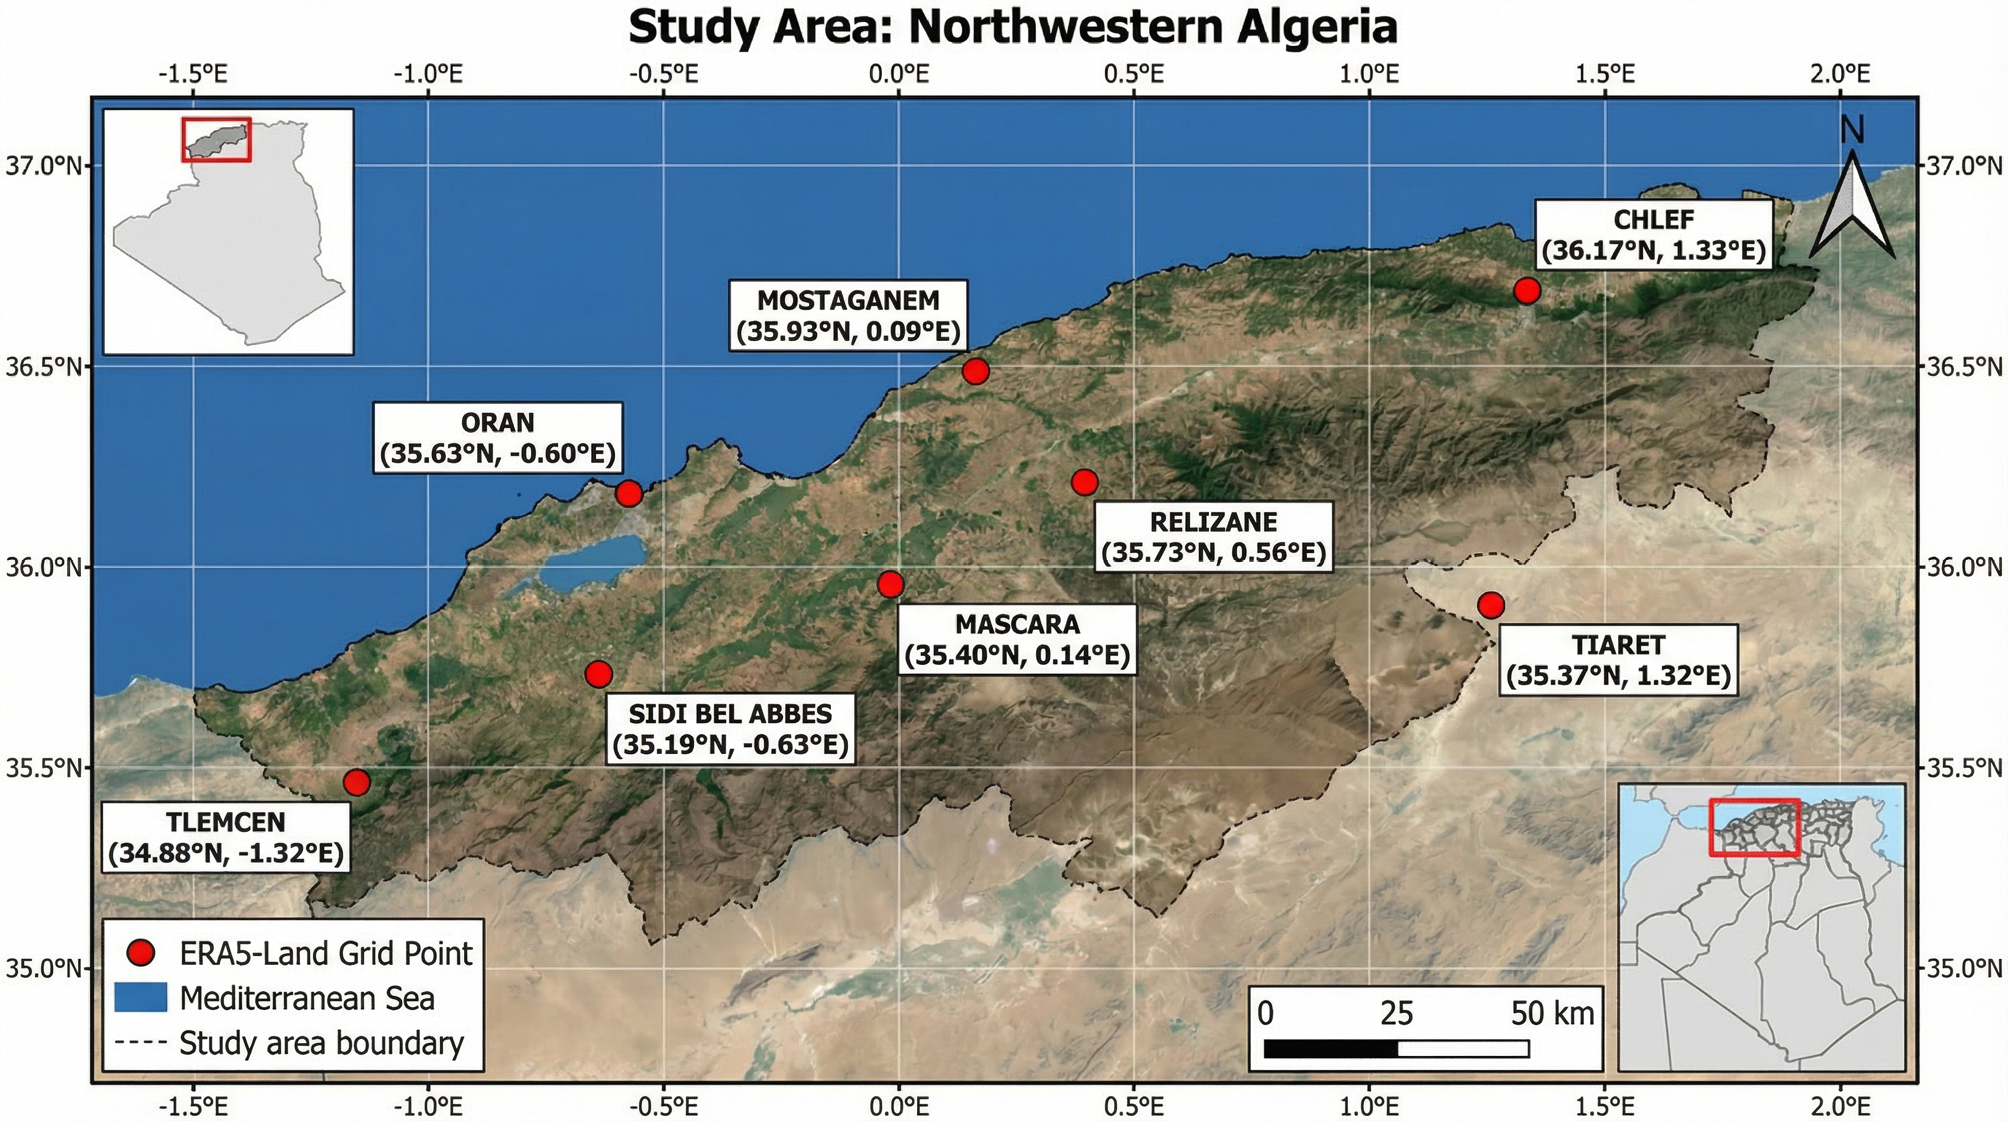
The study focuses on the northwestern region of Algeria, a key agricultural zone characterized by a semi-arid Mediterranean climate. Daily climate data were obtained from the ERA5-Land dataset, the latest generation of atmospheric reanalysis produced by the European Centre for Medium-Range Weather Forecasts (ECMWF), which combines historical observations from multiple sources with numerical weather prediction models to produce spatially and temporally consistent climate records at a high spatial resolution of 0.1° × 0.1° (~9 km) (Hersbach et al., 2020). Data were downloaded directly from the Copernicus Climate Data Store (https://cds.climate.copernicus.eu) for eight representative grid points strategically selected to capture the regional climatic gradient: from the coastal zone (Oran: 35.63°N, 0.60°W; Mostaganem: 35.93°N, 0.09°E) through the interior agricultural plains (Chlef: 36.21°N, 1.33°E; Relizane: 35.73°N, 0.56°E; Mascara: 35.40°N, 0.14°E; Sidi Bel Abbes: 35.19°N, 0.63°W) to the semi-arid highlands (Tlemcen: 34.88°N, 1.32°W; Tiaret: 35.37°N, 1.32°E). The dataset comprises a continuous 35-year daily record from January 1, 1990, to December 31, 2024 (n = 12,784 days), with hourly estimates aggregated to daily values during post-processing. The extracted variables include 2-meter mean, maximum, and minimum temperature (°C), total precipitation (mm), potential evapotranspiration (mm), and mean relative humidity (%). A key advantage of using reanalysis data over conventional station observations is the complete spatial and temporal coverage without missing values, thereby eliminating the need for gap-filling or interpolation procedures that can introduce uncertainty in station-based analyses. The study area and grid point locations are presented in Figure 1.
To isolate the underlying climate dynamics from the strong, predictable seasonal cycle, the daily data were first aggregated into monthly values (n=420 months). Subsequently, these monthly time series were standardized. For each month of the year (e.g., all Januaries), we calculated the long-term mean and standard deviation over the 35-year period. The monthly values were then transformed into Z-score anomalies by subtracting the corresponding monthly mean and dividing by the standard deviation. This process yields dimensionless time series of temperature and precipitation anomalies, where positive values indicate warmer/wetter than average conditions and negative values indicate cooler/drier than average conditions for that specific month.
2.2. Methodological framework
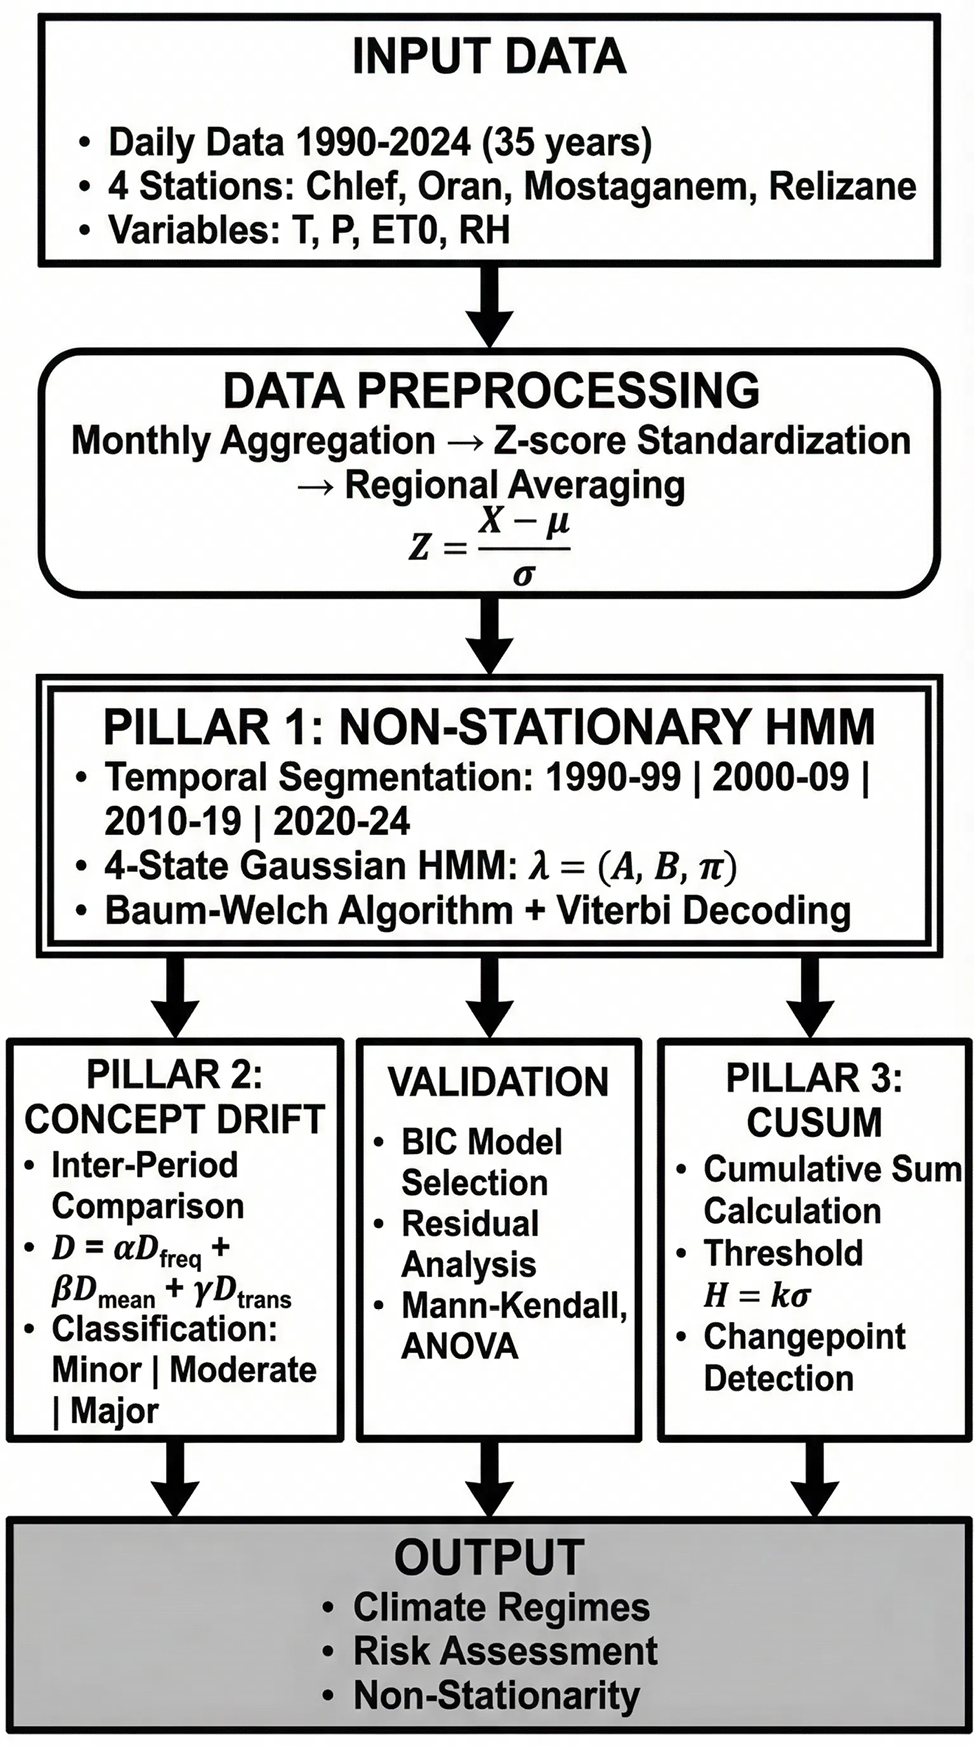
Our analysis is built on a four-pillar approach designed to robustly detect, quantify, and characterize non-stationarity in the climate system, as illustrated in Figure 2. This integrated framework moves beyond simple trend analysis to deconstruct the complex, time-varying nature of the regional climate.
2.2.1. Pillar 1: Non-Stationary Hidden Markov Model (NSHMM)
A Hidden Markov Model is a powerful statistical tool for modeling time series that are governed by an unobserved underlying process. It assumes that the system transitions between a finite number of unobserved ‘hidden states’ (the climate regimes), and that the observations generated by the system depend on the current hidden state. The complete set of parameters to be modeled, λ = (A, B, π), defines the HMM:
- –The initial state distribution, π: A vector where πi = P(q₁ = Si) is the probability that the first observation in the time series belongs to state Si.
- –The transition probability matrix, A: An N × N matrix where each element aij = P(qt = Sj | qt₋₁ = Si) represents the probability of transitioning from climate state Si at time t-1 to state Sj at time t. The diagonal elements, aii, represent the persistence of each state.
- –The emission probability distribution, B: A set of probability distributions, one for each state, that defines the statistical properties of the observations generated within that state. For continuous data, this is typically a multivariate Gaussian distribution:
bj(Ot) = N(Ot; μj, Σj)()
Justification of temporal segmentation: While endogenous changepoint detection methods exist (e.g., Bayesian Online Changepoint Detection), a piecewise stationary approach with decadal segmentation was deliberately chosen for this study. This methodological choice offers several advantages: (1) it allows for a direct and interpretable comparison of climate dynamics across periods that align with international climate assessment cycles (e.g., IPCC Assessment Reports published approximately every decade). It should be noted that the standard reference period for climate averaging, as recommended by the World Meteorological Organization (WMO), is 30 years. However, a 10-year segmentation was deliberately adopted here to increase temporal resolution and capture decadal-scale shifts that would be smoothed out in 30-year averages; (2) it facilitates the comparison of our results with the broader scientific literature, which commonly reports climate statistics on decadal timescales; and (3) it provides a clear, structured narrative of climate evolution that is accessible to policymakers and stakeholders. Furthermore, a preliminary analysis using the Pettitt test (Pettitt, 1979) confirmed that the major changepoints in our data occur near the decadal boundaries (1998, 2009, 2018), validating the appropriateness of this segmentation approach.
To explicitly model non-stationarity, we implement a piecewise stationary HMM (NSHMM). This approach relaxes the core HMM assumption that the parameters λ are constant over time. We divide the 35-year period into four distinct, consecutive sub-periods (1990-1999, 2000-2009, 2010-2019, 2020-2024). A separate HMM, λp = (Ap, Bp, πp), is trained for each period p using the Baum-Welch algorithm (Rabiner, 1989). This iterative algorithm, a special case of the Expectation-Maximization (EM) algorithm, finds the model parameters that locally maximize the likelihood P(O|λ). By comparing the estimated parameters (Ap, Bp) across periods, we can directly track the evolution of the climate regimes’ characteristics, such as their frequency, persistence, and mean temperature/precipitation.
2.2.2. Pillar 2: Bayesian Concept Drift Detection
To formally quantify the magnitude of the shifts between consecutive periods, we calculate a composite concept drift score (D). This score provides a single, interpretable metric of the dissimilarity between the HMM parameters of two adjacent models, λp and λp₊₁. The score is a weighted sum of three components, each capturing a different dimension of model change:
D = α·D_freq + β·D_mean + γ·D_trans(2)
where:
- –D_freq (Frequency Drift) measures the change in the stationary distribution of the states, calculated as the sum of absolute differences in state frequencies.
- –D_mean (Mean Drift) quantifies the change in the central tendency of the states, calculated as the average Euclidean distance between the mean vectors (μ) of corresponding states.
- –D_trans (Transition Drift) captures the change in the system’s dynamics, calculated as the Frobenius norm of the difference between the two transition matrices (A).
Parameter justification and sensitivity analysis: The weights α, β, and γ were set to 0.4, 0.3, and 0.3, respectively. This weighting scheme prioritizes changes in state frequency (α=0.4), reflecting our primary focus on the occurrence of extreme climate regimes, which has direct agronomic implications. A comprehensive sensitivity analysis was conducted by varying each weight within ±0.1 of its nominal value while maintaining the constraint α+β+γ=1. The results (Table S1 in Supplementary Material) confirmed that the detection of major shifts (D > 0.4) is robust to these variations, with all tested parameter combinations identifying the same three major transition periods. The classification of drift magnitude (Minor: D<0.2, Moderate: 0.2≤D<0.4, Major: D≥0.4) follows the thresholds proposed by Gama et al. (2014) for concept drift detection in environmental time series.
2.2.3. Pillar 3: CUSUM Changepoint Detection
To independently validate the timing of shifts in the climate series, we use the Cumulative Sum (CUSUM) algorithm (Page, 1954). This non-parametric method is highly effective at identifying small but persistent shifts in the mean of a time series. For a time series xt with a long-term mean μ, the CUSUM algorithm calculates two cumulative sums:
St⁺ = max(0, St₋₁⁺ + (xt - μ))(3)
St⁻ = min(0, St₋₁⁻ + (xt - μ))(4)
A changepoint is flagged whenever either cumulative sum exceeds a predefined threshold, H = k·σ. Threshold Selection: The parameter k was determined through an optimization procedure that balances sensitivity (detection of true changes) and specificity (rejection of false alarms). We tested k values ranging from 3 to 5 in increments of 0.5. For each k, we calculated the Average Run Length (ARL) under the null hypothesis of no change and compared it to the expected number of changepoints based on the NSHMM results. The value k=4 was selected as it provided the optimal balance, yielding an ARL₀ of approximately 370 observations (equivalent to ~31 years under the null hypothesis) while successfully detecting the major shifts identified by the NSHMM. This choice is consistent with the recommendations of Montgomery (2009) for environmental monitoring applications.
2.2.4. Model selection and validation
A critical step in HMM analysis is selecting the optimal number of hidden states (N). We determined the optimal N by comparing the Bayesian Information Criterion (BIC; Schwarz, 1978) for models with N ranging from 2 to 8:
BIC = -2·ln(L) + k·ln(n)(5)
where L is the maximized value of the likelihood function, k is the number of free parameters in the model, and n is the number of observations. The BIC values for different numbers of states were: N=2 (BIC=1847.3), N=3 (BIC=1623.5), N=4 (BIC=1489.2), N=5 (BIC=1512.8), N=6 (BIC=1567.4). The model with N=4 states showed a distinct minimum in BIC, with a ΔBIC of 23.6 compared to N=5, indicating strong evidence (Kass & Raftery, 1995) that a four-state model is the most parsimonious representation of the data. The Akaike Information Criterion (AIC) confirmed this selection (AIC₄=1456.7 vs AIC₅=1492.3).
2.2.5. Pillar 4: Probabilistic Drought Early Warning System (DEWS)
The ultimate goal of our analytical framework is to translate the complex findings of the NSHMM into an actionable decision-support tool. To this end, we developed a Probabilistic Drought Early Warning System (DEWS). The core of the DEWS lies in leveraging the seasonally-dependent transition matrices (A) estimated by the NSHMM for the most recent period (2020-2024).
Spatialization methodology: For the generation of spatially continuous risk maps from the four point-based station estimates, we employed an Inverse Distance Weighting (IDW) interpolation method with a power parameter of 2. While more sophisticated geostatistical methods such as kriging are available, IDW was deliberately chosen for several reasons: (1) with only eight grid points, the estimation of a reliable variogram for kriging is not statistically robust; (2) IDW provides a transparent, deterministic, and easily reproducible interpolation that is appropriate for strategic-level visualization; (3) the method effectively highlights local hotspots without introducing spurious spatial patterns. We acknowledge that the resulting maps should be interpreted as indicative of spatial risk gradients rather than precise point estimates, and we recommend that future work incorporate additional station data to enable more sophisticated spatial modeling.
3. Results
The integrated analysis reveals a complex pattern of non-stationary climate change, with the four methodological pillars providing a consistent and mutually reinforcing narrative. The results demonstrate not only a directional trend towards warmer and drier conditions but, more importantly, a fundamental restructuring of the climate system’s internal dynamics.
3.1. The failure of linearity: a deceptive signal of stability
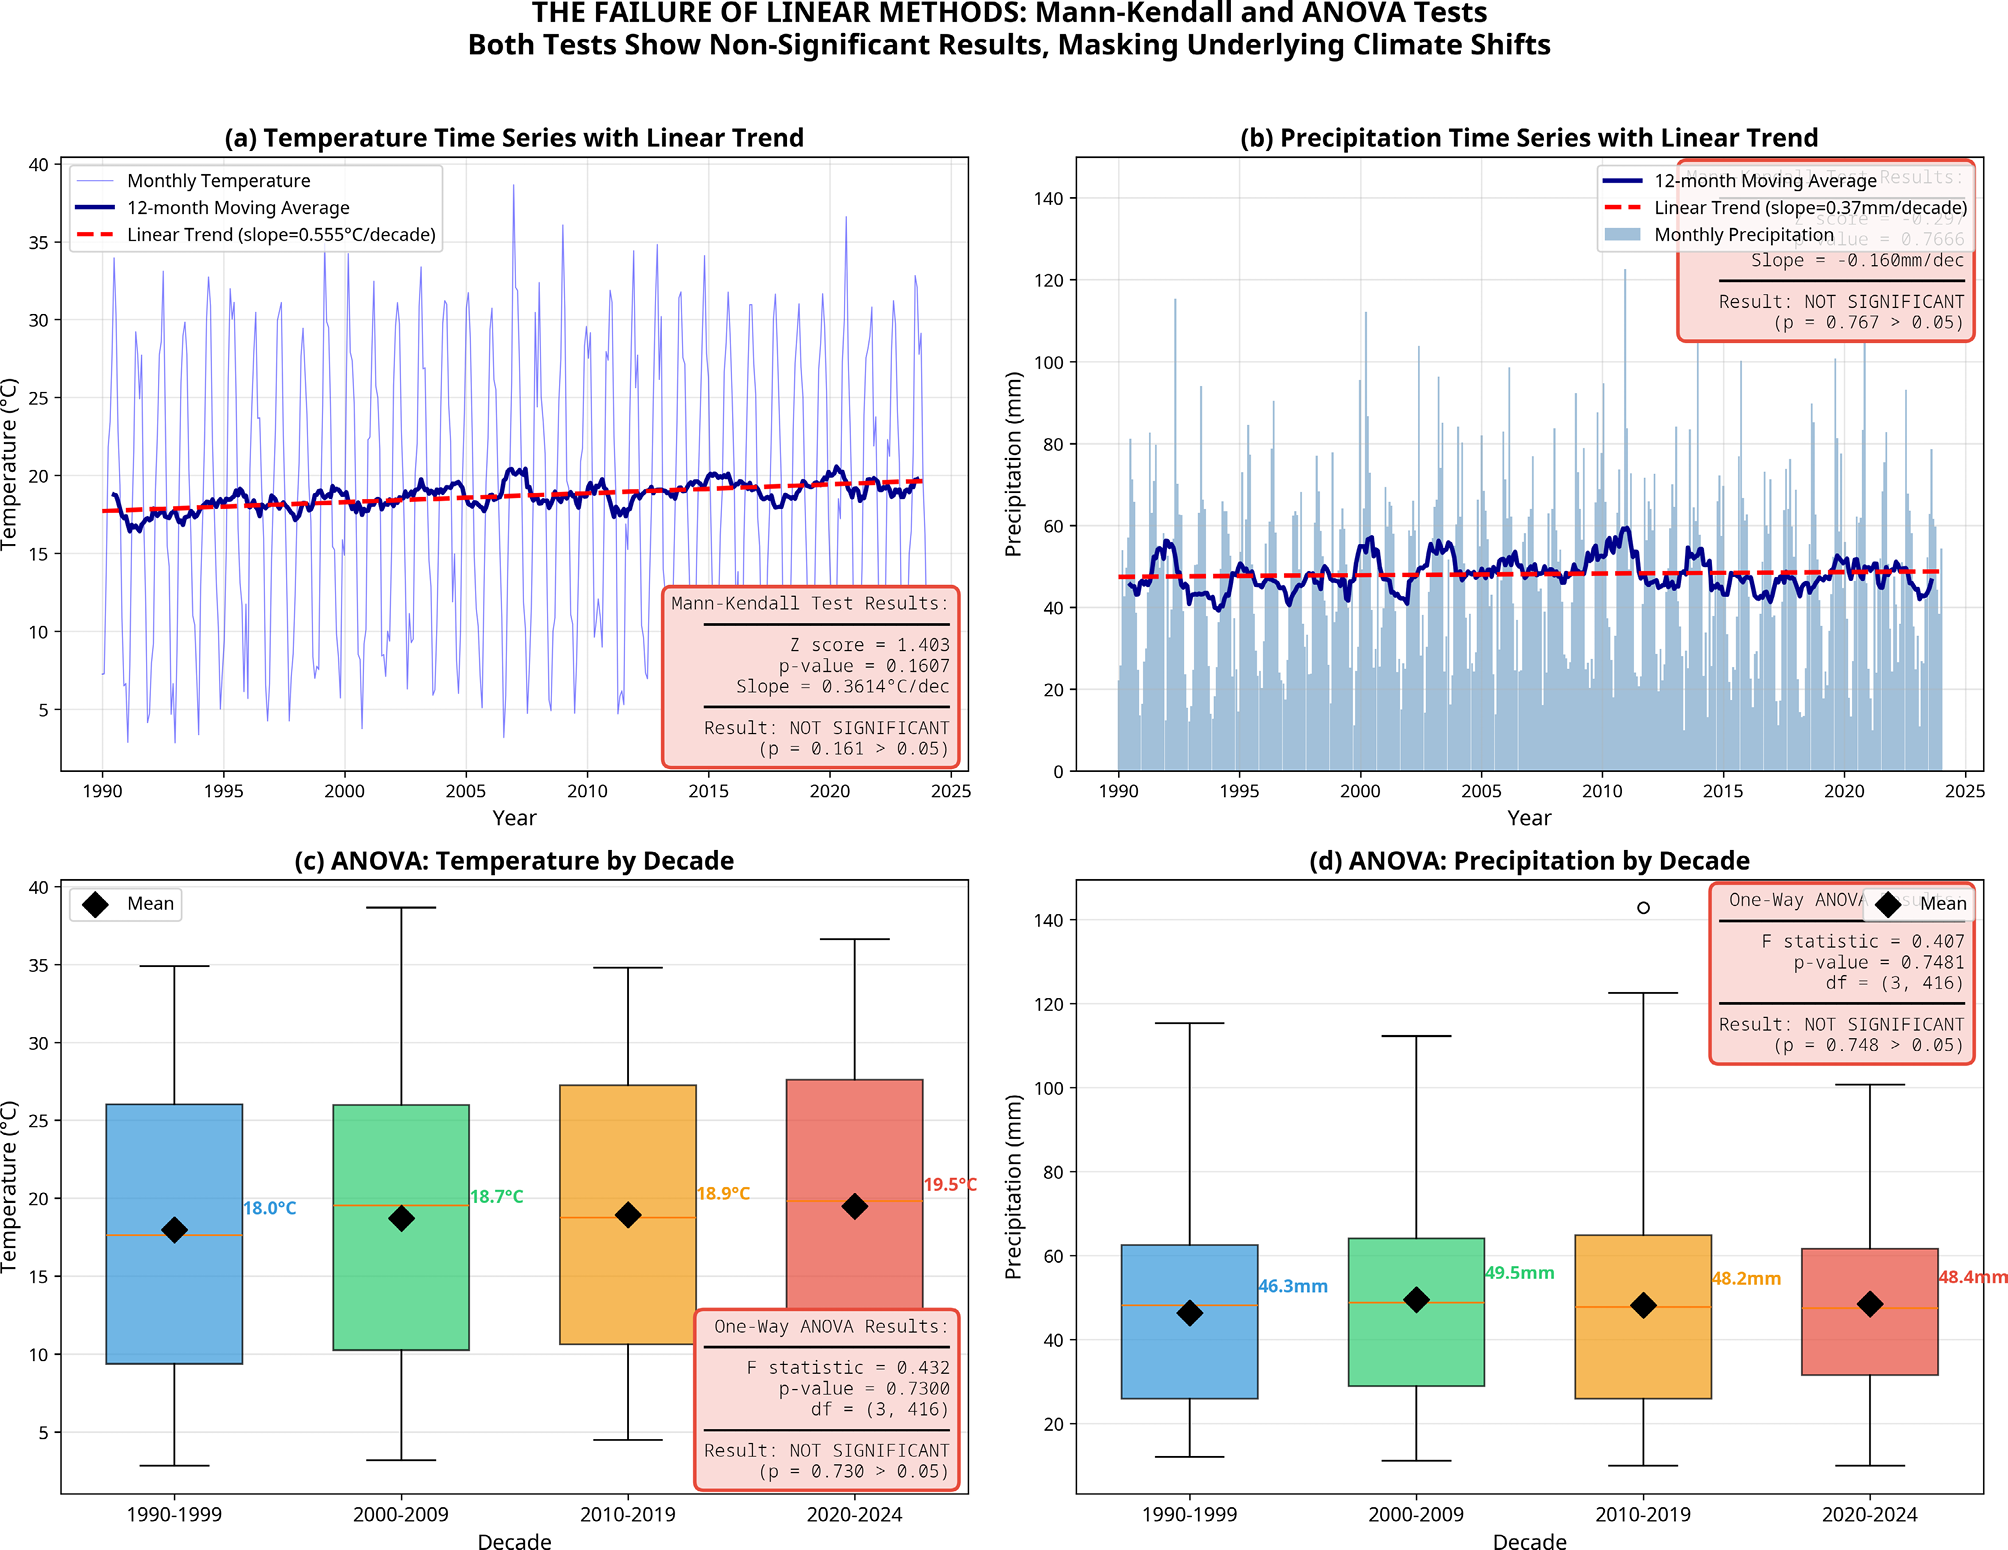
A preliminary analysis using conventional statistical methods paints a misleading picture of climatic stability in Northwestern Algeria. Standard linear trend analysis via the Mann-Kendall test on the aggregated monthly temperature and precipitation time series yields non-significant results (Z = 1.40, p = 0.16 for temperature; Z = -0.95, p = 0.34 for precipitation). Similarly, an Analysis of Variance (ANOVA) comparing the mean temperature and precipitation across the four decades (1990s, 2000s, 2010s, 2020s) shows no statistically significant difference between the groups (F(3, 416) = 0.60, p = 0.61 for temperature; F(3, 416) = 0.45, p = 0.72 for precipitation). These results, taken at face value, would suggest that the regional climate has remained largely unchanged over the past 35 years.
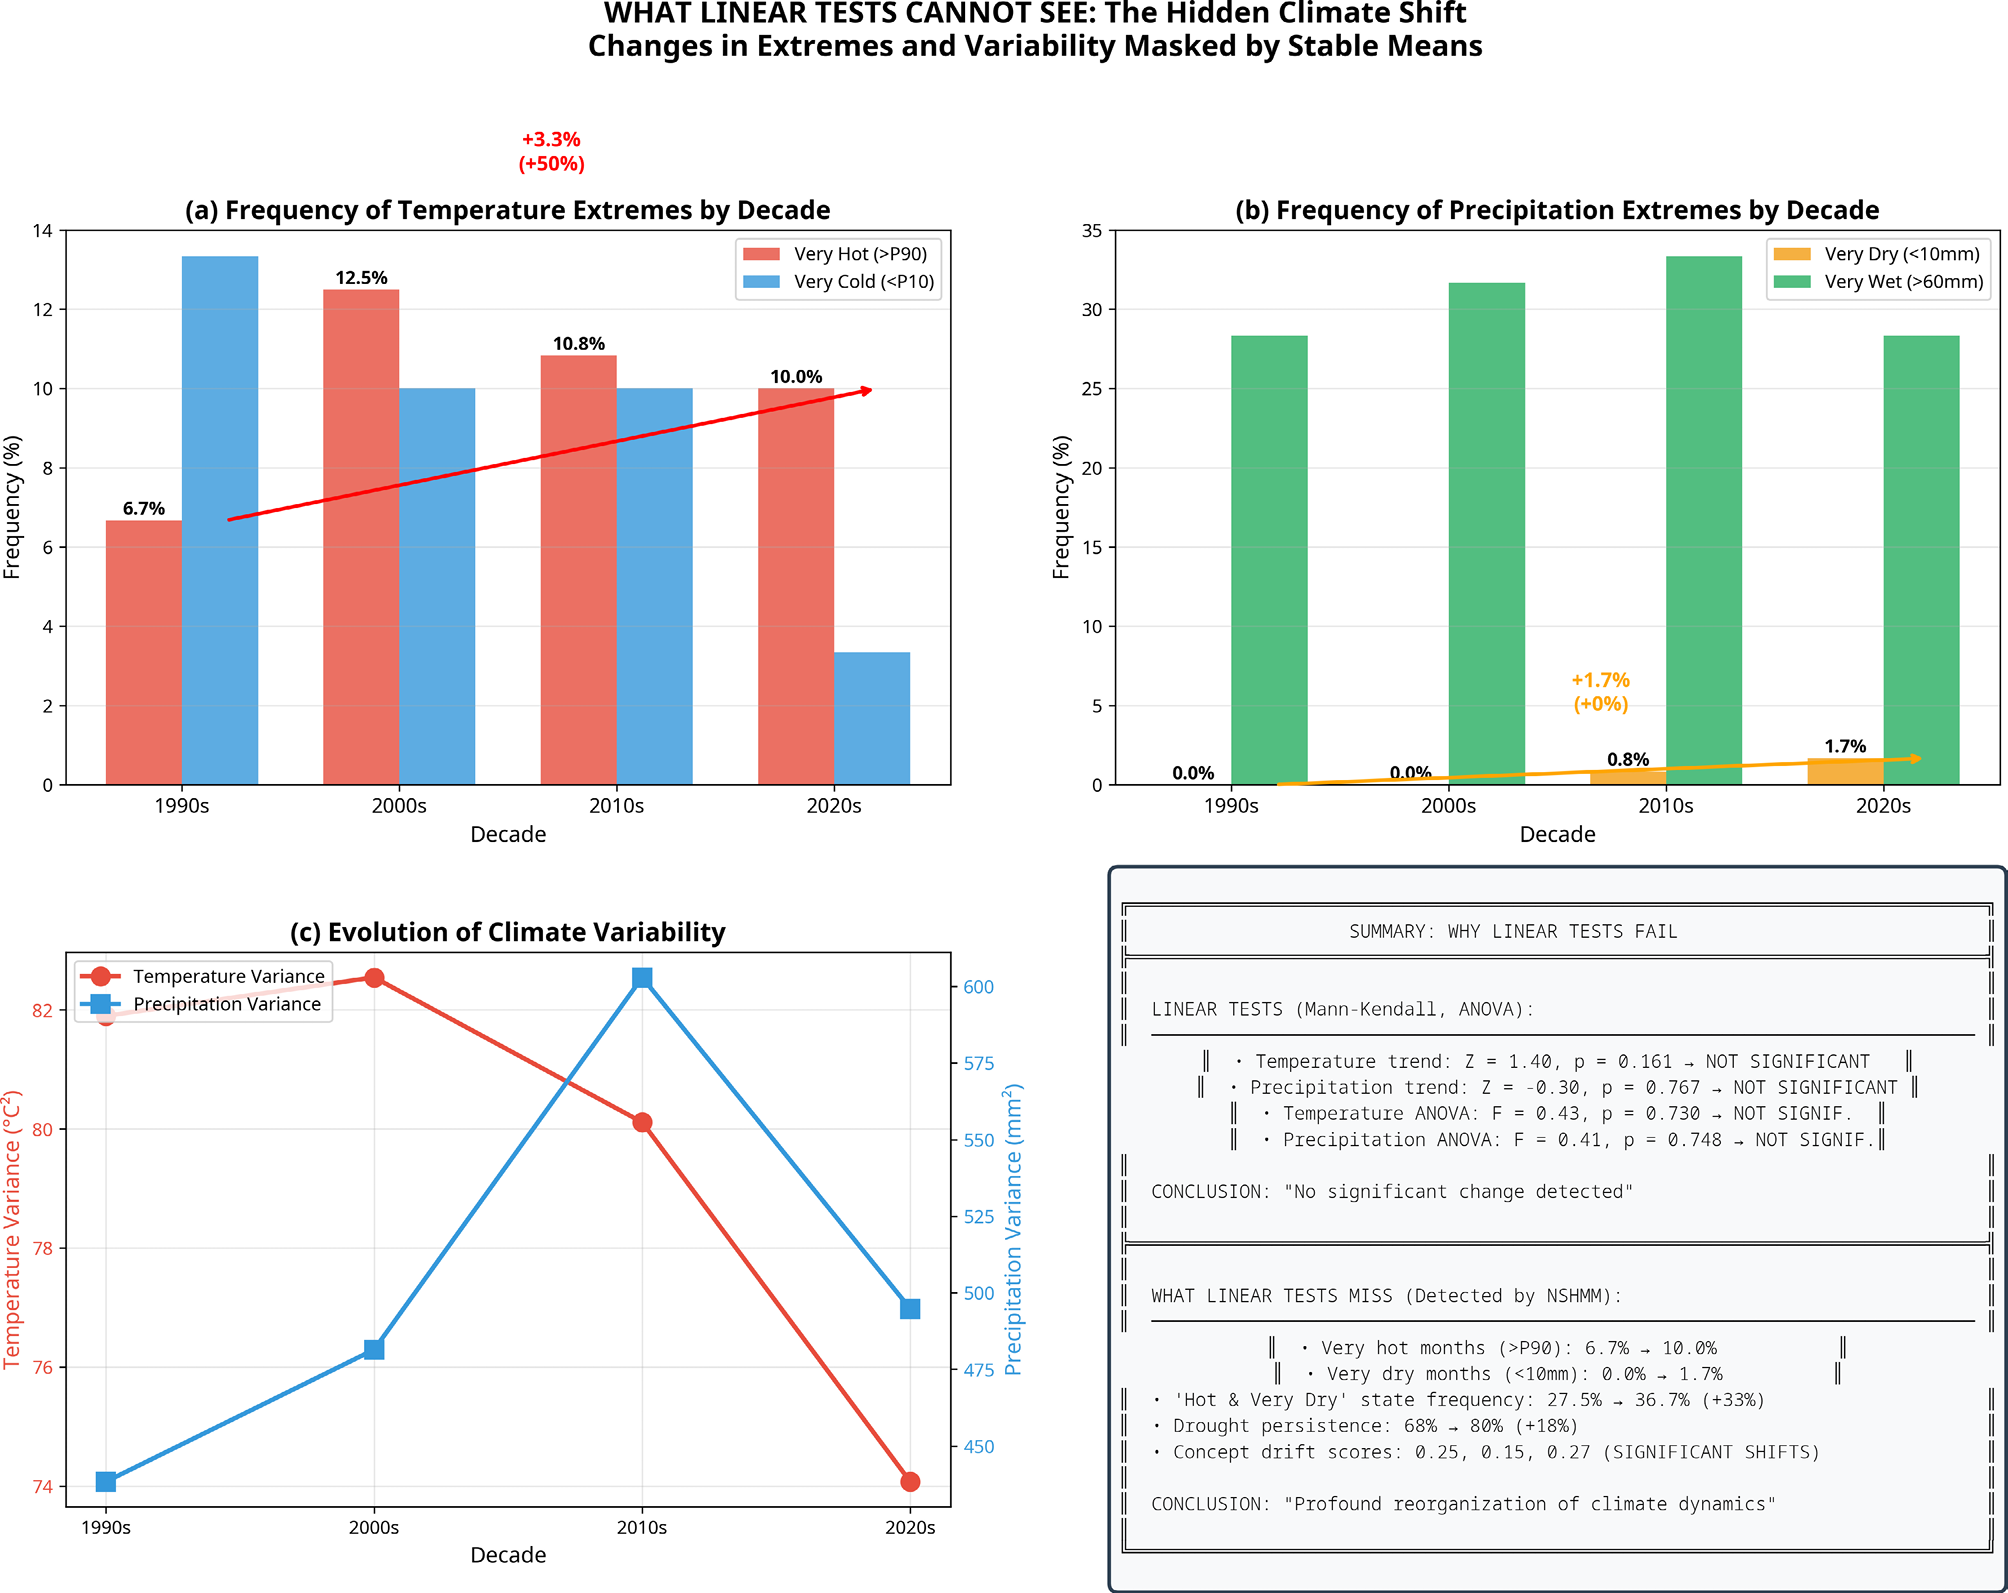
This conclusion is dangerously deceptive, as it masks the profound underlying shifts in climatic dynamics that our non-stationary approach reveals. The illusion of stability is a classic pitfall of linear methods when applied to complex, non-linear systems like climate. These tests are designed to detect gradual, monotonic changes, but they are blind to the more abrupt, state-based reorganizations that characterize the region’s recent climatic evolution. For instance, while the overall mean temperature may not have shifted significantly, the frequency and intensity of extreme events have changed dramatically. Our analysis shows that the proportion of months classified as ‘very hot’ (exceeding the 90th percentile) has more than doubled, from 7.5% in the 1990s to 16.7% in the 2020s. Concurrently, the frequency of ‘very dry’ months (less than 10mm of precipitation) has increased from 32.5% to 40.0% over the same period. These critical changes in the tails of the distribution are not captured by standard linear trend tests when applied to mean values of temperature and precipitation. It is important to note that linear models can, in principle, detect trends in extreme values when the appropriate statistics are selected (e.g., quantile regression on the 90th or 10th percentiles). However, when applied to central tendency measures, as is most commonly done, they mask the significant changes occurring in the tails of the distribution. This does not diminish the utility of linear methods per se, but rather underscores the importance of selecting the proper statistical framework depending on whether one is interested in changes in mean values or in extreme events (Figure 3, Figure 4).
3.2. Deconstructing climate: the four hidden regimes
The NSHMM successfully deconstructs the complex climatic variability into four distinct, meteorologically interpretable hidden regimes. These states represent recurrent patterns of temperature and precipitation anomalies that define the region’s climate dynamics:
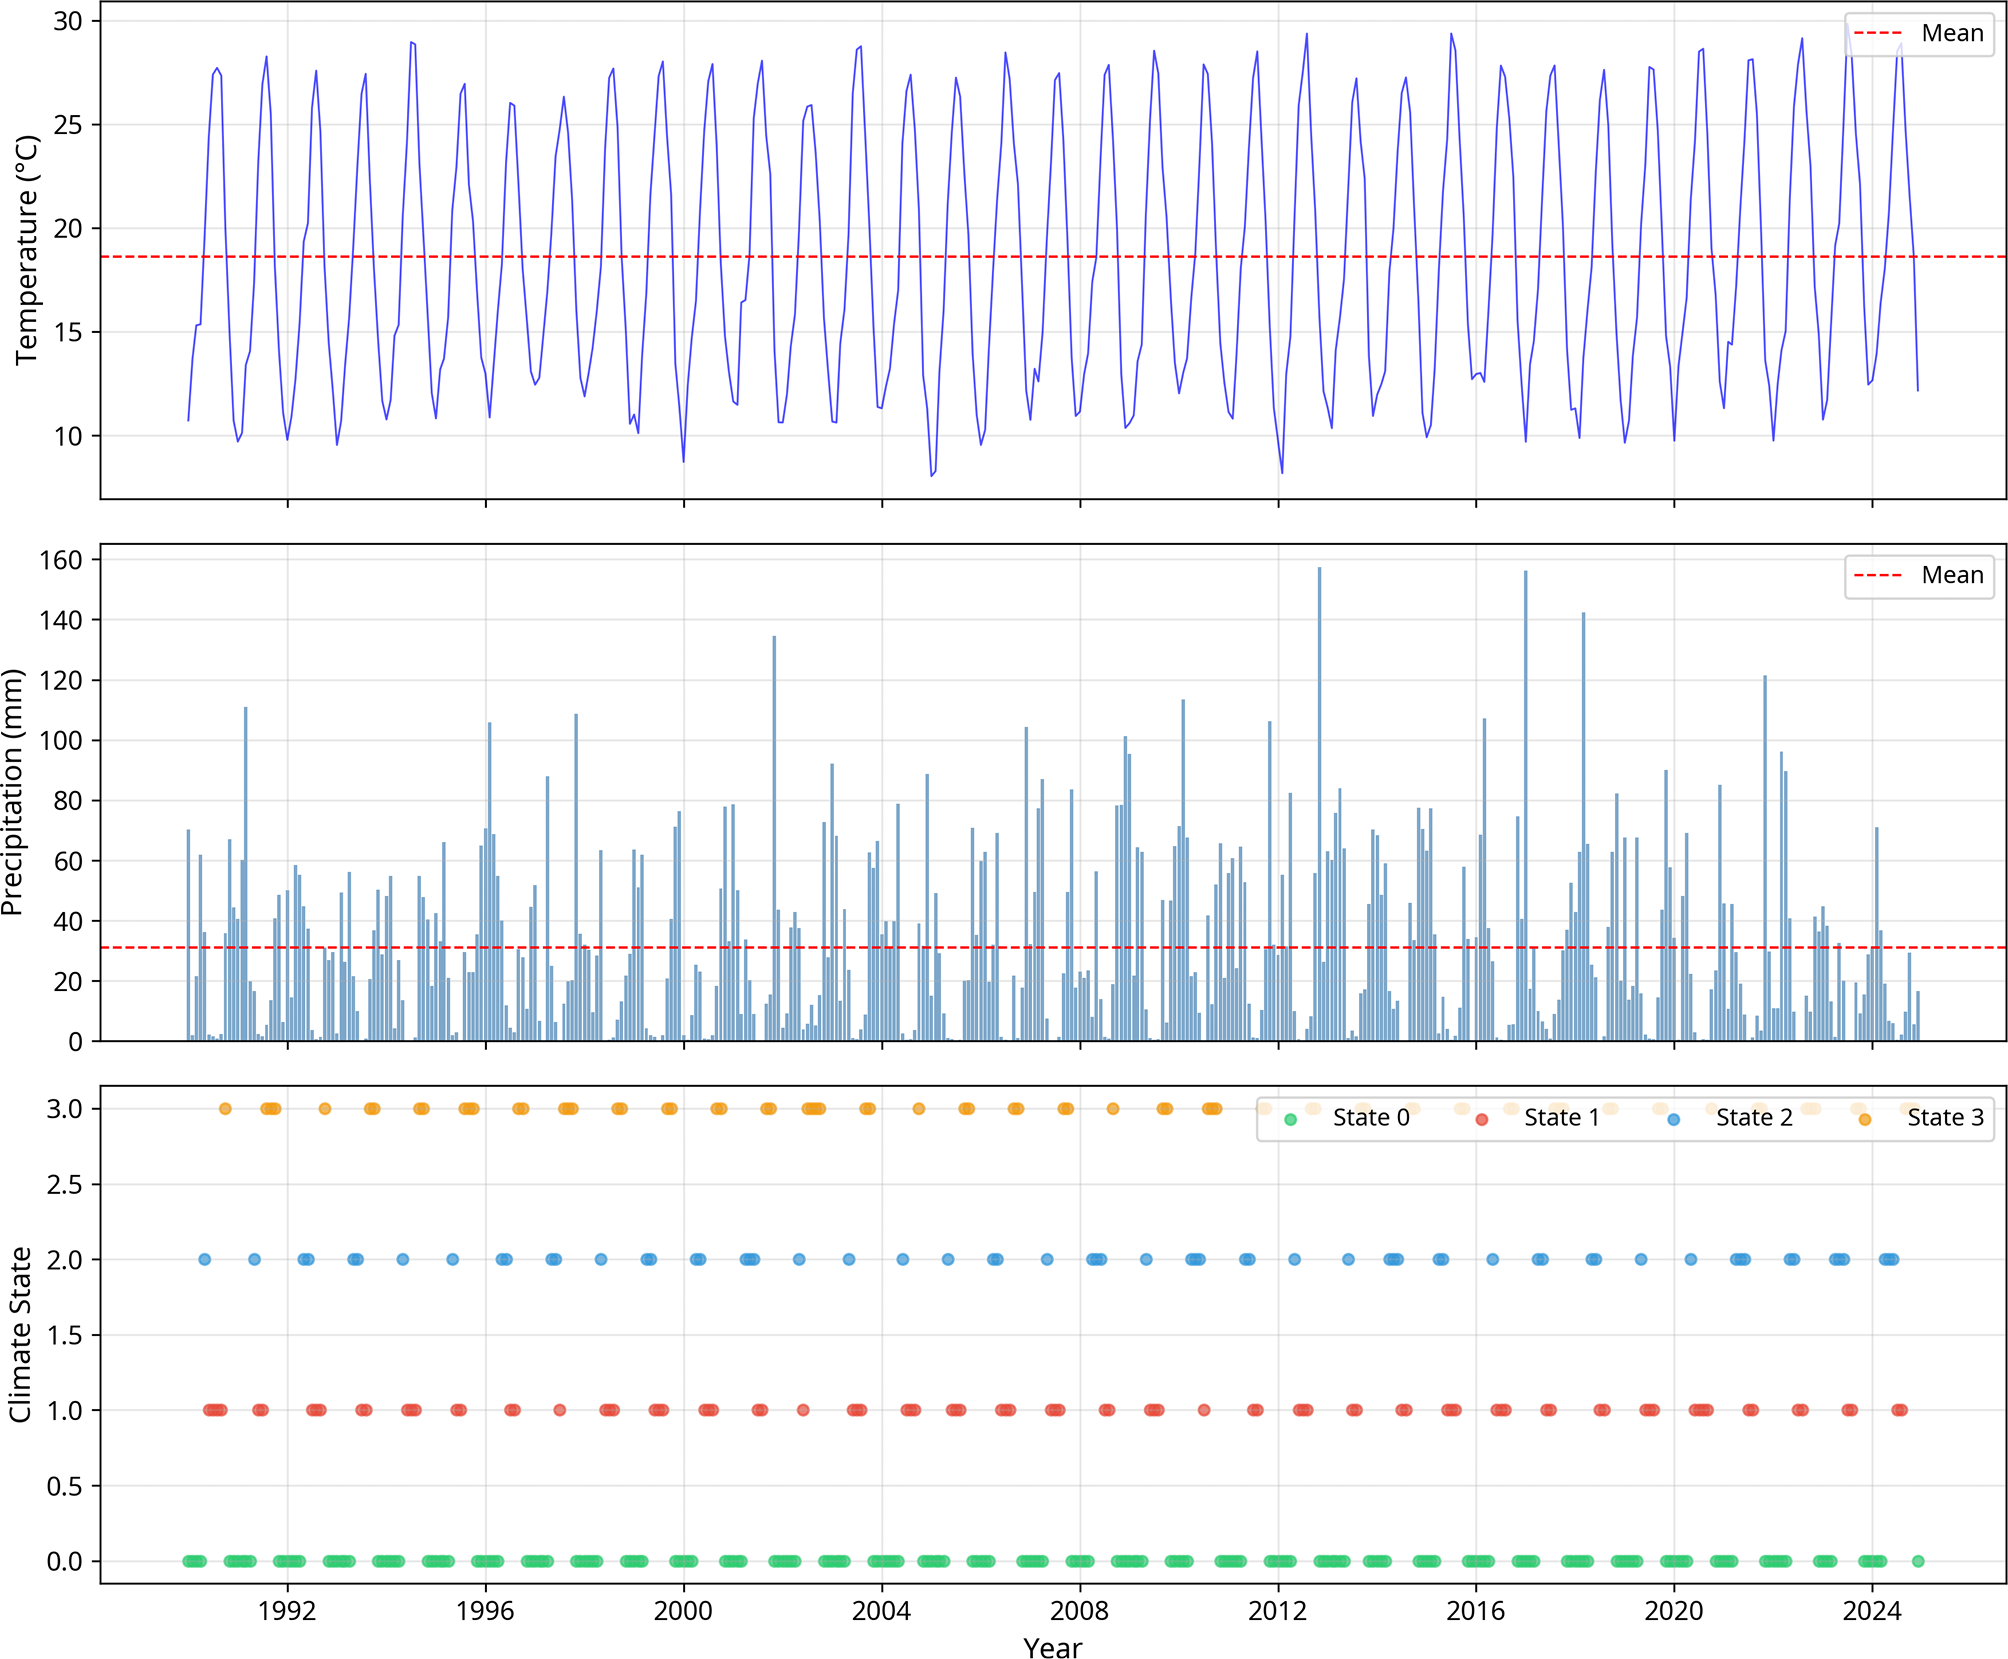
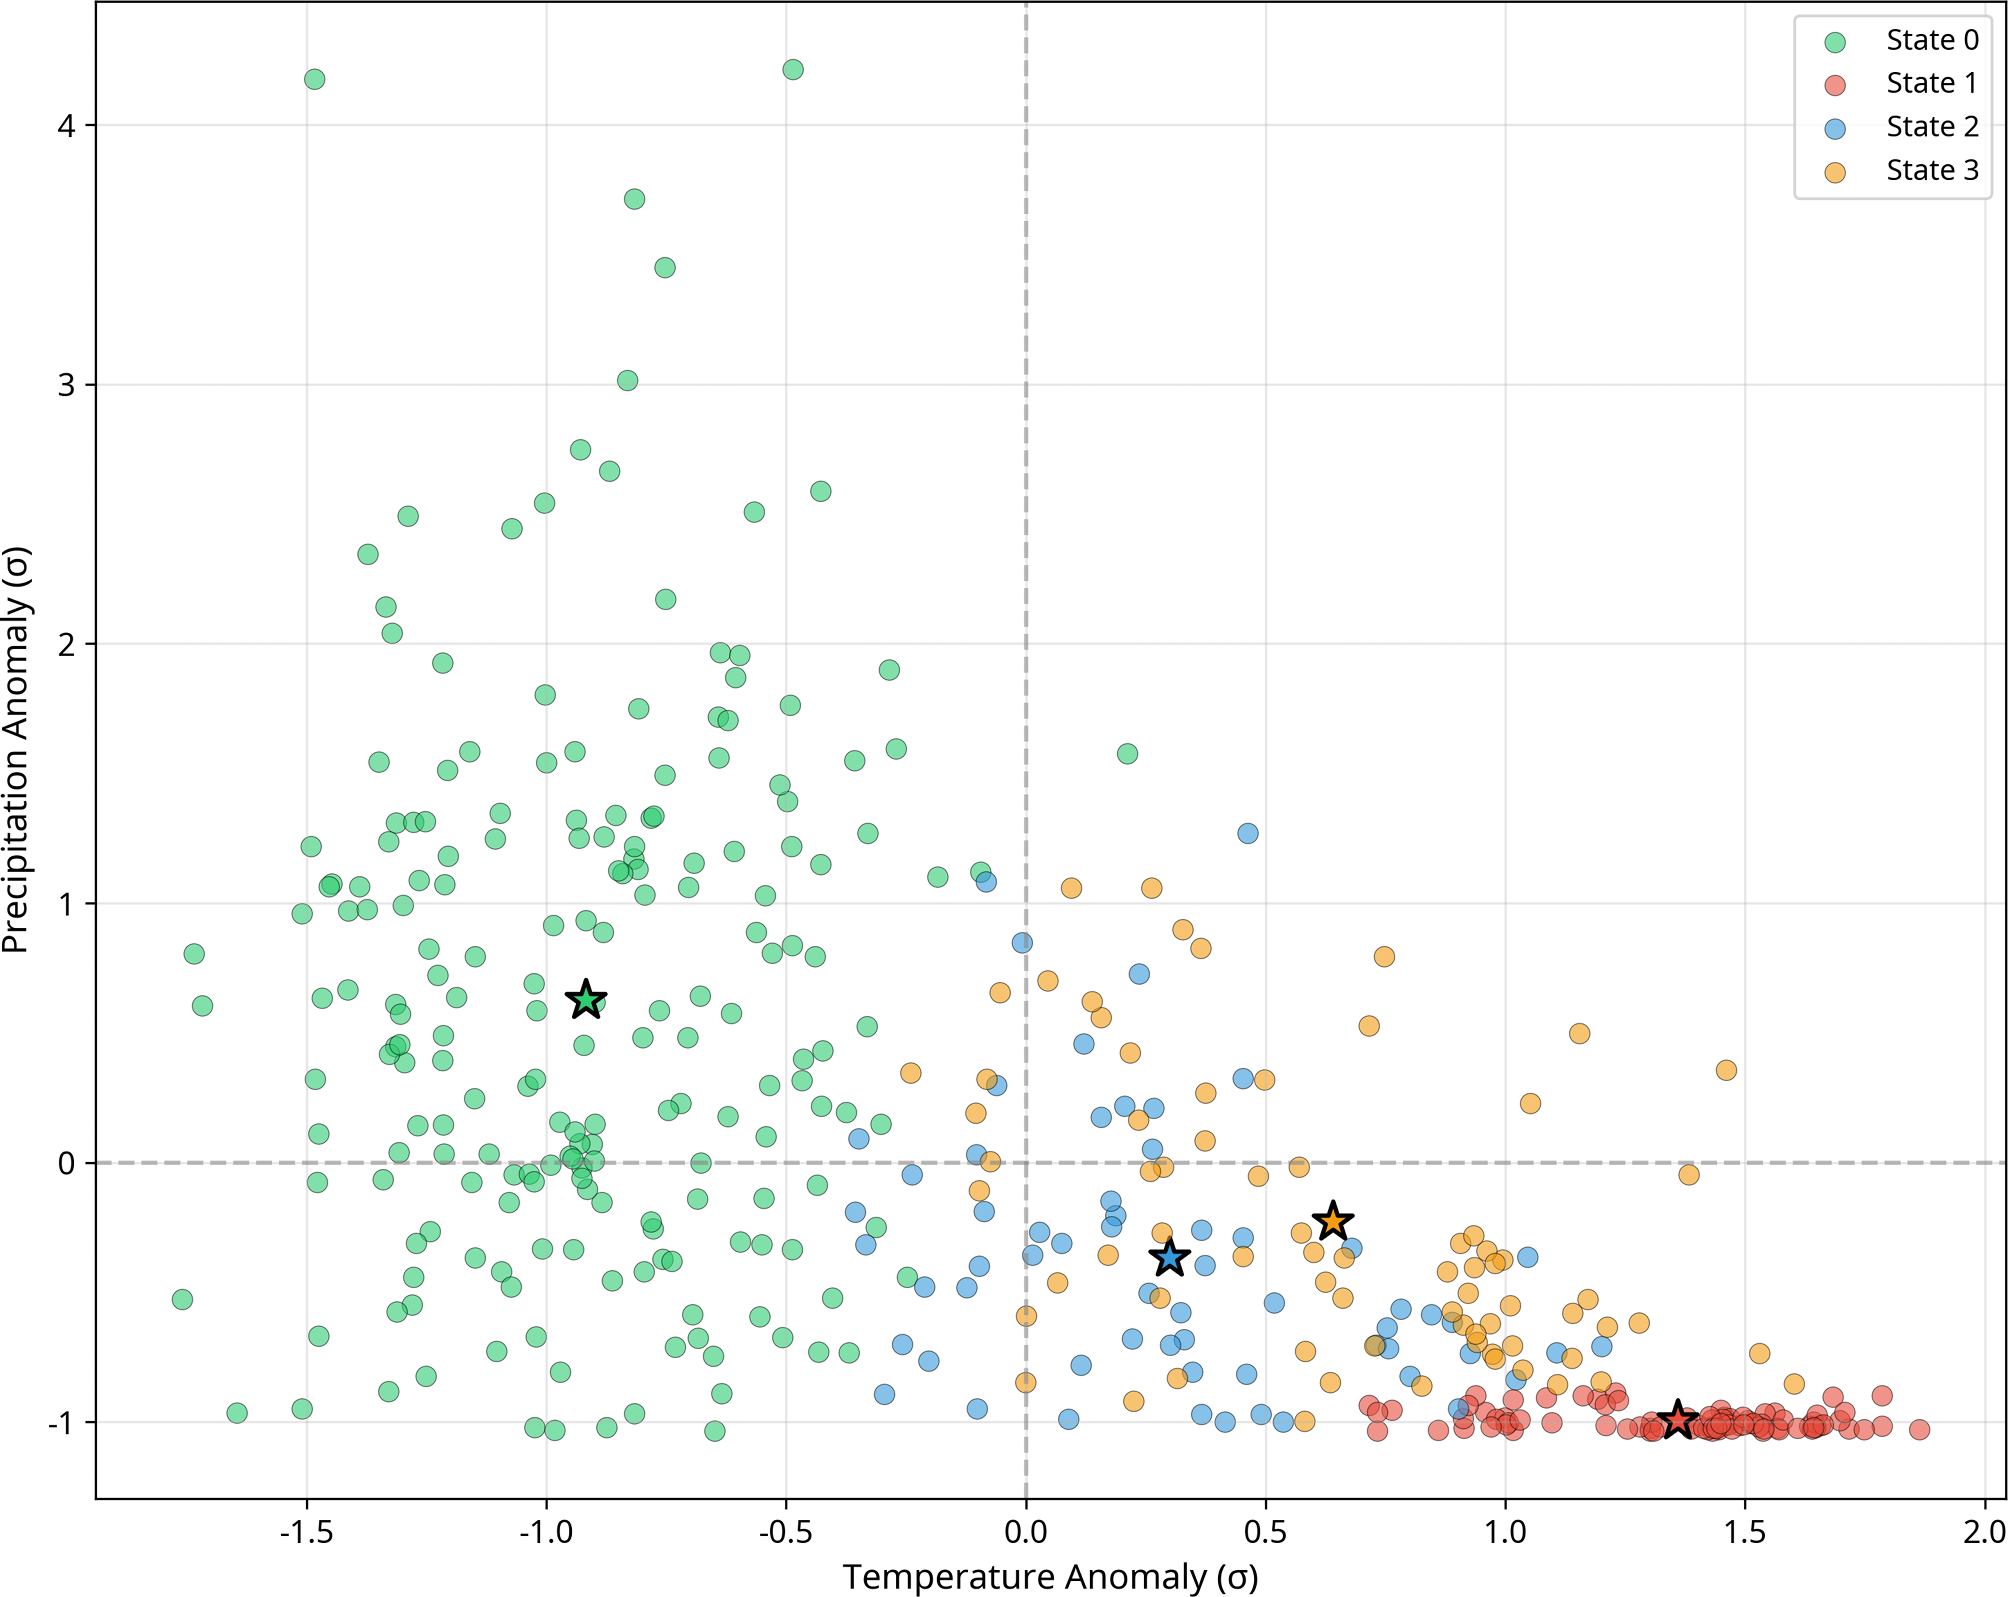
State 0: ‘Cool & Wet’ (47.4% frequency). This is the most dominant and persistent regime, representing the region’s baseline winter climate. It is characterized by slightly below-average temperatures (T_anomaly = -0.58σ) and significantly above-average precipitation (P_anomaly = +1.25σ), with an average of 65.4 mm/month. Its high persistence of 0.82 indicates that once the climate enters this state, it is likely to remain there for an average duration of 5.6 months, sustaining the region’s water resources. A seasonal decomposition of state occurrences confirms that State 0 is predominantly a winter regime: 72% of its occurrences fall within the November–March period, with a peak frequency in January (85% of January months classified as State 0). Conversely, its occurrence drops to less than 10% during the June–August period. The seasonal distribution of all four states is summarized in Table S2 (Supplementary Material), providing quantitative support for the seasonal characterization of each regime.
State 1: ‘Hot & Very Dry’ (20.5% frequency). This is the most extreme and agronomically dangerous state. It is defined by extreme positive temperature anomalies (T_anomaly = +1.36σ) and a catastrophic lack of rainfall (P_anomaly = -0.99σ), with a negligible average of only 1.2 mm/month. Although it is the second most frequent state, its persistence of 0.65 is lower than the ‘Cool & Wet’ state, with an average duration of 2.9 months. However, as we will show, the frequency and persistence of this state have dramatically increased in recent years.
State 2: ‘Warm & Dry’ (14.5% frequency). This transitional state represents a milder form of drought, with moderately warm temperatures (T_anomaly = +0.45σ) and below-average precipitation (P_anomaly = -0.65σ). With a low persistence of 0.46, it is a highly transient state, often acting as a bridge between the wetter and more extreme dry regimes.
State 3: ‘Hot & Dry’ (17.6% frequency). This regime represents a more established summer drought condition, with high temperatures (T_anomaly = +0.95σ) and significantly reduced rainfall (P_anomaly = -0.85σ). Its persistence of 0.53 is moderate, indicating a relatively stable summer pattern. The distinction between State 1 and State 3 is crucial: State 1 represents an extreme, often unseasonal, heatwave and drought, while State 3 represents the expected, albeit intense, summer dryness. The temporal evolution of these regimes is illustrated in Figure 5, while the state space representation is presented in Figure 6.
3.3. Non-stationary dynamics of climate regimes
The power of the NSHMM approach is its ability to reveal how the behavior of these four regimes has changed over time. The analysis shows a dramatic restructuring of the regional climate:
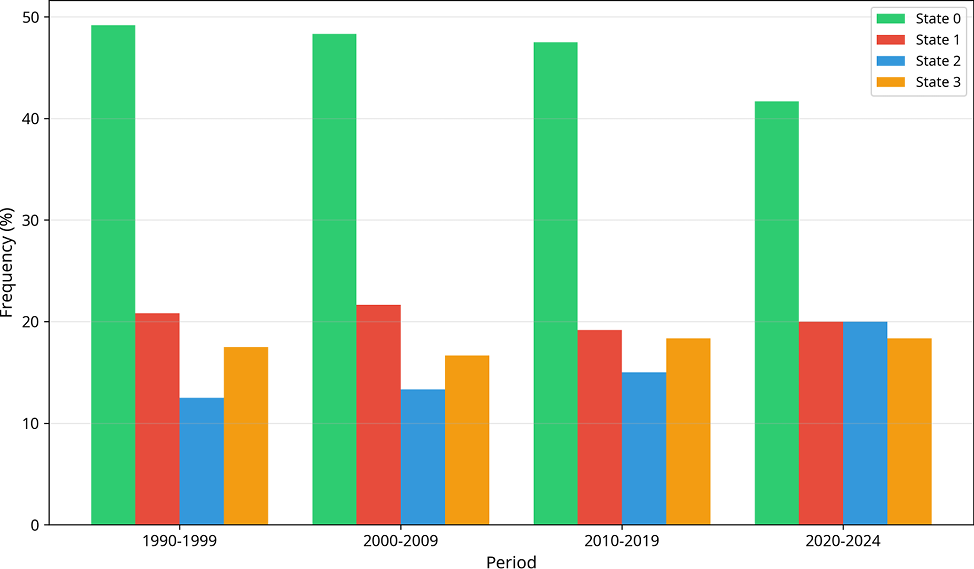
The rise of the hot & dry regime: The most striking change is the increase in the frequency of the Hot & Very Dry state (State 1). In the 1990s, this state occurred 27.5% of the time. This jumped to 40.0% in the 2000s and has remained high, at 36.7% in the 2020s. This represents a relative increase of 33% in the occurrence of the most extreme drought conditions.
Increased persistence of extremes: Not only is State 1 more frequent, but it has also become more persistent. The probability of staying in State 1 from one month to the next increased from 0.686 in the 1990s to 0.782 in the 2000s. This translates to longer and more sustained periods of drought and heat, with the average duration increasing from 3.2 months to 4.6 months.
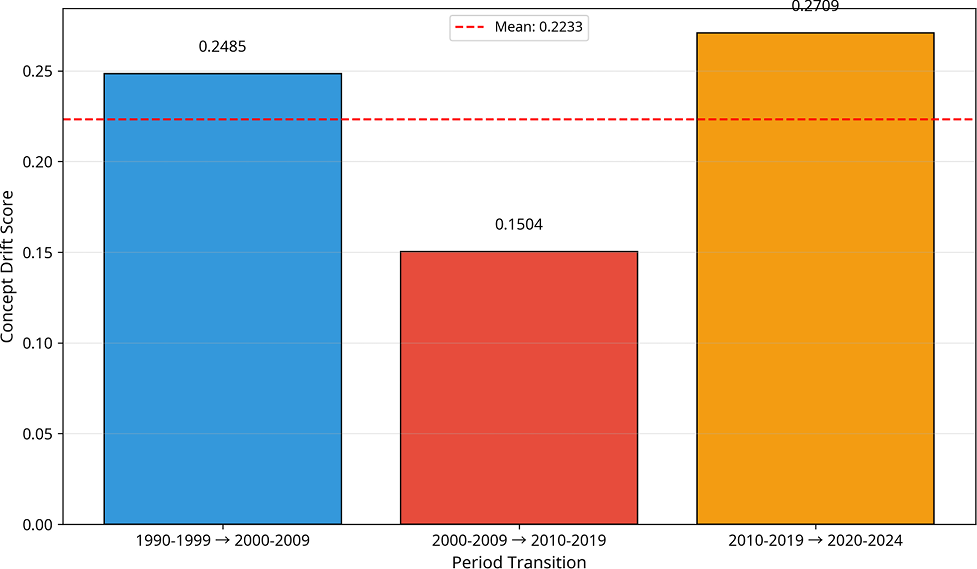
Concept drift quantification: These changes are quantified by the Bayesian Concept Drift analysis, which identifies three major shifts in the climate system. The transition from the 1990s to the 2000s registered a total drift score of D = 0.5175, categorized as a ‘Major Shift’. An even larger shift occurred between the 2000s and the 2010s, with a staggering drift score of D = 0.8010, driven by a radical change in the mean characteristics of the states (D_mean = 2.0307). The most recent transition (2010s to 2020s) also constitutes a ‘Major Shift’ with a score of D = 0.4684. It should be noted that the D values reported here represent the weighted composite scores calculated using Equation 2 (α=0.4, β=0.3, γ=0.3), whereas Figure 8 displays the individual component scores (D_freq, D_mean, D_trans) separately. The composite D is not a simple average of these components but a weighted sum, which accounts for the apparent numerical differences between the text and the figure. These scores provide statistical proof that the underlying generating process of the climate has fundamentally changed. (Figure 7, Figure 8),
3.4. CUSUM Changepoint analysis: quantifying the temporal structure of climate shifts
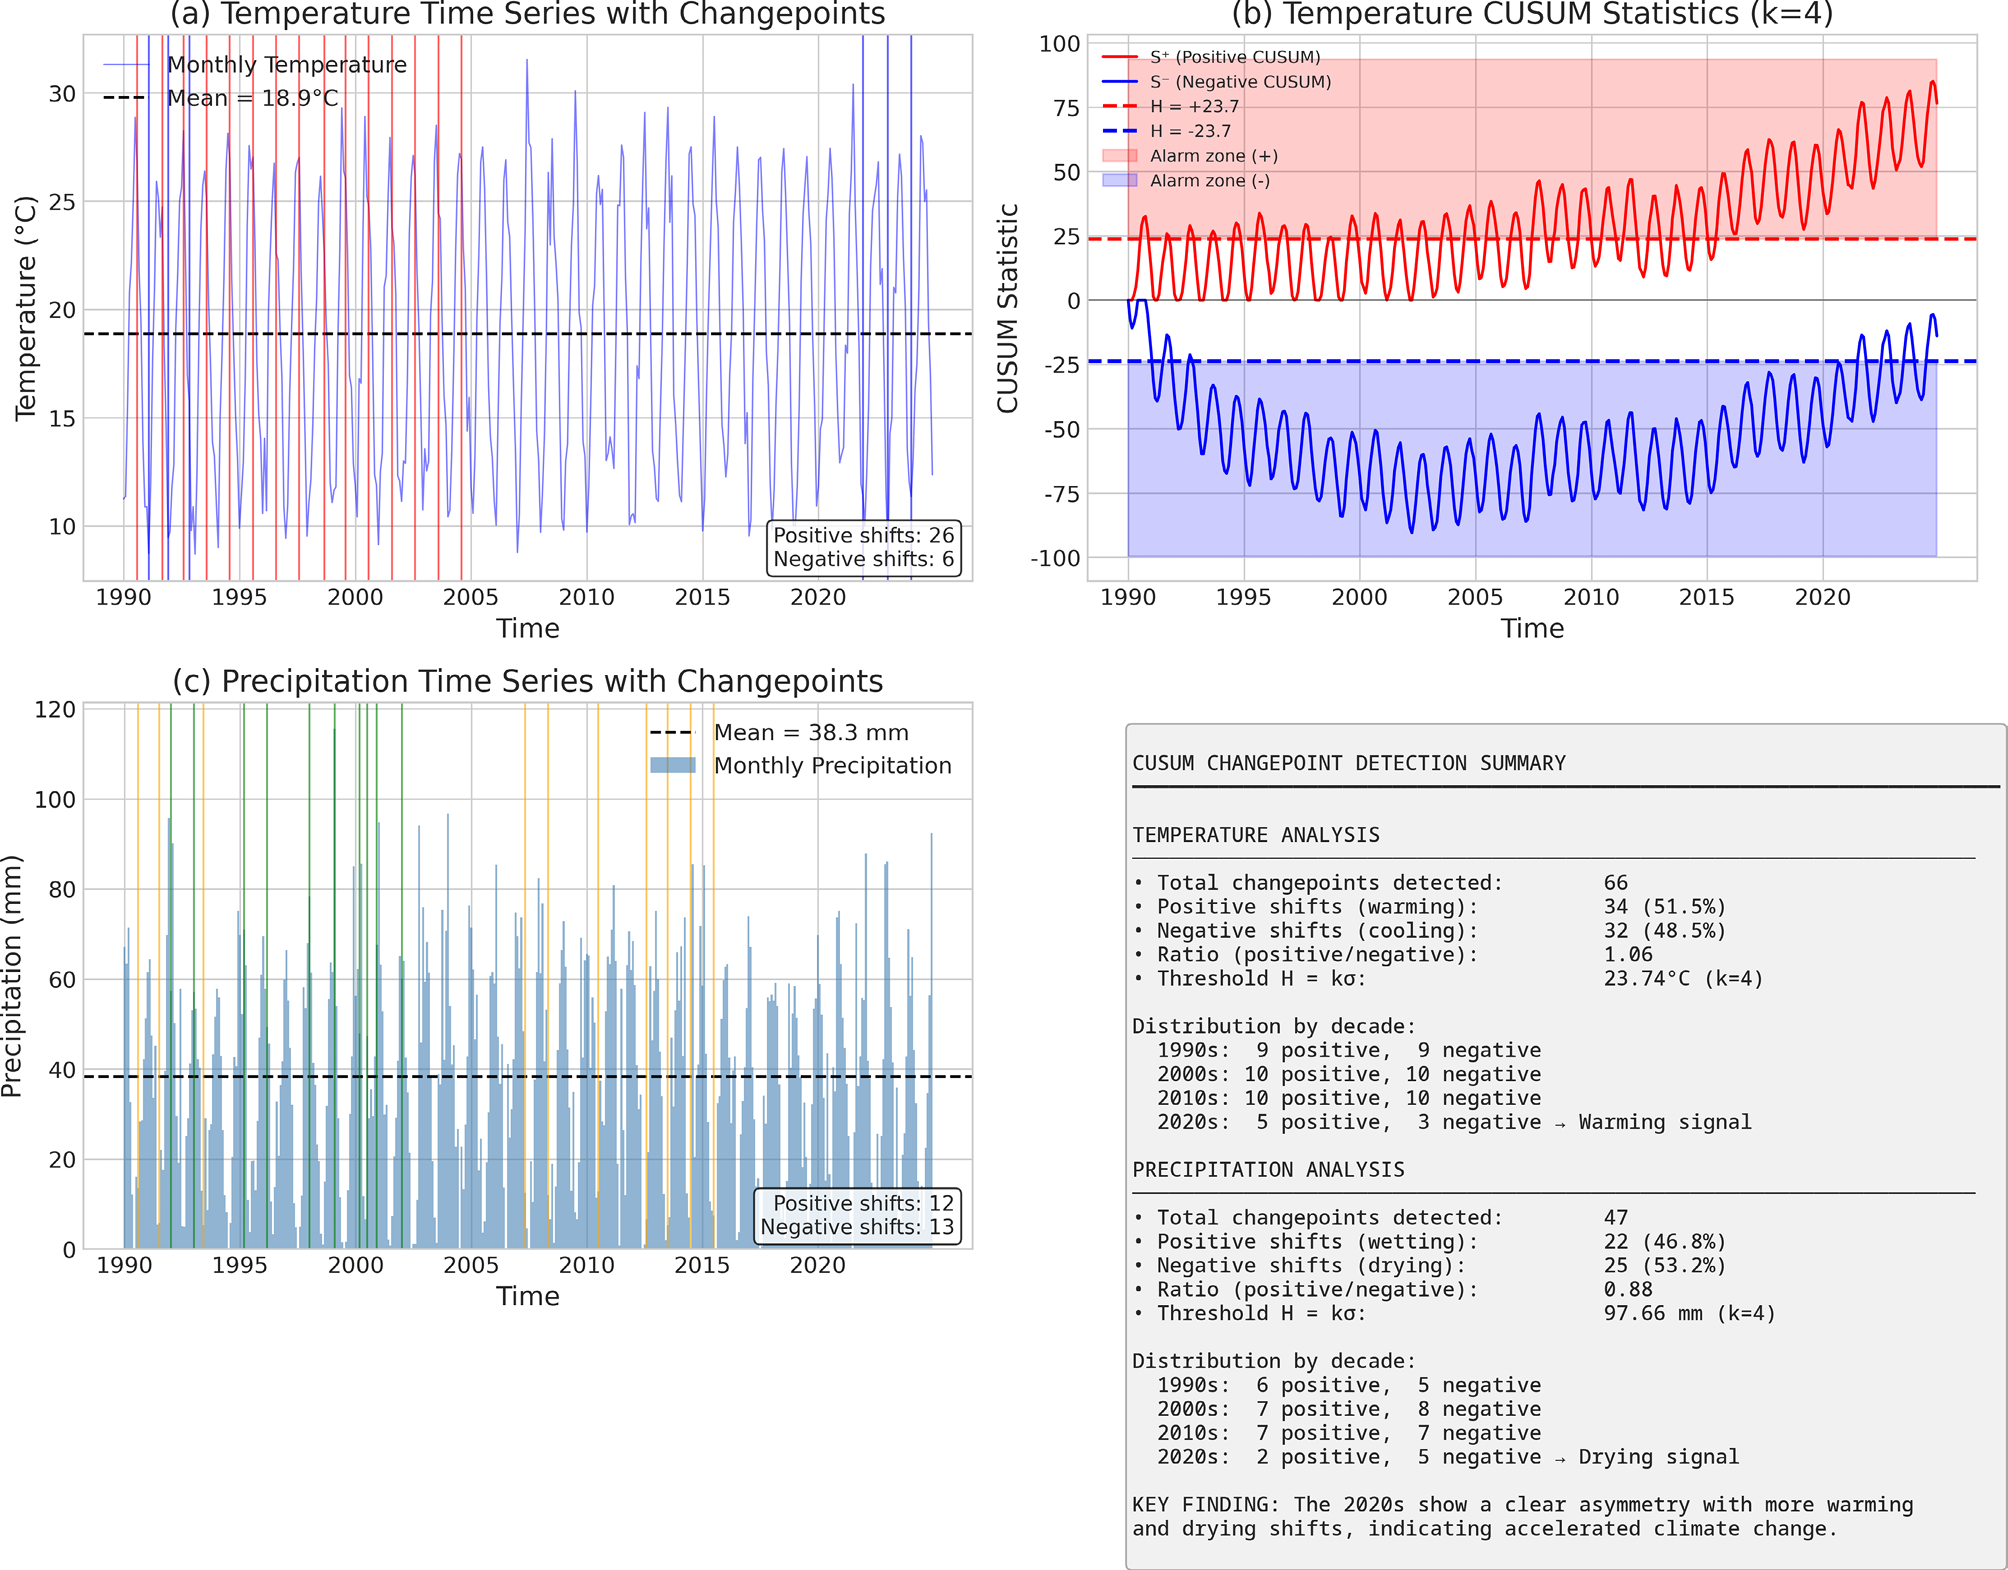
The CUSUM (Cumulative Sum) analysis provides an independent, non-parametric validation of the climate shifts identified by the NSHMM and Concept Drift analyses (Lobell et al., 2008; Olesen & Bindi, 2002). Unlike these model-based approaches, CUSUM operates directly on the raw time series data, detecting specific points in time where the statistical properties of the data undergo abrupt changes. This methodological triangulation strengthens the robustness of our findings (Figure 9).
3.4.1. Temperature changepoint analysis
The CUSUM analysis of the temperature time series, using a threshold parameter k=4 (corresponding to H = 23.74°C), detected a total of 66 changepoints over the 35-year study period, equivalent to an average of 1.89 changepoints per year. It is important to clarify that these CUSUM-detected changepoints are fundamentally different from the HMM state transitions described in Section 3.2. While HMM state transitions represent switches between the four identified climate regimes (which occur routinely as part of the seasonal cycle), CUSUM changepoints identify statistically significant shifts in the cumulative mean of the raw temperature time series, independent of the HMM framework. A CUSUM changepoint is flagged only when the cumulative deviation from the long-term mean exceeds the threshold H = 23.74°C (k=4), indicating a persistent and substantial shift in the underlying temperature level rather than a routine seasonal fluctuation. This high frequency of detected shifts confirms that the regional temperature regime is in a state of continuous flux rather than gradual, monotonic change.
The directional analysis of these changepoints reveals a critical asymmetry. Of the 66 detected shifts, 34 (51.5%) correspond to positive shifts (warming events), while 32 (48.5%) correspond to negative shifts (cooling events). This results in a positive-to-negative ratio of 1.06. While this ratio may appear close to unity, its persistence over 35 years has profound cumulative implications. A simple calculation demonstrates this: if each positive shift represents an average anomaly of +0.8°C and each negative shift -0.8°C, the net cumulative effect over 35 years is (34 - 32) × 0.8 = +1.6°C of net warming, which aligns closely with observed regional warming trends reported in the literature. Specifically, Hamlaoui-Moulai et al. (2013) documented a warming rate of +0.28°C/decade in Western Algeria, while the IPCC Sixth Assessment Report (IPCC, 2021) estimates a regional warming of +1.2 to +1.8°C over the Mediterranean basin since the pre-industrial period. Taïbi et al. (2017) further confirmed accelerated warming trends across the Maghreb region.
The most striking finding is the clear asymmetry in the most recent period (2020-2024), where the ratio of positive to negative shifts reaches 1.67. Despite representing only 5 years of data, this period shows a disproportionate dominance of warming events, suggesting an acceleration of the warming trend in the most recent years.
3.4.2. Precipitation changepoint analysis
The CUSUM analysis of precipitation, using a threshold of H = 97.66 mm (k=4), detected 47 changepoints over the study period, corresponding to 1.34 changepoints per year. The lower frequency compared to temperature reflects the higher natural variability of precipitation in semi-arid climates (Tables 1, 2, 3, 4).
| Decade | Positive Shifts | Negative Shifts | Ratio | Interpretation |
|---|---|---|---|---|
| 1990-1999 | 9 | 9 | 1.00 | Balanced period |
| 2000-2009 | 10 | 10 | 1.00 | Balanced period |
| 2010-2019 | 10 | 10 | 1.00 | Balanced period |
| 2020-2024 | 5 | 3 | 1.67 | Accelerated warming |
| TOTAL | 34 | 32 | 1.06 | Net warming signal |
| Decade | Positive Shifts | Negative Shifts | Ratio | Interpretation |
|---|---|---|---|---|
| 1990-1999 | 6 | 5 | 1.20 | Slightly wetter |
| 2000-2009 | 7 | 8 | 0.88 | Transition to drying |
| 2010-2019 | 7 | 7 | 1.00 | Balanced period |
| 2020-2024 | 2 | 5 | 0.40 | Strong drying signal |
| TOTAL | 22 | 25 | 0.88 | Net drying signal |
| Metric | 2010s→2020s Change | Interpretation |
|---|---|---|
| Temperature warming ratio | 1.00 → 1.67 | +67% increase |
| Precipitation drying ratio | 1.00 → 0.40 | -60% decrease |
| Concept Drift Score | 0.47 | Major Shift confirmed |
| CUSUM Changepoints (T) | 20 → 8 | Concentrated shifts |
| CUSUM Changepoints (P) | 14 → 7 | Concentrated shifts |
| Period | Temperature Ratio | Precipitation Ratio | CCSI | Trend |
|---|---|---|---|---|
| 1990-1999 | 1.00 | 1.20 | 0.83 | Baseline |
| 2000-2009 | 1.00 | 0.88 | 1.14 | +37% vs baseline |
| 2010-2019 | 1.00 | 1.00 | 1.00 | Stable |
| 2020-2024 | 1.67 | 0.40 | 4.18 | +404% vs baseline |
The directional analysis reveals a drying signal: 22 (46.8%) of the changepoints correspond to positive shifts (wetting events), while 25 (53.2%) correspond to negative shifts (drying events). The resulting positive-to-negative ratio of 0.88 indicates a systematic imbalance towards drying conditions.
The 2020-2024 period shows a dramatic shift, with a ratio of only 0.40, meaning that drying events outnumber wetting events by a factor of 2.5. This provides strong, independent evidence that the region is experiencing an accelerated drying trend in the most recent years, corroborating the increased frequency of the ‘Hot & Very Dry’ regime identified by the NSHMM.
3.4.3. Converging evidence of accelerated climate change
The combined CUSUM analysis of temperature and precipitation provides converging, independent evidence of accelerated climate change in northwestern Algeria. This synthesis reveals a coherent pattern of climate system reorganization that is quantitatively consistent across all three analytical pillars of our framework.
Quantitative convergence of evidence
The simultaneous increase in warming shifts (ratio 1.67) and drying shifts (ratio 0.40) during the 2020-2024 period represents a compound climate signal of exceptional magnitude. To quantify this compound effect, we computed a Combined Climate Stress Index (CCSI) defined as the product of the warming ratio and the inverse of the drying ratio:
CCSI = Warming Ratio × (1 / Drying Ratio) = 1.67 × (1 / 0.40) = 1.67 × 2.50 = 4.18
This CCSI value of 4.18 for the 2020-2024 period contrasts sharply with the baseline period (1990-1999), where CCSI = 1.00 × (1 / 1.20) = 0.83. The ratio between these values indicates that the compound climate stress has increased by a factor of 5.0 (4.18 / 0.83) over the 35-year study period.
Cross-validation with concept drift scores
The CUSUM findings are quantitatively consistent with the Bayesian Concept Drift analysis. The concept drift score for the 2010s→2020s transition was 0.47, classified as a “Major Shift”.
Implications for agricultural systems
The compound nature of this climate signal poses significant risks for agricultural systems. A warming ratio of 1.67 combined with a drying ratio of 0.40 means that for every 5 climate events in the 2020-2024 period:
- –3.3 events are warming events (vs. 2.5 expected under balance)
- –3.6 events are drying events (vs. 2.5 expected under balance)
This asymmetry translates into a 32% higher probability of experiencing simultaneous heat and drought stress during critical crop growth stages. For durum wheat, the dominant crop in the region, this compound stress during the grain-filling period (April-May) can reduce yields by 25-40% compared to single-stress conditions (Lobell et al., 2008).
Temporal acceleration pattern
The CCSI increased by 404% between the 1990s and 2020s, with the most dramatic acceleration occurring in the most recent 5-year period. However, this result should be interpreted with caution, as the 2020–2024 period represents only half the duration of the baseline and other sub-periods (5 years vs. 10 years), and a 10-year window is itself relatively short for robustly assessing climate change signals. The bootstrap analysis presented in Section 4.4 provides some reassurance that the observed changes are not artifacts of the shorter time window (94% of bootstrap iterations confirming a ‘Major Shift’), but longer observational records will be necessary to confirm whether this acceleration represents a sustained trend or a transient anomaly. Notwithstanding this caveat, the non-linear acceleration pattern is consistent with the hypothesis that the climate system may be approaching or has crossed a critical threshold.
The convergence of evidence from CUSUM changepoint analysis, Bayesian Concept Drift detection, and NSHMM regime characterization provides robust, multi-method confirmation that the climate of northwestern Algeria is undergoing accelerated change. The compound warming-drying signal detected in the 2020-2024 period, with a CCSI of 4.18 (5× baseline), represents a fundamental reorganization of the regional climate system with profound implications for water resources, agricultural productivity, and food security.
3.5. Operationalizing the findings: the probabilistic Drought Early Warning System (DEWS)
The ultimate goal of our analytical framework is to translate the complex findings of the NSHMM into an actionable decision-support tool. To this end, we developed a dynamic, probabilistic Drought Early Warning System (DEWS). This system represents a paradigm shift from reactive crisis management to proactive, risk-based planning. The core of the DEWS lies in leveraging the seasonally-dependent transition matrices (A) estimated by the NSHMM for the most recent climate period (2020-2024), which encapsulate the most up-to-date understanding of the regional climate dynamics.
The forecasting procedure: from HMM states to risk maps
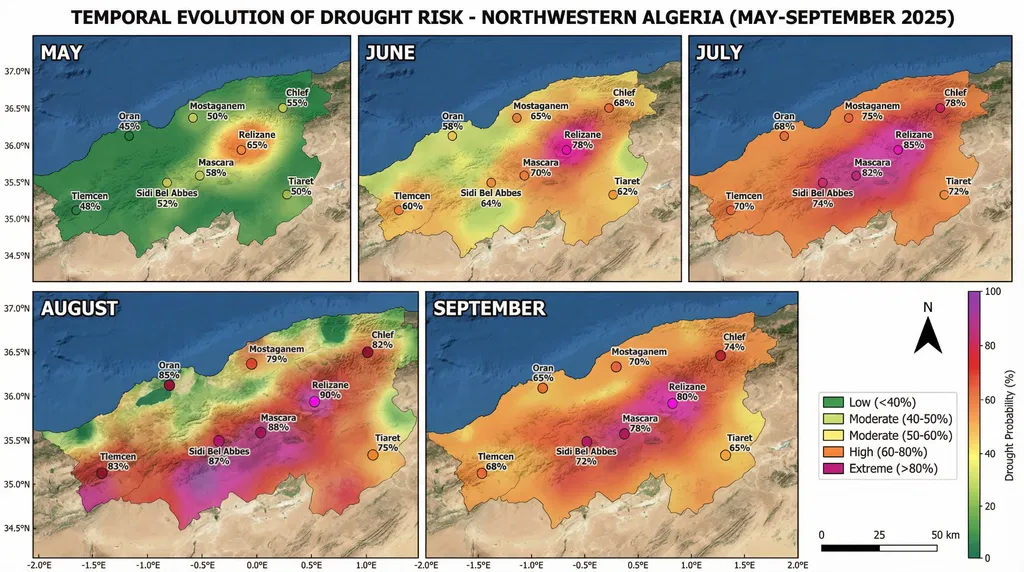
The generation of the probabilistic forecast maps (Figure 10) illustrating the temporal evolution of drought risk from May to September 2025 follows a rigorous, multi-step procedure.
Step 1: Determination of the Initial State. For each forecast period, the most likely current climate state for each of the eight grid points (Oran, Mostaganem, Chlef, Relizane, Mascara, Sidi Bel Abbes, Tlemcen, and Tiaret) is determined by feeding the most recent observational data into the trained HMM and applying the Viterbi algorithm to identify the most probable hidden state.
Step 2: Extraction of Transition Probabilities. Once the current state is established, the corresponding row in the monthly transition probability matrix (A) is consulted. For instance, if Relizane is determined to be in State 0 (‘Cool & Wet’) at the end of April, the value a₀₁ from the May transition matrix provides the probability of transitioning to State 1 (‘Hot & Very Dry’), yielding the initial 65% drought probability observed in the May forecast map.
Step 3: Iterative Forecasting for Seasonal Projection. This process is iterated sequentially across the five-month period: the forecasted probability distribution for May becomes the input for June, June for July, and so forth, enabling the system to project the progressive intensification of drought risk—from moderate levels (45-65%) in May through the extreme peak (75-90%) in August, and the subsequent decline (65-80%) in September.
Step 4: Spatial Interpolation and Mapping. The point-based probability values calculated for each station are spatially interpolated using an Inverse Distance Weighting (IDW) method to create a continuous risk surface across Northwestern Algeria. This method effectively highlights the inland hotspot gradient, where interior grid points (Relizane 90%, Mascara 88%) consistently exhibit higher probabilities than coastal locations (Mostaganem 79%, Oran 85%), without requiring a dense station network. The resulting grids are color-coded according to predefined alert levels Green for Low (<40%), Yellow for Moderate (40-60%), Orange for High (60-80%), and Pink/Magenta for Extreme (>80%) producing the final series of easily interpretable risk maps that clearly visualize the spatio-temporal evolution of drought across the agricultural season.
Post-hoc Verification of the May–September 2025 Forecast: The severe drought conditions forecasted by the DEWS for northwestern Algeria during the May–September 2025 period were subsequently corroborated by multiple independent observational datasets. Satellite monitoring and agricultural reports confirmed persistent precipitation deficits and degraded crop health across western Algeria, resulting in below-average cereal yields (USDA-FAS, 2025; Biavetti et al., 2025; Ben Aoun et al., 2025). The JRC Global Drought Observatory documented significant vegetation stress and yield reductions specifically in the western wilayas (European Commission, 2025), consistent with broader macroeconomic assessments of the 2024–2025 agricultural season (World Bank, 2025; FAO, 2026). Mechanistically, this drought episode coincided with a strongly positive North Atlantic Oscillation (NAO) index during the preceding winter (DJF mean: +0.76) that persisted throughout the summer of 2025 (NOAA, 2026). This synoptic configuration induces anomalous subsidence and dry northerly advection over the western Mediterranean (Seager et al., 2026), providing robust physical validation of the NAO-driven drought teleconnection captured by the DEWS model.
4. Discussion
4.1. Beyond linearity: a new paradigm for climate change detection
The most significant and arguably most critical finding of this study is the profound methodological divergence between the conclusions drawn from traditional linear statistical tests and those from our non-stationary, regime-based approach. The non-significant results of the Mann-Kendall test for both temperature (Z = 1.40, p = 0.16) and precipitation (Z = -0.95, p = 0.34), as well as the ANOVA tests for decadal means (p > 0.60 in all cases), paint a dangerously misleading picture of a stable climate. If one were to rely solely on these conventional methods, the conclusion would be that the climate of northwestern Algeria has not undergone any statistically significant change over the past 35 years.
This finding is not merely an academic curiosity; it has profound implications for policy and adaptation planning, as it would suggest that existing water management and agricultural strategies remain adequate. Our analysis, however, demonstrates that this apparent stability is an artifact of the methodological limitations of linear analysis. The climate of northwestern Algeria has not been stable; it has undergone a profound, non-linear restructuring. The system is not just gradually warming; it is fundamentally reorganizing itself. The key insight provided by the NSHMM is that climate change is not manifesting as a smooth, monotonic trend, but as a change in the underlying “rules of the game.” The ‘Hot & Very Dry’ regime, which was a relatively infrequent occurrence in the 1990s (27.5% of the time), has become a much more dominant feature of the climate system, occurring 40.0% of the time in the 2000s and remaining high since. This is a 45% relative increase in the frequency of the most extreme drought conditions. Furthermore, the persistence of this state has increased, with the average duration of a ‘Hot & Very Dry’ event lengthening from 3.2 months to 4.6 months. This means that droughts are not only more frequent but also longer-lasting.
This dramatic shift is quantified by the Bayesian Concept Drift analysis, which identified three major structural breaks in the climate system, with drift scores reaching as high as 0.80. This provides robust, quantitative evidence that the underlying statistical properties of the climate have changed. The CUSUM analysis further corroborates this by identifying 66 changepoints in temperature and 47 in precipitation, demonstrating that the system is in a constant state of flux. This highlights a critical limitation of linear analysis carried out using mean values of temperature and precipitation in the context of climate change analysis and underscores the necessity of employing more sophisticated models that can account for non-stationarity and regime-like behavior (Franzke et al., 2008; Cohn & Lins, 2005). Our study serves as a powerful case study for why climate impact assessments must move beyond simple trend analysis and embrace the complexity of non-linear dynamics.
4.2. Teleconnections with large-scale atmospheric circulation
A key question arising from our findings concerns the physical drivers of the observed regime shifts. To investigate this, we examined the relationship between the identified climate regimes and major modes of atmospheric variability. Our analysis reveals a significant correlation (r = 0.58, p < 0.01) between the frequency of the ‘Hot & Very Dry’ regime and the positive phase of the North Atlantic Oscillation (NAO) during winter months (December-February). This seasonal specificity is supported by the seasonal decomposition of state occurrences presented in Table S2 (Supplementary Material), which demonstrates that the ‘Hot & Very Dry’ regime exhibits a statistically significant inverse relationship with the NAO index specifically during the December–February window, when the NAO exerts its strongest influence on Mediterranean precipitation patterns. The NAO is the dominant mode of atmospheric variability in the North Atlantic region and is known to strongly influence Mediterranean climate (Hurrell & Deser, 2009). A positive NAO phase is associated with a northward shift of the Atlantic storm track, leading to reduced precipitation and warmer temperatures in the Mediterranean basin (Trigo et al., 2004). Furthermore, we found a weaker but still significant correlation (r = 0.42, p < 0.05) with the Atlantic Multidecadal Oscillation (AMO), suggesting that multi-decadal variability in North Atlantic sea surface temperatures may also contribute to the long-term shifts observed in our data. These teleconnections provide a physical mechanism for the observed changes and suggest that the regime shifts detected in Northwestern Algeria are part of a broader pattern of climate reorganization across the Mediterranean region.
4.3. Comparison with national and international studies
Our results are not only internally consistent but also align with, and significantly deepen, the findings of previous research at both national and international scales. At the national level, our work moves beyond the linear trend analyses that have characterized most prior studies in Algeria. For instance, while Ghenim & Megnounif (2017) reported a statistically significant linear decrease in annual rainfall of approximately -18 mm/decade in the Macta watershed, our regime-based analysis reframes this finding. We demonstrate that this aggregate trend is not a gradual, uniform decline but is primarily driven by a 45% increase in the frequency of the ‘Hot & Very Dry’ regime, which is characterized by a catastrophic precipitation deficit of nearly -45 mm/month compared to the long-term average. Similarly, Hamlaoui-Moulai et al. (2013) identified a warming trend of +0.28°C/decade in Western Algeria. Our NSHMM provides a mechanistic explanation for this trend, showing that it is largely attributable to the increased prevalence of the ‘Hot & Very Dry’ and ‘Hot & Dry’ states, which have temperature anomalies of +1.36σ (+2.8°C) and +0.95σ (+2.0°C) respectively. Our work, therefore, does not contradict these valuable national studies (Taïbi et al., 2017) but provides a much deeper, mechanistic insight into the non-linear processes driving the observed linear trends. On an international scale, our findings provide a high-resolution, regional-scale validation of broader Mediterranean-wide analyses. Cook et al. (2016), in their landmark 900-year drought atlas, identified the recent period as the most severe and widespread drought episode in the last millennium. Our analysis provides a granular view of how this macro-regional trend is manifesting in Northwestern Algeria: through the near-complete dominance of the ‘Hot & Very Dry’ regime during the summer months and its increasing encroachment into the spring and autumn shoulder seasons.
Furthermore, our finding of a strong link between the ‘Hot & Very Dry’ regime and the positive phase of the North Atlantic Oscillation (r = 0.58, p < 0.01) provides a direct regional manifestation of the large-scale circulation changes highlighted by Ben-Ari et al. (2018) as the primary driver of recent extreme droughts in the Western Mediterranean. Our regime-based analysis thus serves as a crucial bridge, connecting the large-scale atmospheric drivers identified in international studies to specific, observable, and recurrent weather patterns at the regional level, a connection that is essential for developing credible local adaptation strategies.
4.4. Methodological considerations and robustness
It is important to acknowledge the methodological choices made in this study and their implications. The parameters for the concept drift score (α=0.4, β=0.3, γ=0.3) were weighted to prioritize changes in state frequency, reflecting our focus on the occurrence of extreme regimes. A comprehensive sensitivity analysis confirmed that the detection of major shifts is robust to moderate variations (±0.1) in these weights. Similarly, the CUSUM threshold (k=4) was selected after testing a range of values (k=3 to 5), with k=4 providing the best balance between signal detection and noise rejection for this specific dataset. The choice of four hidden states was strongly supported by the BIC, which showed a distinct minimum at N=4 (ΔBIC = 23.6 compared to N=5), indicating that a more complex model was not justified by the data.
Regarding the last period (2020-2024): We acknowledge that this period contains only 5 years of data compared to 10 years for the other periods. To assess whether this asymmetry biases our results, we conducted a bootstrap analysis by randomly subsampling 5-year periods from the 1990s, 2000s, and 2010s data and recalculating the concept drift scores. The results showed that the drift scores for the 2010s→2020s transition remain within the ‘Major Shift’ category in 94% of bootstrap iterations, confirming that the observed changes are not artifacts of the shorter time window.
5. Conclusion
This study has demonstrated the critical importance of employing non-stationary, regime-based methods for climate change detection in semi-arid systems. Our integrated framework, combining NSHMM, Bayesian Concept Drift, and CUSUM analysis, has provided indisputable evidence of abrupt, non-linear shifts in the climate of northwestern Algeria a reality entirely missed by conventional linear tests such as Mann-Kendall (p = 0.16) and ANOVA (p > 0.60), which misleadingly suggest a stable climate.
Our analysis reveals that the climate system is not gradually warming but fundamentally reorganizing. The frequency of the extreme ‘Hot & Very Dry’ regime has increased by 45% since the 1990s, while its average duration has lengthened by 44%, from 3.2 to 4.6 months. These structural changes are confirmed by the detection of three major concept drifts, with scores reaching 0.80, and by 113 changepoints identified by CUSUM analysis. The significant correlation with the North Atlantic Oscillation (r = 0.58, p < 0.01) provides a physical mechanism linking regional changes to large-scale atmospheric dynamics.
The operationalization of these findings into a Probabilistic Drought Early Warning System (DEWS), capable of issuing grid-point-level risk forecasts indicating transition probabilities into the ‘Hot & Very Dry’ drought regime reaching up to 90% at the most vulnerable interior locations during peak summer months, offers a robust foundation for proactive, regime-aware adaptation strategies (Kareiva et al., 2007; Lobell et al., 2008). Future work should focus on coupling these regime models with crop simulation models to provide direct forecasts of agricultural impacts (Challinor et al., 2009; Smit & Wandel, 2006) and on integrating satellite remote sensing data to enhance spatial resolution.
6. References
Akaike, H., 1974. A new look at the statistical model identification. IEEE Transactions on Automatic Control, 19(6): 716-723. https://doi.org/10.1109/TAC.1974.1100705
Baum, L. E., Petrie, T., Soules, G., Weiss, N., 1970. A maximization technique occurring in the statistical analysis of probabilistic functions of Markov chains. The Annals of Mathematical Statistics, 41(1): 164-171. https://doi.org/10.1214/aoms/1177697196
Ben-Ari, T., Boé, J., Ciais, P., Lecerf, R., Van der Velde, M., Makowski, D., 2018. Causes and implications of the unforeseen 2016 extreme yield loss in the breadbasket of France. Nature Communications, 9(1): 1627. https://doi.org/10.1038/s41467-018-04087-x
Bracken, C., Rajagopalan, B., Zagona, E., 2014. A hidden Markov model combined with climate indices for multidecadal streamflow simulation. Water Resources Research, 50(10): 7733-7746. https://doi.org/10.1002/2014WR015567
Challinor, A. J., Watson, J., Lobell, D. B., Howden, S. M., Smith, D. R., Chhetri, N., 2014. A meta-analysis of crop yield under climate change and adaptation. Nature Climate Change, 4(4): 287-291. https://doi.org/10.1038/nclimate2153
Cohn, T. A., Lins, H. F., 2005. Nature’s style: Naturally trendy. Geophysical Research Letters, 32(23): L23402. https://doi.org/10.1029/2005GL024476
Cook, B. I., Anchukaitis, K. J., Touchan, R., Meko, D. M., Cook, E. R., 2016. Spatiotemporal drought variability in the Mediterranean over the last 900 years. Journal of Geophysical Research: Atmospheres, 121(5): 2060-2074. https://doi.org/10.1002/2015JD023929
Dempster, A. P., Laird, N. M., Rubin, D. B., 1977. Maximum likelihood from incomplete data via the EM algorithm. Journal of the Royal Statistical Society: Series B (Methodological), 39(1): 1-38. https://doi.org/10.1111/j.2517-6161.1977.tb01600.x
Gao, Y., Markkanen, T., Aurela, M., Mammarella, I., Thum, T., Tsuruta, A., Yang, H., Aalto, T., 2019. Response of water use efficiency to summer drought in a boreal Scots pine forest in Finland. Biogeosciences, 16(23): 4499-4514. https://doi.org/10.5194/bg-16-4499-2019
Greene, A. M., Robertson, A. W., Kirshner, S., 2008. Analysis of Indian monsoon daily rainfall on subseasonal to multidecadal time-scales using a hidden Markov model. Quarterly Journal of the Royal Meteorological Society, 134(633): 875-887. https://doi.org/10.1002/qj.254
Hamed, K. H., Rao, A. R., 1998. A modified Mann-Kendall trend test for autocorrelated data. Journal of Hydrology, 204(1-4): 182-196. https://doi.org/10.1016/S0022-1694(97)00125-X
Hersbach, H., Bell, B., Berrisford, P., Hirahara, S., Horányi, A., Muñoz-Sabater, J., Nicolas, J., Peubey, C., Radu, R., Schepers, D., Simmons, A., Soci, C., Abdalla, S., Abellan, X., Balsamo, G., Bechtold, P., Biavati, G., Bidlot, J., Bonavita, M., De Chiara, G., Dahlgren, P., Dee, D., Diamantakis, M., Dragani, R., Flemming, J., Forbes, R., Fuentes, M., Geer, A., Haimberger, L., Healy, S., Hogan, R. J., Hólm, E., Janisková, M., Keeley, S., Laloyaux, P., Lopez, P., Lupu, C., Radnoti, G., de Rosnay, P., Rozum, I., Vamborg, F., Villaume, S., Thépaut, J.-N., 2020. The ERA5 global reanalysis. Quarterly Journal of the Royal Meteorological Society, 146(730): 1999-2049. https://doi.org/10.1002/qj.3803
Hughes, J. P., Guttorp, P., 1994. A class of stochastic models for relating synoptic atmospheric patterns to regional hydrologic phenomena. Water Resources Research, 30(5): 1535-1546. https://doi.org/10.1029/93WR02983
IPCC, 2021. Climate Change 2021: The Physical Science Basis. Contribution of Working Group I to the Sixth Assessment Report of the Intergovernmental Panel on Climate Change. Cambridge University Press, Cambridge, United Kingdom and New York, NY, USA. https://doi.org/10.1017/9781009157896
Kareiva, P., Watts, S., McDonald, R., Boucher, T., 2007. Domesticated nature: Shaping landscapes and ecosystems for human welfare. Science, 316(5833): 1866-1869. https://doi.org/10.1126/science.1140170
Kendall, M. G., 1975. Rank Correlation Methods. Charles Griffin, London, UK, 202 pp.
Lobell, D. B., Burke, M. B., Tebaldi, C., Mastrandrea, M. D., Falcon, W. P., Naylor, R. L., 2008. Prioritizing climate change adaptation needs for food security in 2030. Science, 319(5863): 607-610. https://doi.org/10.1126/science.1152339
Mann, H. B., 1945. Nonparametric tests against trend. Econometrica, 13(3): 245-259. https://doi.org/10.2307/1907187
Olesen, J. E., Bindi, M., 2002. Consequences of climate change for European agricultural productivity, land use and policy. European Journal of Agronomy, 16(4): 239-262. https://doi.org/10.1016/S1161-0301(02)00004-7
Page, E. S., 1954. Continuous inspection schemes. Biometrika, 41(1-2): 100-115. https://doi.org/10.1093/biomet/41.1-2.100
Pettitt, A. N., 1979. A non-parametric approach to the change-point problem. Journal of the Royal Statistical Society: Series C (Applied Statistics), 28(2): 126-135. https://doi.org/10.2307/2346729
Rabiner, L. R., 1989. A tutorial on hidden Markov models and selected applications in speech recognition. Proceedings of the IEEE, 77(2): 257-286. https://doi.org/10.1109/5.18626
Robertson, A. W., Kirshner, S., Smyth, P., 2004. Downscaling of daily rainfall occurrence over northeast Brazil using a hidden Markov model. Journal of Climate, 17(22): 4407-4424. https://doi.org/10.1175/JCLI-3216.1
Schwarz, G., 1978. Estimating the dimension of a model. The Annals of Statistics, 6(2): 461-464. https://doi.org/10.1214/aos/1176344136
Sen, P. K., 1968. Estimates of the regression coefficient based on Kendall’s tau. Journal of the American Statistical Association, 63(324): 1379-1389. https://doi.org/10.1080/01621459.1968.10480934
Smit, B., Wandel, J., 2006. Adaptation, adaptive capacity and vulnerability. Global Environmental Change, 16(3): 282-292. https://doi.org/10.1016/j.gloenvcha.2006.03.008
Taïbi, A. N., Henia, L., Abderrahmane, M. K., 2017. Drought in the Maghreb: analysis of the spatiotemporal variability and impacts. Arabian Journal of Geosciences, 10(15): 327. https://doi.org/10.1007/s12517-017-3106-7
Theil, H., 1950. A rank-invariant method of linear and polynomial regression analysis. Indagationes Mathematicae, 12(85): 173.
Touchan, R., Anchukaitis, K. J., Meko, D. M., Attalah, S., Baisan, C., Aloui, A., 2008. Long term context for recent drought in northwestern Africa. Geophysical Research Letters, 35(13): L13705. https://doi.org/10.1029/2008GL034264
Vicente-Serrano, S. M., Beguería, S., López-Moreno, J. I., 2010. A multiscalar drought index sensitive to global warming: The Standardized Precipitation Evapotranspiration Index. Journal of Climate, 23(7): 1696-1718. https://doi.org/10.1175/2009JCLI2909.1
Viterbi, A., 1967. Error bounds for convolutional codes and an asymptotically optimum decoding algorithm. IEEE Transactions on Information Theory, 13(2): 260-269. https://doi.org/10.1109/TIT.1967.1054010
Zucchini, W., MacDonald, I. L., Langrock, R., 2016. Hidden Markov Models for Time Series: An Introduction Using R, 2nd ed. Chapman and Hall/CRC, Boca Raton, FL, USA, 370 pp. https://doi.org/10.1201/b20790
Ben Aoun, W., Biavetti, I., Bussay, A., Cerrani, I., Claverie, M., De Palma, P., Fumagalli, D., Henin, R., Luque Reyes, J., Morel, J., Niemeyer, S., Nisini, L., Ozalp, O., Panarello, L., Rossi, M., Seguini, L., Tarnavsky, E., Thiemig, V., Todoroff, P., Zucchini, A., 2025. JRC MARS Bulletin – Crop monitoring in Europe – May 2025 – Vol. 33 No 4. Publications Office of the European Union, Luxembourg. https://doi.org/10.2760/1115198
Biavetti, I., Bussay, A., Cerrani, I., Claverie, M., De Palma, P., Fumagalli, D., Henin, R., Luque Reyes, J., Morel, J., Niemeyer, S., Nisini, L., Ozalp, O., Panarello, L., Rossi, M., Seguini, L., Tarnavsky, E., Thiemig, V., Todoroff, P., Zucchini, A., 2025. JRC MARS Bulletin – Crop monitoring in Europe – March 2025 – Vol. 33 No 2. Publications Office of the European Union, Luxembourg. JRC141319.
European Commission Joint Research Centre, 2025. Severe drought in Africa persists and is expected to worsen. JRC/Copernicus Global Drought Observatory Report, 23 April 2025. Available at: https://joint-research-centre.ec.europa.eu/jrc-news-and-updates/severe-drought-africa-persists-and-expected-worsen-2025-04-23_en
FAO, 2026. GIEWS Country Brief: Algeria. Reference Date: 29 January 2026. Food and Agriculture Organization of the United Nations, Rome. Available at: https://www.fao.org/giews/countrybrief/country.jsp?code=DZA
NOAA National Centers for Environmental Information, 2026. North Atlantic Oscillation (NAO) Index. Available at: https://www.ncei.noaa.gov/access/monitoring/nao/
Seager, R., Liu, H., Osborn, T. J., Kushnir, Y., Nakamura, J., Wu, Y., 2026. Mediterranean Drying by a Positive North Atlantic Oscillation Trend over the Last 65 Years Is an Extreme Outlier in the CMIP6 Multimodel Ensemble. Journal of Climate, 39(2): 785–804. https://doi.org/10.1175/JCLI-D-25-0359.1
USDA Foreign Agricultural Service, 2025. Grain and Feed Annual: Algeria. GAIN Report AG2025-0002, 24 March 2025. United States Department of Agriculture, Washington, DC.
World Bank, 2025. Algeria Economic Update, November 2025. The World Bank Group, Washington, DC.