https://doi.org/10.36253/ijam-4112
Received: April 18, 2026; Accepted: July 6, 2026; Published: September 15, 2026
Agroclimatic controls on robusta coffee yield under future climate scenarios in the Srepok River Basin
1 Faculty of Interdisciplinary Science, University of Science, Ho Chi Minh City, Vietnam
2 Faculty of Environment, University of Science, Ho Chi Minh City, Vietnam
3 Vietnam National University, Ho Chi Minh City, Vietnam
4 Institute of Applied Technology and Sustainable Development, Nguyen Tat Thanh University, Ho Chi Minh City, Vietnam
*Corresponding author. Email: phamloi@hcmus.edu.vn
Abstract. Climate change poses significant challenges to coffee production in the Central Highlands of Vietnam, the country’s primary coffee-growing region. This study assesses the impacts of climate change on Robusta coffee yield in the Srepok River Basin using meteorological and yield data from the 2001–2020 period at five study sites: Buon Ho, Dak Mil, M’Drak, Buon Ma Thuot, and Lak. The Least Absolute Shrinkage and Selection Operator (LASSO) variable selection method was employed to identify key climatic factors from 72 variables aggregated at monthly, growing season, and annual scales. Results indicate that water balance variables (potential evapotranspiration (PET), water surplus (SUR)) and extreme temperature indices play a dominant role in determining yield, while seasonal and monthly variables account for 68% of selected predictors, reflecting the existence of “sensitive climate windows” throughout the coffee phenological cycle. Four machine learning algorithms (Artificial Neural Network, Random Forest, Support Vector Regression, and eXtreme Gradient Boosting) were trained for yield simulation, with SVR and XGBoost demonstrating superior performance (Nash–Sutcliffe Efficiency > 0.75; R² > 0.84). Future climate scenarios (2026–2100) were generated by downscaling three CMIP6 General Circulation Models (GCMs: CanESM5, MPI-ESM1-2-HR, and NorESM2-MM) under four Shared Socioeconomic Pathways (SSP1-1.9, SSP1-2.6, SSP2-4.5, and SSP5-8.5). Simulation results exhibit marked spatial heterogeneity in climate change impacts: Dak Mil emerges as the most vulnerable area, with potential yield reductions reaching 58.10% by the end of the century, while M’Drak, which has the highest baseline water surplus, shows the smallest fluctuations. This research provides a scientific basis for production planning and the formulation of adaptive strategies to ensure the sustainable development of the coffee sector under a changing climate.
Keywords: climate change, LASSO regression, machine learning, Robusta coffee, yield prediction.
Contents
2.2.1. LASSO-Based variable selection
2.2.2. Climate scenario development using SDSM
2.2.3. Machine learning models
3.1. Historical climate and water balance conditions (2001–2020)
3.2. Projected climate change in the Srepok River Basin (2026-2100)
3.3. Climate variable selection using LASSO
3.4. Development and evaluation of coffee yield simulation models
3.5. Projected impacts of climate change on coffee yield
4.1. Role of water balance and climate-sensitive windows in determining yield
4.2. Machine learning model performance and methodological contributions
4.3. Mechanisms underlying spatial heterogeneity in projected yield impacts
4.4. Comparison with other studies
5. Conclusions and recommendations
Highlights:
- –Water-balance variables (PET and SUR) are key drivers of Robusta coffee yield.
- –Seasonal and monthly variables account for 68% of LASSO-selected predictors.
- –SVR and XGBoost achieve very good performance (NSE > 0.75, R² > 0.84) across all five stations.
- –Dak Mil faces up to 58% yield loss under SSP5-8.5, while M’Drak remains the most resilient site.
- –PET-driven climatic stress is a key determinant of future yield vulnerability.
1. Introduction
Climate change is posing increasing challenges to tropical agricultural systems, particularly for high-value perennial crops such as coffee. As the world’s largest producer of Robusta coffee, Vietnam contributes more than 40% of global Robusta production (ICO, 2023; Dinh et al., 2022), with most cultivation concentrated in the Central Highlands. In recent decades, coffee production in Vietnam has become increasingly exposed to climate-related hazards, including prolonged droughts, heatwaves, and extreme rainfall events, resulting in substantial reductions in yield and bean quality (Arias et al., 2021; Varma et al., 2025). Recent studies indicate that climate change is no longer a future threat but an ongoing challenge affecting coffee-growing regions worldwide (Bilen et al., 2022; Della Peruta et al., 2025).
Although Robusta coffee (Coffea canephora) is generally considered more heat-tolerant than Arabica coffee, growing evidence suggests that its productivity remains highly sensitive to climatic variability. Based on observations from 798 coffee farms in Vietnam and Indonesia, Kath et al. (2020) reported that each 1°C increase beyond the optimal temperature threshold could reduce Robusta yield by approximately 14%. Seasonal fluctuations in rainfall and temperature have also been associated with production losses ranging from 6% to 22% in Indonesia (Sarvina, 2021). At the global scale, climate projections indicate that Arabica coffee yields may decline by 23–35% in Latin America and 16–21% in Africa during 2036–2065 (Della Peruta et al., 2025), while similar trends have been reported for Robusta-growing regions in Southeast Asia (Richardson et al., 2023).
These impacts reflect the strong dependence of coffee growth and productivity on temperature and water availability during specific phenological stages. Previous studies have shown that flowering, fruit development and maturation respond differently to climatic stresses. Kath et al. (2023) demonstrated that shifts in flowering timing substantially alter the response of Robusta coffee to climate stress and may reduce the predictive performance of yield models. Such findings suggest the existence of climate-sensitive windows, during which short-term climatic anomalies may exert stronger effects on coffee yield than annual climatic averages (Dinh et al., 2022). However, quantitative assessments of these climate-sensitive windows for Robusta coffee remain limited, particularly at seasonal and monthly scales.
Despite increasing attention to climate change impacts on coffee production, several important knowledge gaps remain. First, most previous studies have relied on annual climate indicators, while the influence of climate variability during specific phenological stages has not been adequately quantified. Second, climate-sensitive windows of Robusta coffee remain poorly understood, particularly in tropical monsoon regions. Third, watershed-scale assessments integrating high-temporal-resolution climate variables with advanced machine-learning techniques remain scarce, especially in Southeast Asia. To the best of our knowledge, no previous study has simultaneously combined monthly- and seasonal-resolution climate indicators, LASSO-based feature selection, multiple machine-learning algorithms, and CMIP6 multi-model projections to quantify climate change impacts on Robusta coffee yield at the watershed scale in Vietnam’s Central Highlands.
The Srepok River Basin was selected as a representative study area to address these research gaps. The basin is one of the most important coffee-producing regions in Vietnam, covering large cultivation areas in Dak Lak and Dak Nong provinces. In addition, substantial variations in elevation, rainfall distribution and water availability create distinct microclimatic conditions across the basin, potentially leading to different yield responses under climate change. Recent studies have identified coffee cultivation as a major driver of unmet water demand during the dry season in several parts of the basin (Sam et al., 2025), while CMIP6 projections indicate increasing frequencies of droughts and extreme rainfall events in the future (Do et al., 2024; Thao et al., 2024). However, the implications of these climatic changes for coffee productivity at the watershed scale remain insufficiently understood.
Therefore, this study aims to (i) identify the most influential climatic factors affecting Robusta coffee yield at monthly and seasonal scales using the Least Absolute Shrinkage and Selection Operator (LASSO) method; (ii) develop and compare four machine-learning models, including Artificial Neural Network (ANN), Random Forest (RF), Support Vector Regression (SVR), and eXtreme Gradient Boosting (XGBoost), to characterize nonlinear climate–yield relationships; and (iii) assess future climate change impacts on coffee yield under four CMIP6 scenarios representing low (SSP1-1.9 and SSP1-2.6), medium (SSP2-4.5) and high (SSP5-8.5) emission pathways. The findings are expected to provide a scientific basis for climate adaptation planning, sustainable coffee production, and regional agricultural management in the Central Highlands of Vietnam.
2. Materials and methods
2.1. Materials
2.1.1. Data collection
This study employs daily meteorological data collected from five observation stations belonging to the National Hydro-Meteorological Network in the Central Highlands region, including Buon Ma Thuot, Buon Ho, M’Drak, Lak stations (Dak Lak province) and Dak Mil station (Dak Nong province) (Figure 1). These stations were selected based on spatial distribution criteria, representing different climatic sub-regions within the Srepok River Basin while ensuring continuous observation records during the 1990-2020 period. The collected data comprise four primary meteorological variables: daily precipitation (mm), mean daily air temperature (°C), daily maximum air temperature (°C), and daily minimum air temperature (°C).
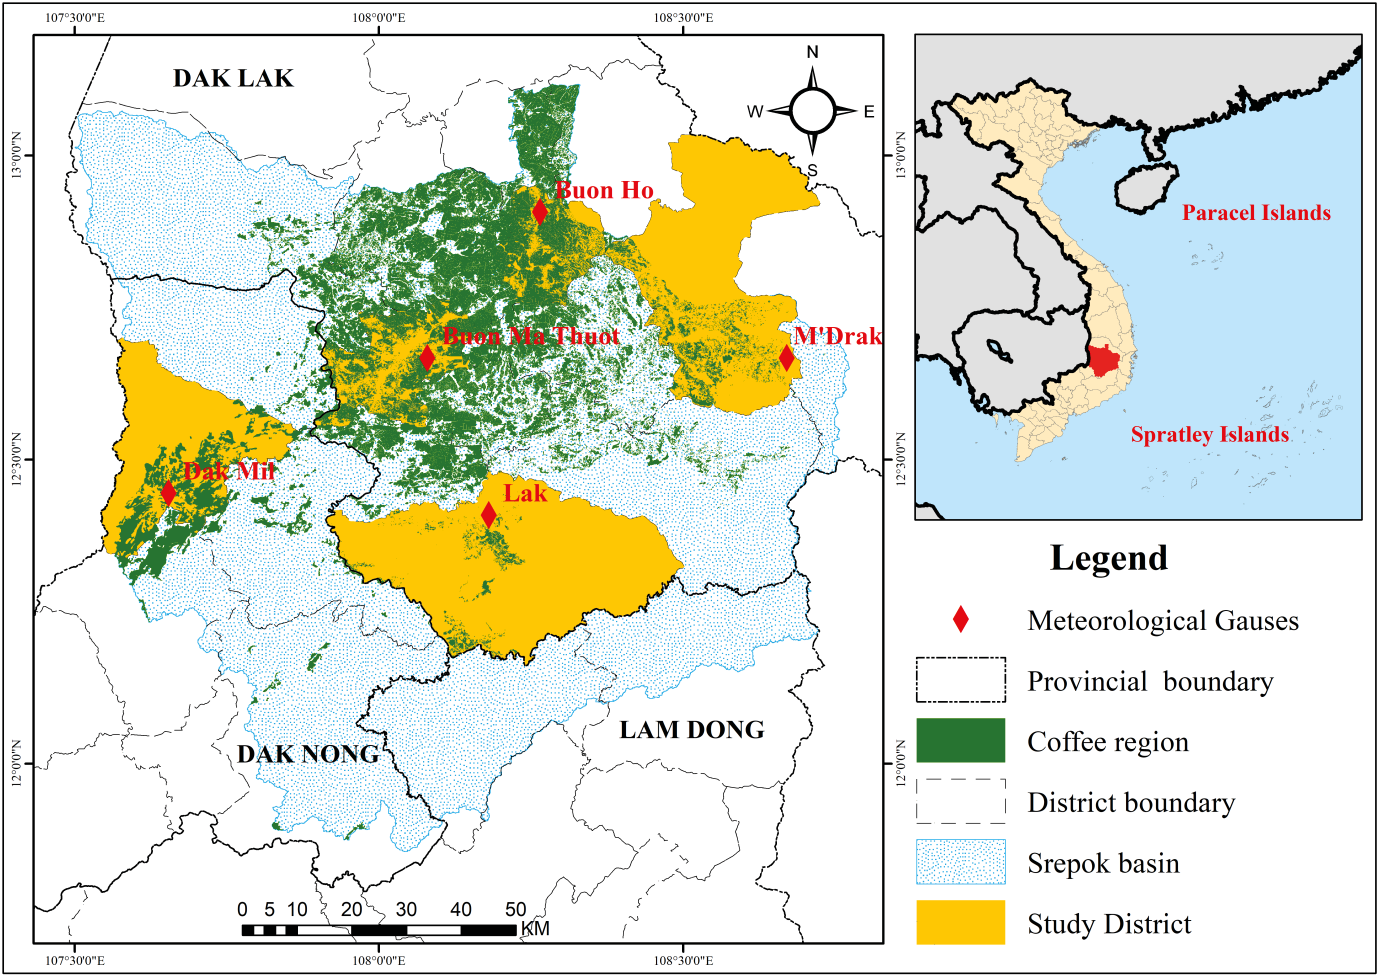
Concurrently with meteorological data, annual average coffee yield data for the 2001-2020 period were collected from the Statistical Yearbooks of Dak Lak and Dak Nong provinces. Yield data correspond to five district-level administrative units where meteorological stations are located, including Buon Ma Thuot city, Buon Ho town, M’Drak district, Ea Kar district (Dak Lak province), and Dak Mil district (Dak Nong province). These areas represent key coffee-producing regions with stable cultivation areas throughout the study period. The spatial and temporal correspondence between the two datasets enables the establishment of quantitative relationships between climatic factors and coffee yield in the study area.
Water balance indices (PET, DEF, SUR) were calculated at the point scale of each meteorological station. Spatial interpolation was not applied; each station represents the agroclimatic conditions of the corresponding administrative district from which coffee yield statistics were sourced. Future water balance indices were derived from SDSM-downscaled daily climate series at each station location.
Three CMIP6 General Circulation Models were selected for future climate projections: CanESM5 (Canada), MPI-ESM1-2-HR (Germany), and NorESM2-MM (Norway). These models were chosen based on: (i) their demonstrated skill in simulating Southeast Asian monsoon dynamics in CMIP6 evaluations (Do et al., 2024); (ii) their representation of a range of climate sensitivities – CanESM5 (high), NorESM2-MM (moderate), and MPI-ESM1-2-HR (low) – ensuring a spread of projections that bounds scenario uncertainty; and (iii) the availability of daily output variables required for SDSM downscaling. Four SSP scenarios (SSP1-1.9, SSP1-2.6, SSP2-4.5, SSP5-8.5) were applied to represent the full range from strong mitigation to high-emission pathways.
2.1.2. Water balance indices
Based on the collected meteorological data, this study calculated three additional water balance indices crucial for analyzing climate impacts on coffee yield: potential evapotranspiration (PET), water deficit (DEF), and water surplus (SUR) (Jayakumar et al., 2017).
PET was estimated using the FAO Penman–Monteith method, the standard procedure recommended by the Food and Agriculture Organization (FAO) for calculating reference evapotranspiration (Allen et al., 1998). DEF was used to quantify crop water stress and AET. SUR was defined as the amount of water remaining after crop evapotranspiration requirements were satisfied (P − AET), representing excess water available for soil moisture recharge and potential runoff generation. These indices provide an integrated representation of water availability conditions affecting coffee growth and productivity. All calculations were performed on a monthly basis according to Equations (1)–(6).
If (P - PET)i < 0 = (1)
If (P - PET)i ≥ 0 = (2)
ATLi = STOi - STOi-1(3)
AETi = (4)
DEF = PET - AET(5)
SURi = (6)
where (Pi) is monthly precipitation (mm), (PETi) is monthly potential evapotranspiration (mm), (AETi) is monthly actual evapotranspiration (mm), (DEFi) is monthly water deficit (mm), and (SURi) is monthly water surplus (mm).
2.2. Methodology
2.2.1. LASSO-Based variable selection
This study examined 72 meteorological variables classified into three groups: (i) 8 annual variables, (ii) 16 variables corresponding to four coffee phenological stages (flowering, fruit development, ripening, and harvest), and (iii) 48 monthly variables (Table 1). The simultaneous inclusion of multiple correlated meteorological variables introduces the risk of multicollinearity, which compromises the accuracy and stability of conventional regression models. Therefore, this study employed the Least Absolute Shrinkage and Selection Operator (LASSO) regression method proposed by Tibshirani (1996) to select the set of variables genuinely influencing coffee yield (Figure 2).
| No. | Symbol | Description | Unit |
|---|---|---|---|
| I | Annual variables (8 variables) | ||
| 1 | DayR | Number of rainy days per year | days |
| 2 | R | Annual total rainfall | mm |
| 3 | Tmax | Annual mean maximum temperature | °C |
| 4 | Tmin | Annual mean minimum temperature | °C |
| 5 | Tavg | Annual mean temperature | °C |
| 6 | PET | Annual potential evapotranspiration | mm |
| 7 | DEF | Annual water deficit | mm |
| 8 | SUR | Annual water surplus | mm |
| II | Growing season variables (16 variables) | ||
| 9-12 | RS1, RS4, RS9, RS11 | Rainfall in flowering (Jan-Mar), fruit development (Apr-Aug), ripening (Sep-Oct), harvest (Nov-Dec) stages | mm |
| 13-16 | TxS1, TxS4, TxS9, TxS11 | Maximum temperature in each growing stage | °C |
| 17-20 | TmS1, TmS4, TmS9, TmS11 | Minimum temperature in each growing stage | °C |
| 21-24 | TaS1, TaS4, TaS9, TaS11 | Mean temperature in each growing stage | °C |
| III | Monthly variables (48 variables) | ||
| 25-36 | R1 - R12 | Monthly rainfall from January to December | mm |
| 37-48 | Tx1 - Tx12 | Monthly maximum temperature from January to December | °C |
| 49-60 | Tm1 - Tm12 | Monthly minimum temperature from January to December | °C |
| 61-72 | Ta1 - Ta12 | Monthly mean temperature from January to December | °C |
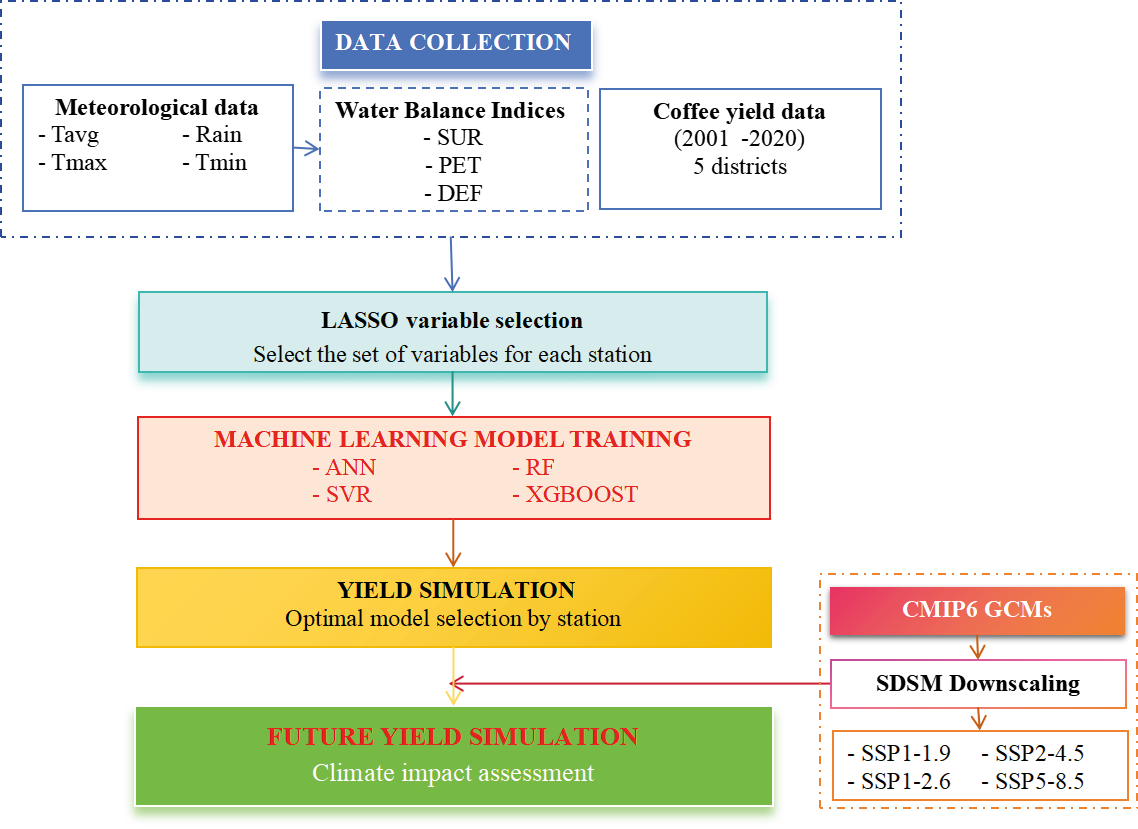
LASSO is a regularization technique that operates by shrinking the regression coefficients of less important variables toward zero, thereby retaining only variables with non-zero coefficients in the final model. The objective function of LASSO is expressed as follows:
where:
yi is the observed value of the dependent variable at observation i
xij is the value of the j-th independent variable at observation i
βj is the regression coefficient of the j-th variable
n is the number of observations
p is the number of input variables
λ is the regularization parameter controlling the shrinkage intensity
The component λ Σ|βj| (L1 penalty) plays a critical role in forcing the coefficients of less important variables toward zero. As λ increases, the shrinkage intensity intensifies, reducing the number of retained variables. Conversely, when λ = 0, the LASSO model reverts to ordinary linear regression (James et al., 2013).
In this study, LASSO was applied separately to each observation station to assess the local specificity of climate-yield relationships within the Srepok River Basin. The optimal λ value was selected through 10-fold cross-validation to ensure optimal model generalization capability (Hastie et al., 2009). LASSO analysis results identified the most important meteorological variables genuinely affecting coffee yield, eliminating statistically insignificant variables and those exhibiting multicollinearity, thereby providing a foundation for subsequent quantitative analyses in the next research steps.
2.2.2. Climate scenario development using SDSM
To assess future climate change impacts on coffee yield, this study employed the Statistical DownScaling Model (SDSM) (Wilby et al., 2002) to downscale climate information from General Circulation Models (GCMs) to the local scale at observation stations. This method establishes statistical relationships between large-scale atmospheric variables (predictors) and local climate variables (predictands) through a transfer function:
R = F(L)(8)
The implementation procedure comprises five steps: (i) quality control and data transformation; (ii) predictor selection based on correlation analysis between NCEP/NCAR reanalysis data and station observations; (iii) model calibration; (iv) model validation; and (v) future climate scenario generation. SDSM simulation results were compared with observed data using three statistical indicators: coefficient of determination (R²), root mean square error (RMSE), and Nash-Sutcliffe Efficiency (NSE) (Moriasi et al., 2007).
Following validation, future climate scenarios (2026-2100) were developed using three CMIP6 GCMs under four SSP scenarios described in Section 2.1.1
To quantify uncertainty in climate projections, this study applied a multi-model ensemble approach, which enables quantification of the range of climate projections arising from differences in GCM structure and parameterization (Tebaldi & Knutti, 2007). The ensemble mean (μ) represents the central tendency of climate change, while the dispersion among models is quantified through standard deviation (σ) and coefficient of variation (CV). The coefficient of variation is calculated as:
CV = (σ/μ) × 100%
where μ is the mean value of simulations from the three GCMs and σ is the corresponding standard deviation. Higher CV values indicate greater uncertainty among climate models for specific scenarios and projection periods. This multi-model ensemble approach minimizes bias associated with reliance on any single climate model while providing a comprehensive picture of the uncertainty range in climate projections, thereby establishing a robust foundation for subsequent assessments of climate change impacts on coffee yield.
2.2.3. Machine learning models
To quantify the impacts of climate change on coffee yield, this study applied machine learning (ML) models to establish nonlinear relationships between the climate variables selected through LASSO and actual coffee yield at five observation stations during the 2001-2020 period. Climatic factors often interact in nonlinear and interdependent ways; consequently, traditional linear regression methods may inadequately capture these complex relationships. In recent years, machine learning models have demonstrated high effectiveness in crop yield forecasting due to their capacity to process multidimensional data and identify nonlinear patterns within datasets (Jeong et al., 2016; Khaki & Wang, 2019). The dataset was divided into training (70%) and testing (30%) subsets. Hyperparameter optimization for all models was conducted using grid search combined with five-fold cross-validation. Model performance was evaluated using Nash–Sutcliffe efficiency (NSE), coefficient of determination (R²), root mean square error (RMSE), and mean absolute error (MAE). The best-performing model at each station was subsequently used for future coffee yield simulations under climate change scenarios.
Four machine-learning algorithms were evaluated, including Artificial Neural Network (ANN), Random Forest (RF), Support Vector Regression (SVR), and eXtreme Gradient Boosting (XGBoost). ANN was selected for its capability to approximate complex nonlinear relationships between climate variables and crop yield (Cybenko, 1989). RF is an ensemble tree-based method that improves predictive accuracy through bootstrap aggregation and random feature selection (Breiman, 2001). SVR constructs nonlinear regression functions using kernel transformations and has proven effective for environmental and agricultural applications with limited datasets (Smola & Schölkopf, 2004). XGBoost is a gradient-boosting algorithm that combines high predictive performance with built-in regularization to reduce overfitting (Chen & Guestrin, 2016).
Model hyperparameters were optimized using grid search and cross-validation. The algorithm with the highest predictive performance for each station was selected for subsequent climate impact simulations.
Water balance calculations and LASSO were performed in R v4.2.1. Climate downscaling used SDSM v5.3 (Wilby et al., 2002). Machine learning models (ANN, RF, SVR, XGBoost) were developed in RapidMiner Studio 10.3 . Summary figures were created in Microsoft Excel. Maps were produced using QGIS v3.28 LTR.
3. Results
3.1. Historical climate and water balance conditions (2001–2020)
The baseline period (2001–2020) revealed substantial climatic and hydrological heterogeneity across the five stations (Table 2). Mean annual potential evapotranspiration (PET) ranged from 1,113 mm yr⁻¹ at Dak Mil to 1,344 mm yr⁻¹ at Lak, while annual water deficit (DEF) varied between 45 and 137 mm yr⁻¹. M’Drak recorded the highest annual precipitation (2,135 mm yr⁻¹) and surplus water (SUR; 862 mm yr⁻¹), whereas Lak exhibited the highest mean annual temperature (24.7°C) and water deficit. Despite relatively low annual DEF values, monthly deficits during the dry season (November–April) frequently exceeded 80–150 mm month⁻¹, indicating substantial seasonal water stress and irrigation demand for coffee cultivation. These baseline differences highlight the spatial variability in climatic and water-balance conditions across the Srepok River Basin and provide the reference for interpreting future climate and yield projections.
| Station | PET (mm·yr⁻¹) | DEF (mm·yr⁻¹) | SUR (mm·yr⁻¹) | P (mm·yr⁻¹) | Tmax (°C) | Tmin (°C) | Tavg (°C) |
|---|---|---|---|---|---|---|---|
| Buon Ho | 1,137 | 57 | 499 | 1,595 | 27.4 | 19.6 | 22.8 |
| BMT | 1,270 | 93 | 654 | 1,825 | 29.8 | 20.9 | 24.1 |
| Dak Mil | 1,113 | 45 | 690 | 1,764 | 27.1 | 19.8 | 22.7 |
| M’Drak | 1,314 | 55 | 862 | 2,135 | 29.0 | 21.3 | 24.3 |
| Lak | 1,344 | 137 | 699 | 1,907 | 29.8 | 21.1 | 24.7 |
3.2. Projected climate change in the Srepok River Basin (2026-2100)
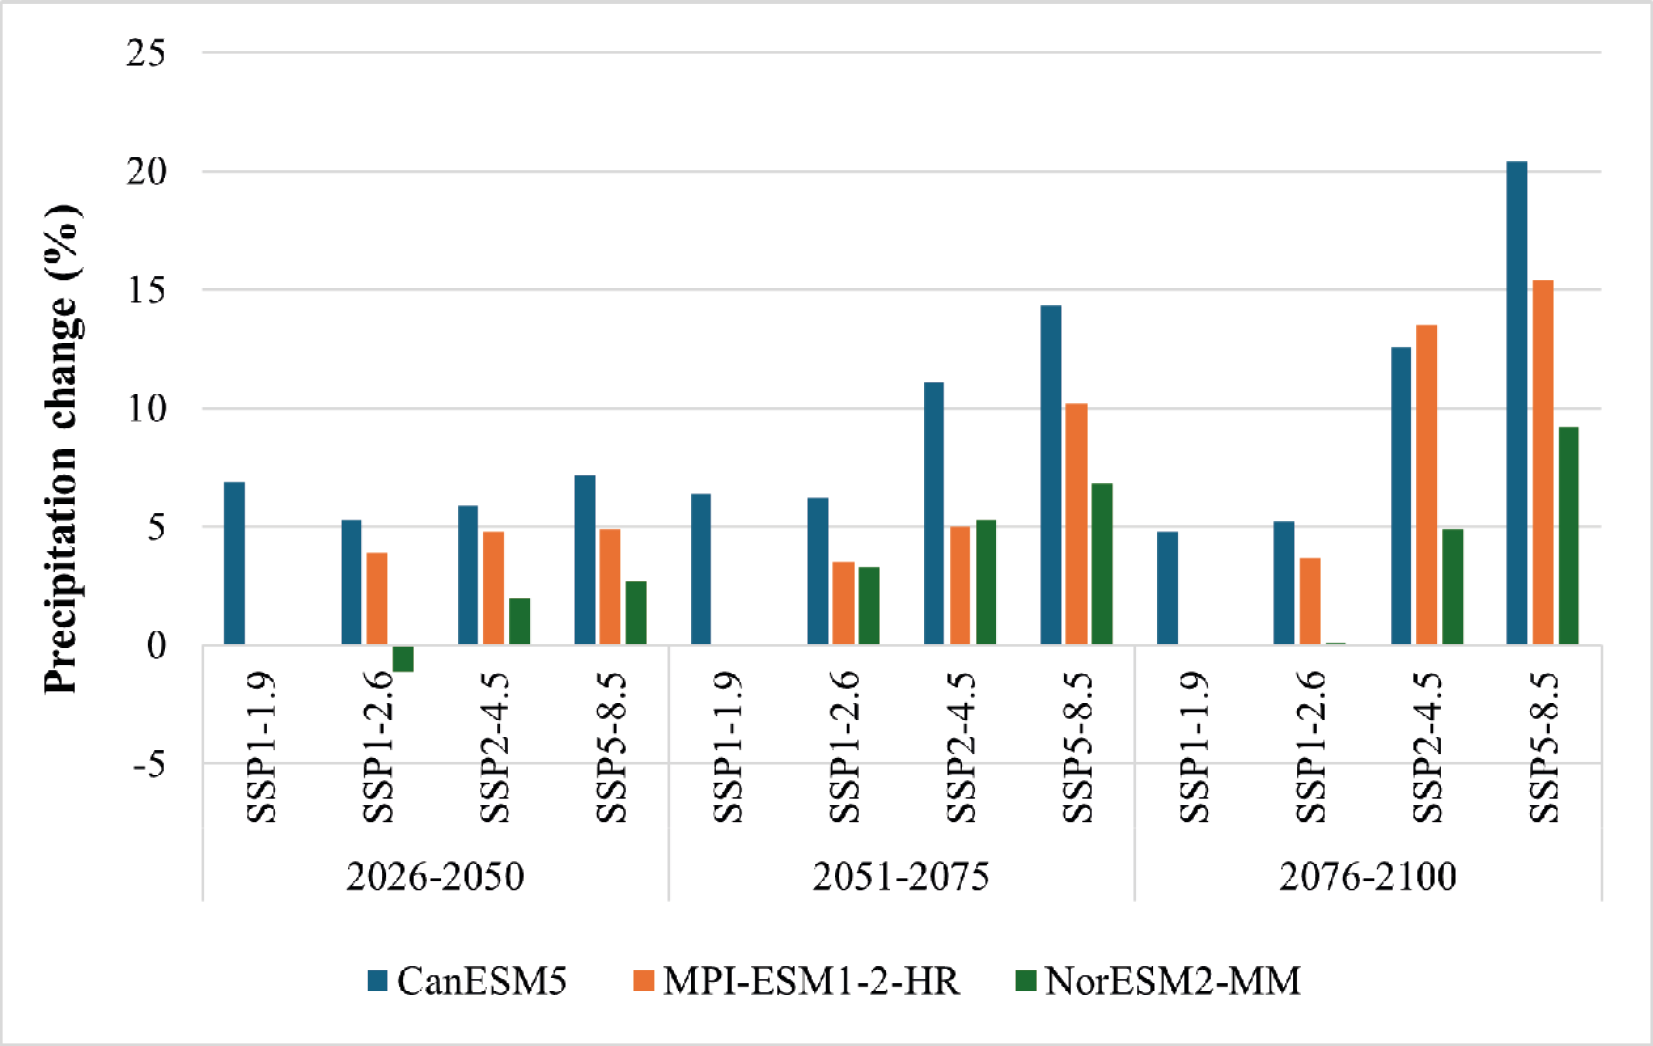
The constructed future climate scenarios (2026-2100) reveal increasing trends in both precipitation and temperature across all projection periods. Annual precipitation exhibits an increasing tendency under all scenarios, with changes ranging from 0.09% to 20.4% relative to the baseline period. Under the low-emission SSP1-1.9 scenario, precipitation increases by 4.8% to 6.9% by the end of the century. The SSP1-2.6 scenario shows more modest increases (0.09-6.2%), with the NorESM2-MM model projecting a slight decrease of 1.1% during 2026-2050. Under medium and high emission scenarios, precipitation increases are more pronounced: SSP2-4.5 projects increases of 2.0-12.6%, while SSP5-8.5 projects increases of 2.7-20.4% (Figure 3). The strongest increases occur in the late-century period (2076-2100) and are consistently associated with the CanESM5 model.
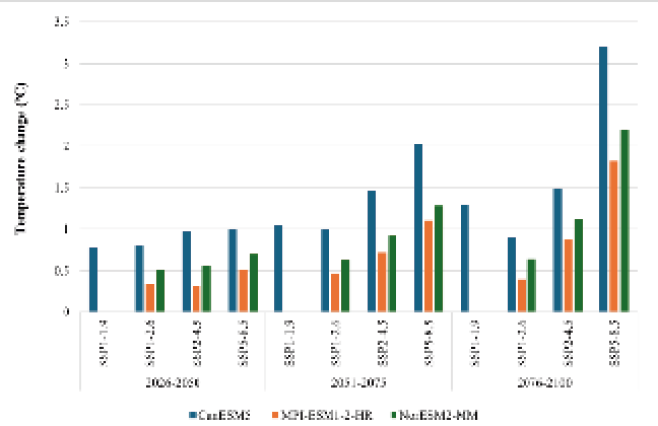
Similar to precipitation, mean annual temperature shows increasing trends across all scenarios. Temperature increases range from 0.3°C to 3.2°C depending on scenario and period. Under SSP1-1.9, temperatures increase by 0.8-1.3°C. The SSP1-2.6 scenario projects increases of 0.3-1.0°C. Under the medium-emission SSP2-4.5 scenario, temperatures rise by 0.3-1.5°C, while the high-emission SSP5-8.5 scenario records the most substantial increases of 0.5-3.2°C by the end of the century (Figure 4). Warming rates vary among models, with CanESM5 consistently projecting the highest temperature increases.
Uncertainty analysis reveals distinctly different structures among climate variables, as detailed in Table 3. For precipitation, scenario uncertainty dominates (46.04%), followed by internal variability (34.47%), indicating that future precipitation regimes are highly sensitive to greenhouse gas emission assumptions. For temperature variables, scenario uncertainty also plays a dominant role. Notably, Tmin exhibits the highest scenario uncertainty proportion (56.59%), while internal variability is minimal (1.16%), suggesting that minimum temperatures primarily respond to large-scale climate forcing. In contrast, Tmax and Tavg display more balanced uncertainty structures among sources, with scenario contributions of 33.34% and 43.73%, respectively, reflecting simultaneous influences from emission factors and internal climate system variability.
| Component | Precipitation | Tmax | Tmin | Tavg | ||||
|---|---|---|---|---|---|---|---|---|
| Variance | Contribution (%) | Variance | Contribution (%) | Variance | Contribution (%) | Variance | Contribution (%) | |
| Model | 14.16 | 6.63 | 0.08 | 12.10 | 0.13 | 22.68 | 0.10 | 16.83 |
| Scenario | 98.41 | 46.04 | 0.21 | 33.34 | 0.32 | 56.59 | 0.27 | 43.73 |
| Period | 27.49 | 12.86 | 0.14 | 22.40 | 0.11 | 19.57 | 0.15 | 23.93 |
| Internal | 73.67 | 34.47 | 0.20 | 32.15 | 0.01 | 1.16 | 0.09 | 15.51 |
| TOTAL | 213.73 | 100.00 | 0.62 | 100.00 | 0.57 | 100.00 | 0.61 | 100.00 |
The dominance of scenario uncertainty across all variables has a critical practical implication: the future climate trajectory of the Srepok Basin will be determined primarily by global emission pathways rather than by internal climate variability or model selection. For Tmin – a key determinant of Robusta coffee flowering success – the near-complete dependence on emission trajectory (56.59% scenario contribution, only 1.16% internal variability) means that ambitious mitigation efforts could substantially reduce thermal stress on coffee cultivation, whereas high-emission pathways will drive near-deterministic warming of minimum temperatures through the end of the century.
3.3. Climate variable selection using LASSO
LASSO regression was applied separately to each station to identify the set of climatic factors significantly influencing coffee yield in each distinct study area. The variable selection results are presented in Table 4.
| Buon Ho | Dak Mil | M’Drak | Buon Ma Thuot | Lak | |
|---|---|---|---|---|---|
| Annual | DayR | Tmax | Tmin | R | |
| PET | PET | PET | SUR | SUR | |
| Growing season | TmS9 | TaS4 | TaS1 | RS4 | RS4 |
| Monthly | R3 | R7 | R9 | R2 | |
| Tx9 | Tx2 | Tx6 | Tx5 | ||
| Tm8 | Tm10 | Tm1 | Tm1 | ||
| Ta7 | Ta7 | Ta4 |
The results reveal substantial spatial heterogeneity in the selected variable sets across stations. At Buon Ho, four variables were selected (PET, Tx9, Tm8, TmS9), indicating the dominant role of water balance and thermal extremes during the fruit ripening period (September–October). At Dak Mil and M’Drak, PET and growing-season temperature variables (TaS4 at Dak Mil; TaS1 at M’Drak) were identified as dominant predictors, reflecting the sensitivity of fruit development and flowering stages to thermal conditions at these stations. The selection of PET – rather than DEF – as the primary water balance predictor at Dak Mil and M’Drak is noteworthy: it indicates that the rate of evaporative demand, rather than the cumulative annual water deficit, governs yield variability at these stations, consistent with the relatively low baseline DEF values observed (45 and 55 mm·yr⁻¹, respectively; Table 2).
At Buon Ma Thuot and Lak, precipitation and water balance variables including SUR, RS4, and R9 appear alongside minimum temperature indices (Tmin, Tm1). Notably, RS4 – rainfall during the fruit development period (April–August) – was selected at both stations, demonstrating the crucial role of water availability during biomass accumulation and final yield formation. Furthermore, the presence of monthly extreme temperature variables (Tx and Tm) at most stations indicates that coffee is more sensitive to extreme temperature conditions than to annual mean values.
Overall, seasonal and monthly variables dominate over annual mean variables in the selected variable sets. This indicates that “sensitive climate windows” within the coffee phenological cycle play a more important role in explaining yield variability. Concurrently, the differences in variable sets among stations confirm that climate-yield relationships exhibit local specificity, necessitating the development of separate predictive models for each region. The variables selected through LASSO analysis will serve as inputs for machine learning models (ANN, RF, SVR, and XGBoost) to simulate coffee yield under future climate change scenarios in the subsequent step.
3.4. Development and evaluation of coffee yield simulation models
Table 5 summarizes the performance of the optimal machine-learning models for each station. SVR achieved the highest predictive accuracy at Buon Ho, Dak Mil and M’Drak, whereas XGBoost performed best at Buon Ma Thuot and Lak. On the testing dataset, NSE values ranged from 0.783 to 0.850 and R² values ranged from 0.841 to 0.899, indicating very good model performance according to Moriasi et al. (2007). The similarity between training and testing statistics suggests that overfitting was effectively controlled despite the relatively limited sample size (n = 20 years). These results confirm that the selected climate variables successfully captured the major drivers of coffee yield variability and provide a reliable basis for future climate impact assessments.
| Station | Machine Learning | Training | Testing | ||||||
|---|---|---|---|---|---|---|---|---|---|
| MAE | RMSE | NSE | R2 | MAE | RMSE | NSE | R2 | ||
| Lak | XGBoost | 0.025 | 0.035 | 0.882 | 0.899 | 0.034 | 0.041 | 0.85 | 0.899 |
| Buon Ho | SVR | 0.05 | 0.053 | 0.878 | 0.887 | 0.059 | 0.059 | 0.783 | 0.841 |
| Dak Mil | SVR | 0.037 | 0.04 | 0.877 | 0.884 | 0.041 | 0.042 | 0.801 | 0.846 |
| M’Drak | SVR | 0.077 | 0.081 | 0.851 | 0.865 | 0.067 | 0.068 | 0.832 | 0.86 |
| BMT | XGBoost | 0.024 | 0.031 | 0.885 | 0.895 | 0.02 | 0.021 | 0.814 | 0.892 |
3.5. Projected impacts of climate change on coffee yield
Projected climate change impacts on coffee yield exhibited strong spatial heterogeneity across the Srepok River Basin (Figure 5). Overall, yield losses intensified with increasing emission levels and toward the end of the century. Although future precipitation is projected to increase under most scenarios, rising temperatures and evapotranspiration demand offset these gains, resulting in increasing climatic stress on coffee production.
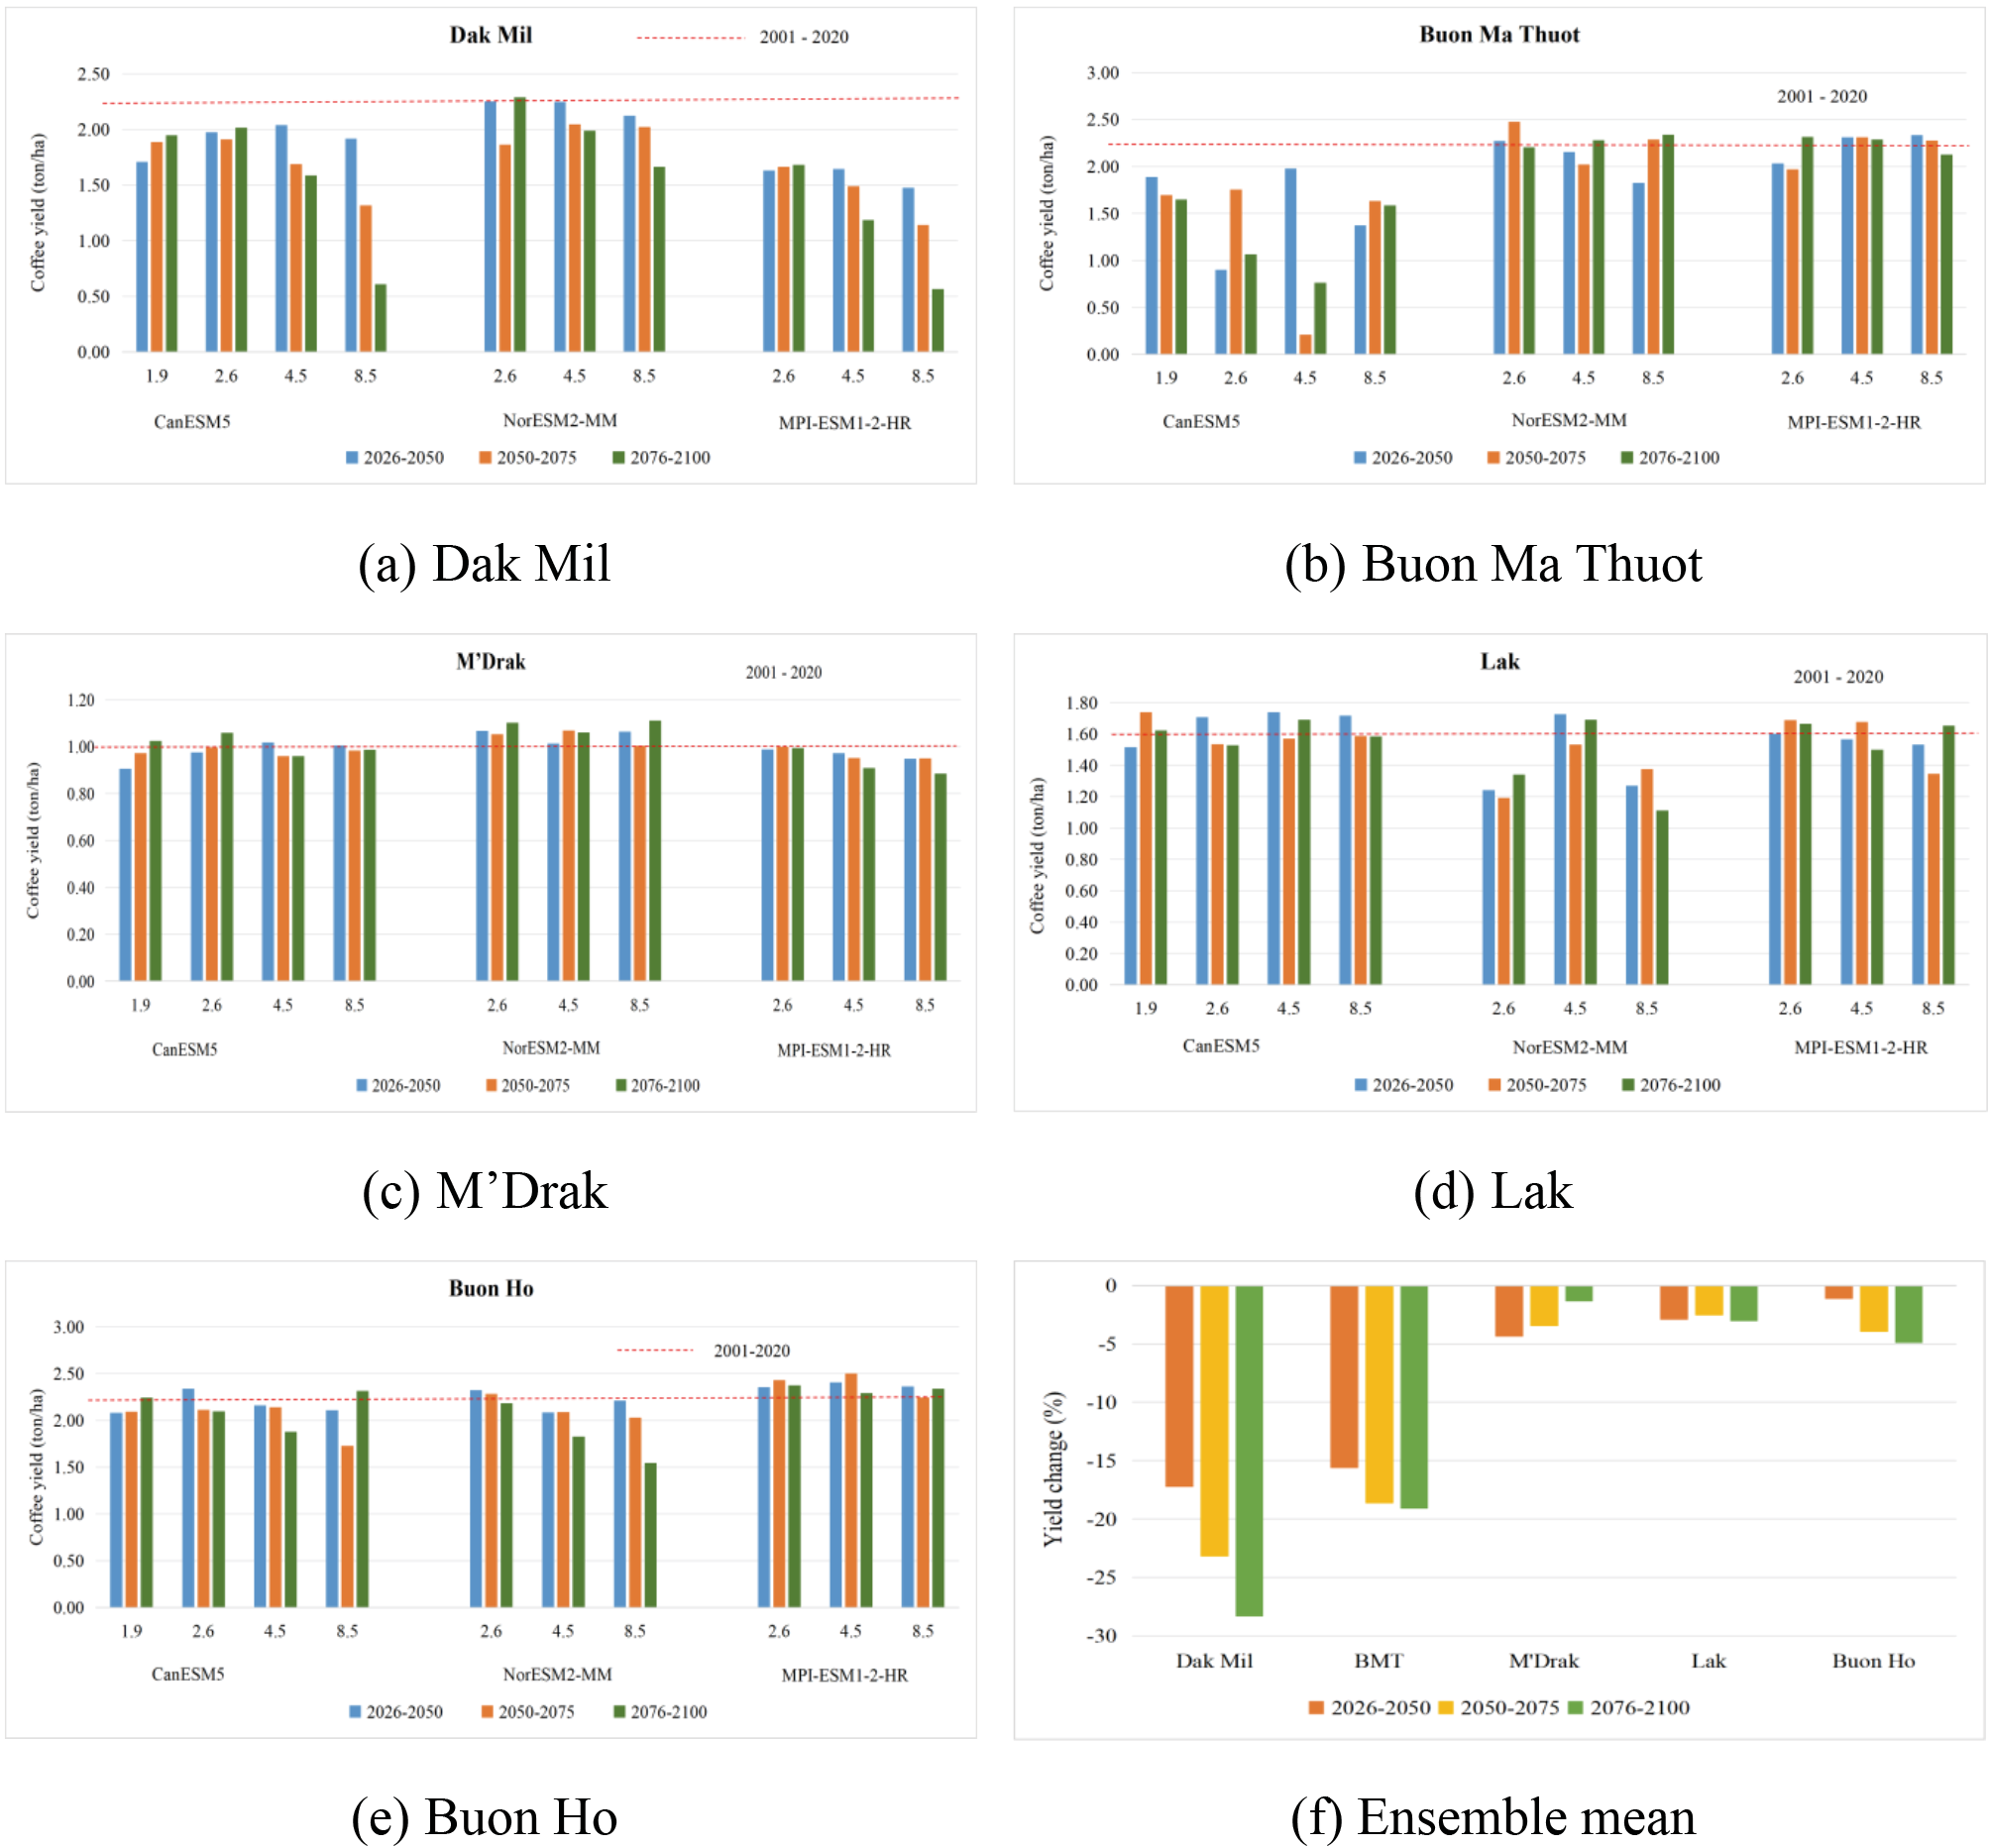
Dak Mil was identified as the most vulnerable area, with projected yield reductions ranging from 13.80% to 58.10% across scenarios and periods. Buon Ma Thuot also experienced substantial declines, ranging from 4.83% to 32.90%. In both locations, the combination of increasing temperature and changes in water-balance conditions contributed to significant reductions in productivity.
In contrast, M’Drak and Lak exhibited relatively stable responses to future climate change. Yield changes ranged from −11.76% to +2.43% at M’Drak and from −10.32% to +8.52% at Lak, indicating greater resilience under projected climate conditions. Buon Ho showed intermediate sensitivity, with maximum yield reductions reaching 10.73% under SSP5-8.5.
The increasing divergence among stations under higher-emission scenarios highlights the importance of local climate and water-balance conditions in determining coffee vulnerability. The difference between the most vulnerable and most resilient locations reached approximately 48 percentage points by the end of the century, emphasizing the need for location-specific adaptation strategies across the basin.
4. Discussion
4.1. Role of water balance and climate-sensitive windows in determining yield
The dominance of PET and SUR among LASSO-selected predictors reflects the physiological reality of Robusta coffee cultivation in the Central Highlands dry season (November–April), when potential evapotranspiration routinely exceeds monthly precipitation by 80–180 mm. SUR – the residual water after evapotranspiration demand is met – functions as a direct proxy for soil water availability during the critical fruit development stage; its selection at Buon Ma Thuot and Lak confirms that water balance dynamics, not temperature alone, govern yield at low-elevation stations. This finding is consistent with Jayakumar et al. (2017), who demonstrated that growing-season water availability outperforms annual climatic means in explaining coffee yield variability in Kerala, India, and with Dinh et al. (2022), who identified the April–August water availability window as the principal determinant of Robusta yield formation in the Vietnamese Central Highlands.
The selection of monthly extreme temperature indices (Tx9, Tm8, Tmin) rather than annual mean values at most stations reflects the nonlinear physiological response of Robusta to thermal stress. Kath et al. (2020) demonstrated, using data from 798 farms across Vietnam and Indonesia, that each 1°C increase beyond optimal thresholds of 16.2/24.1°C for minimum/maximum temperature corresponds to an approximately 14% yield reduction. The projected temperature increases of 0.3–3.2°C documented in this study imply that stations whose baseline Tmax already approaches 29°C – particularly Lak (29.8°C) and Buon Ma Thuot (29.8°C) – may frequently exceed this threshold during flowering and fruit development under mid-to-high emission scenarios. At Dak Mil, where PET and growing-season temperature (TaS4) are the dominant LASSO predictors rather than DEF or SUR, projected increases in PET will progressively reduce water surplus availability (SUR), thereby creating an indirect water stress pathway during the fruit development window even though baseline annual DEF is the lowest among the five stations (45 mm·yr⁻¹). This distinction – between direct DEF-driven stress and indirect PET-driven SUR depletion – highlights the importance of using LASSO-identified predictors as the mechanistic basis for vulnerability explanation, rather than relying on annual deficit statistics that can be misleading in seasonally variable monsoon climates (Byrareddy et al., 2024).
4.2. Machine learning model performance and methodological contributions
SVR and XGBoost achieved NSE > 0.75 and R² > 0.84 across all five stations despite the limited 20-year training record, qualifying as “very good” performance under the Moriasi et al. (2007) criteria. This accuracy is comparable to studies using substantially larger datasets: Khaki & Wang (2019) reported R² > 0.85 for maize yield prediction in the United States using deep neural networks trained on thousands of farm records. The comparable accuracy achieved here reflects the efficiency of combining LASSO-based dimensionality reduction – which eliminates multicollinear variables before model training – with the built-in regularization properties of SVR (margin maximisation) and XGBoost (L1/L2 penalisation), both of which suppress overfitting under data-limited conditions.
The divergence in optimal algorithms may be related to differences in the dominant climate predictors among stations: SVR with the RBF kernel excelled at the three stations where temperature extremes dominate the predictor set (Buon Ho, Dak Mil, M’Drak), consistent with its ability to construct smooth nonlinear boundaries in high-dimensional feature spaces. XGBoost outperformed at Buon Ma Thuot and Lak, where precipitation-based predictors (SUR, RS4) drive yield variability and sequential error correction efficiently captures abrupt, threshold-like responses to rainfall anomalies. This pattern suggests that algorithm performance may depend on the dominant climate–yield relationships represented in the dataset.
4.3. Mechanisms underlying spatial heterogeneity in projected yield impacts
Projected climate change impacts exhibited pronounced spatial heterogeneity across the Srepok River Basin. M’Drak and Lak consistently showed lower vulnerability, whereas Dak Mil experienced the largest projected yield declines. These contrasting responses appear to be associated with differences in baseline water availability and projected changes in temperature and evaporative demand among stations.
M’Drak recorded the highest baseline surplus water (SUR = 862 mm yr⁻¹) and relatively small increases in projected water deficit, which may help maintain favorable moisture conditions during critical phenological stages. Consequently, yield changes remained relatively small and even showed slight increases under some low-emission scenarios.
In contrast, Dak Mil emerged as the most vulnerable station despite having the lowest baseline annual water deficit. LASSO identified PET and growing-season temperature (TaS4) as the dominant predictors at this location, indicating strong sensitivity to changes in atmospheric water demand and thermal conditions. Under future warming, increasing PET combined with higher temperatures during flowering and fruit development is likely to intensify both heat and water stress, resulting in substantial yield reductions. Notably, Dak Mil’s vulnerability arises from the projected rates of increase in PET and temperature, not from its current absolute PET value (1,113 mm·yr⁻¹), which is lower than at M’Drak (1,314 mm·yr⁻¹) and Lak (1,344 mm·yr⁻¹).
Lak provides an important example that annual water deficit alone does not fully explain climate vulnerability. Although Lak exhibited the highest baseline DEF, its relatively high precipitation and SUR values may help buffer future climatic stress. The selection of SUR and RS4 by LASSO further suggests that water availability during the fruit development period is more important than annual deficit statistics in determining coffee productivity.
These findings demonstrate that climate vulnerability is governed not only by changes in mean climate conditions but also by local water-balance characteristics and climate-sensitive growth stages. Consequently, adaptation planning should be tailored to the specific climatic drivers identified for each production area.
4.4. Comparison with other studies
The projected yield reductions at Dak Mil (−23.23% during 2050–2075) and Buon Ma Thuot (−18.65%) are broadly consistent with global projections for coffee under comparable emission scenarios. Della Peruta et al. (2025) project Arabica reductions of 23–35% in Latin America and 16–21% in Africa during 2036–2065; the comparable magnitude observed here for Robusta – a species generally considered more thermally tolerant than Arabica – reflects the amplifying role of simultaneous heat and water stress at vulnerable sites. At the regional scale, Sarvina (2021) documented 6–22% production losses due to seasonal climate variability in Indonesian Robusta, a range that overlaps with moderate-emission outcomes (SSP1-2.6, SSP2-4.5) at most stations during 2026–2050. Byrareddy et al. (2024) further demonstrated in Karnataka, India, that rainfall variability is the binding constraint at the district scale while temperature stress dominates at the regional scale – a scale-dependency consistent with the LASSO variable patterns observed across the five stations in this study.
4.5. Limitations and Future Research Directions
Four limitations should be acknowledged. First, the 20-year observational record constrains ML training, particularly for capturing decadal ENSO-related variability; the El Niño event of 2023–2024 was associated with a 20% decline in Vietnam’s national coffee production – the lowest output in four years – with particularly severe impacts reported in the Central Highlands (USDA FAS, 2024) – an extreme not represented in the training period. Second, farm management variables (irrigation scheduling, fertilisation, shade-tree coverage) are excluded; since improved irrigation management can sustain yields above 3,000 kg·ha⁻¹ with substantially reduced water inputs (Byrareddy et al., 2020), the projections here represent a no-adaptation baseline rather than inevitable outcomes. Third, district-level yield statistics aggregate heterogeneous management conditions and microclimates, limiting plot-scale validation. Fourth, the three-GCM ensemble does not capture the full CMIP6 spread; precipitation shows the highest inter-model variance in this study (46% scenario contribution), and future work should expand the ensemble and apply bias-correction to downscaled precipitation series.
Future priorities include: integrating satellite vegetation indices (NDVI, LAI) for continuous phenological monitoring; developing hybrid process–ML frameworks to improve extrapolation under unprecedented climate conditions; and extending the analysis to the full transboundary Srepok Basin including downstream Cambodia, where water allocation conflicts represent a growing climate-related risk for coffee-growing communities.
5. Conclusions and recommendations
This study assessed the impacts of climate change on Robusta coffee yield in the Srepok River Basin by integrating LASSO variable selection, machine learning models, and CMIP6 climate scenarios. The results indicate that water balance variables (PET, SUR) and extreme temperature indices play dominant roles in determining coffee yield, with seasonal and monthly climate variables accounting for 68% of selected predictors, demonstrating the existence of “sensitive climate windows” throughout the coffee phenological cycle. The developed machine learning models achieved high accuracy, with SVR and XGBoost exhibiting superior performance (NSE > 0.75; R² > 0.84). Simulation results reveal pronounced spatial heterogeneity in climate change impacts across the study basin. Dak Mil emerges as the most vulnerable area, with potential yield reductions reaching 58.10% by the end of the century, while M’Drak exhibits the smallest fluctuations. The findings are consistent with coffee yield reduction trends observed in major coffee-producing regions worldwide.
Based on the research findings, several adaptation strategies are proposed to mitigate climate change impacts on the coffee sector in the Srepok Basin. First, coffee production zoning should be reconsidered based on bioclimatic suitability, particularly in high-risk areas such as Dak Mil and parts of Buon Ma Thuot. Additionally, adaptive cultivation practices should be promoted, including adjusting planting calendars, implementing water-saving irrigation systems, enhancing shade tree coverage, and improving soil moisture retention capacity. Long-term priorities should include breeding programs for drought and heat-tolerant coffee varieties, along with developing monitoring and early warning systems based on key climatic factors. Furthermore, strengthening training and technology transfer to farmers regarding adaptive cultivation practices will contribute to enhancing the resilience of coffee production systems against future climate variability.
Acknowledgements
In memory of our supervisor, Associate Professor Dao Nguyen Khoi
References
Allen, R. G., Pereira, L. S., Raes, D., & Smith, M. (1998). Crop evapotranspiration-Guidelines for computing crop water requirements-FAO Irrigation and drainage paper 56. Fao, rome, 300(9), D05109.
Arias, P., Bellouin, N., Coppola, E., Jones, R., Krinner, G., Marotzke, J., Naik, V., Palmer, M., Plattner, G.-K., & Rogelj, J. (2021). Climate Change 2021: the physical science basis. Contribution of Working Group I to the Sixth Assessment Report of the Intergovernmental Panel on Climate Change; technical summary.
Breiman, L. (2001). Random forests. Machine learning, 45(1), 5-32.
Byrareddy, V., Kouadio, L., Kath, J., Mushtaq, S., Rafiei, V., Scobie, M., & Stone, R. (2020). Win-win: Improved irrigation management saves water and increases yield for robusta coffee farms in Vietnam. Agricultural Water Management, 241, 106350.
Byrareddy, V. M., Kath, J., Kouadio, L., Mushtaq, S., & Geethalakshmi, V. (2024). Assessing scale-dependency of climate risks in coffee-based agroforestry systems. Scientific Reports, 14, 8028.
Chen, T., & Guestrin, C. (2016). Xgboost: A scalable tree boosting system. Proceedings of the 22nd acm sigkdd international conference on knowledge discovery and data mining.
Cybenko, G. (1989). Approximation by superpositions of a sigmoidal function. Mathematics of control, signals and systems, 2(4), 303-314.
Dak Lak Statistics Office, 2001–2021. Statistical Yearbooks of Dak Lak Province (2000–2020).
Dak Nong Statistics Office, 2001–2021. Statistical Yearbooks of Dak Nong Province (2000–2020).
Della Peruta, R., Mereu, V., Spano, D., Marras, S., Vezy, R., & Trabucco, A. (2025). Projecting trends of arabica coffee yield under climate change: A process-based modelling study at continental scale. Agricultural systems, 227, 104353.
Department of Natural Resources and Environment (DONRE) of Dak Lak Province. (2023). Meteorological dataset for Dak Lak Province (2001–2020) [Dataset]. Dak Lak, Vietnam.
Department of Natural Resources and Environment (DONRE) of Dak Nong Province. (2023). Meteorological dataset for Dak Nong Province (2001–2020) [Dataset]. Dak Nong, Vietnam.
Dinh, T. L. A., Aires, F., & Rahn, E. (2022). Statistical analysis of the weather impact on Robusta coffee yield in Vietnam. Frontiers in Environmental Science, 10, 820916.
Do, S. K., Nguyen, B. Q., Tran, V. N., Grodzka-Łukaszewska, M., Sinicyn, G., & Lakshmi, V. (2024). Investigating the future flood and drought shifts in the transboundary Srepok river basin using CMIP6 projections. IEEE Journal of Selected Topics in Applied Earth Observations and Remote Sensing, 17, 7516-7529.
Hastie, T., Tibshirani, R., Friedman, J. H., & Friedman, J. H. (2009). The elements of statistical learning: data mining, inference, and prediction (Vol. 2). Springer.
ICO (2023). Coffee Report and Outlook – December 2023. International Coffee Organization, London.
James, G., Witten, D., Hastie, T., & Tibshirani, R. (2013). An introduction to statistical learning: with applications in R (Vol. 103). Springer.
Jayakumar, M., Rajavel, M., Surendran, U., Gopinath, G., & Ramamoorthy, K. (2017). Impact of climate variability on coffee yield in India—with a micro-level case study using long-term coffee yield data of humid tropical Kerala. Climatic Change, 145(3), 335-349.
Jeong, J. H., Resop, J. P., Mueller, N. D., Fleisher, D. H., Yun, K., Butler, E. E., Timlin, D. J., Shim, K.-M., Gerber, J. S., & Reddy, V. R. (2016). Random forests for global and regional crop yield predictions. PloS one, 11(6), e0156571.
Kath, J., Byrareddy, V. M., Craparo, A., Nguyen-Huy, T., Mushtaq, S., Cao, L., & Bossolasco, L. (2020). Not so robust: Robusta coffee production is highly sensitive to temperature. Global Change Biology, 26, 3677–3688.
Kath, J., Byrareddy, V. M., Reardon-Smith, K., & Mushtaq, S. (2023). Early flowering changes robusta coffee yield responses to climate stress and management. Science of The Total Environment, 856, 158836.
Khaki, S., & Wang, L. (2019). Crop yield prediction using deep neural networks. Frontiers in plant science, 10, 621.
Moriasi, D. N., Arnold, J. G., Van Liew, M. W., Bingner, R. L., Harmel, R. D., & Veith, T. L. (2007). Model evaluation guidelines for systematic quantification of accuracy in watershed simulations. Transactions of the ASABE, 50(3), 885-900.
Bilen, C., El Chami, D., Mereu, V., Trabucco, A., Marras, S., & Spano, D. (2022). A systematic review on the impacts of climate change on coffee agrosystems. Plants, 12(1), 102.
Richardson, D., Kath, J., Byrareddy, V. M., Monselesan, D. P., Risbey, J. S., Squire, D. T., & Tozer, C. R. (2023). Synchronous climate hazards pose an increasing challenge to global coffee production. PLoS Climate, 2(3), e0000134.
Sam, T. T., Somura, H., & Moroizumi, T. (2025). Effects of different management approaches on unmet water demand in coffee-producing areas during wet and dry years: a case study of the Srepok River Watershed, Vietnam. Hydrological Research Letters, 19(2), 94-100.
Sarvina, Y., June, T., Sutjahjo, S. H., Nurmalina, R., & Surmaini, E. (2021). The impacts of climate variability on coffee yield in five indonesian coffee production centers.
Smola, A. J., & Schölkopf, B. (2004). A tutorial on support vector regression. Statistics and computing, 14(3), 199-222.
Tebaldi, C., & Knutti, R. (2007). The use of the multi-model ensemble in probabilistic climate projections. Philosophical transactions of the royal society A: mathematical, physical and engineering sciences, 365(1857), 2053-2075.
Thao, N. T. T., Khoi, D. N., Van Viet, L., Wellens, J., Lang, M., & Tychon, B. (2024). Comparing local people’s perceptions of climate change and drought with scientific observations in the lower Mekong Basin: a case study in Dak Lak province, Vietnam. Environment, Development and Sustainability, 1-28.
Tibshirani, R. (1996). Regression shrinkage and selection via the lasso. Journal of the Royal Statistical Society Series B: Statistical Methodology, 58(1), 267-288.
USDA Foreign Agricultural Service. (2024). Vietnam: Coffee annual 2024 (GAIN Report No. VM2024-0012). United States Department of Agriculture.
Varma, V., Mosedale, J. R., Alvarez, J. A. G., & Bebber, D. P. (2025). Socio-economic factors constrain climate change adaptation in a tropical export crop. Nature Food, 6(4), 343-352.
Wilby, R. L., Conway, D., & Jones, P. (2002). Prospects for downscaling seasonal precipitation variability using conditioned weather generator parameters. Hydrological processes, 16(6), 1215-1234.