https://doi.org/10.36253/caryologia-3196
Received: January 26, 2025; Accepted: June 21, 2025; Published: October 1, 2025
Bioinformatic analysis and characterization of BAC clones of Clarias magur (Hamilton,1822) using FISH and BAC end sequencing
1 Genomics and Computational Resources Division, ICAR-National Bureau of Fish Genetic Resources, Canal Ring Road, P.O. Dilkusha, Lucknow-226 002, India
2 Department of Biosciences, Integral University, Kursi Road, Lucknow-226 026, India
*Corresponding authors. Email: basdeo.kushwaha@icar.gov.in; uzmaafaq89@gmail.com; uzmaafaq@iul.ac.in
Abstract. The clones of BAC library combined with FISH are an excellent tool for mapping and identifying full-length genes. The present study was to sequence, mine and characterize the BAC clones of Clarias magur (magur) genome. The end sequences of the BAC clones were bioinformatically mapped onto the genome scaffolds of magur to identify and locate the genes in each clone and FISH was utilized to locate clones on specific chromosomes of magur. A total of 13 BAC clones could be mapped using BAC end sequences on 12 genome scaffolds of magur. From the 13 clones, 34 genes were mined, annotated and characterized. Physical mapping using BAC-FISH signal was used to localize two clones, 012H23 and 012H7 on 11th and 14th chromosome pairs of magur. The gene enrichment analysis revealed involvement of several genes in growth and regulatory processes, such as protein neddylation and metal ion transport. PPI Network analysis revealed two types of interactions among 11 nodes and between 10 edges; and 4 genes (ash2l, cnot2, lin7c, uba3) were identified to be important. The study reveals the presence of important genes on the 13 undertaken clones, making this a useful genomic resource. The FISH probe could not only be helpful in generation of basic information of gene location for identification of genes on the chromosomes as a chromosome marker, but also in detection of chromosomal defects arisen due to genetic mutation occurred if any on a particular location of reported genes in C. magur.
Keywords: BAC clones, Clarias magur, end sequencing, FISH, PPI, SDG, synteny.
Contents
BAC clone culture, DNA isolation and BAC end sequencing
Chromosome preparation, probe labelling and BAC-FISH
BAC mapped genes and functional description
Comparative genomics and phylogenetics analysis
Network analysis of proteins to proteins
Functional annotation and enrichment analysis
BAC end mapping and gene mining
Chromosomal complements and BAC-FISH
Functional enrichment and gene ontology analysis
Study of protein-protein interactions
Comparative genomics and phylogenetics analysis
Declaration of interest statement
Introduction
Catfish is commercially and economically an important group in aquatics and fisheries. The species Clarias magur (magur), which belongs to the Clariidae family, is popular because of its flavor and therapeutic qualities and is found throughout India, Nepal, Bhutan, and Bangladesh (Ng and Kottelat, 2008; Devassy et al., 2009). The species is facing risks from overexploitation, wetland conversion, widespread illegal introduction of invasive C. gariepinus species and pesticide use in agricultural areas. According to the IUCN Red List (2010), magur is currently listed as endangered species because of several identified and unidentified reasons and most importantly the disappearing breeding habitats and its population in India. A lack of appropriate management strategies may lead to further critical decline for the species in the years to come (Mishra et al.,2019). The United Nation is also concerned towards the people, planet and prosperity and set sustainable development goals (SDGs) as its action agenda. Conservation of fish genetic resources through proper planning, replenishing of fisheries and sustainable utilization of fish as food could be a better way to save our planet earth from over exploitation of water bodies and help in achieving the SDG no. 2 & 14. Owing to the species’ commercial significance, the efforts are being made to conserve it through restoration, and enhance its genetic makeup for future expansion.
Genetic characterization is an important step towards the genetic conservation of a species. There are several methodologies for genetic characterization of a fish species and, construction of bacterial artificial chromosome (BAC) library of a fish species is an important genomic resource. Fertility factor (F-) based plasmid vectors are known as bacterial artificial chromosomes (BACs) reproduce steadily at low copy numbers (Woo et al., 1994). According to Shizuya et al. (1992), the BAC clones’ large insert capacity allows them to carry whole genes with flanking distant regulatory DNA that provide signals for proper spatiotemporal gene expression. For whole genome sequencing, large insert DNA fragments of an organism between 100 and 300 kb into BAC clones were used in case of human genome project and some of plant species. BAC clones insert DNA are also been used for physical gene mapping in the past in several studies.
For fluorescent in situ hybridization (FISH), BAC clones are useful probes because they can suppress repetitive DNA sequences, making single-copy sequences detectable (Hanson et al., 1995; Jiang et al., 1995). Chromosome mapping, genome sequencing, high-throughput BAC end (BE) sequencing, and other genomic studies can all be performed using BAC extracted DNA (Osoegawa et al., 2001, Osoegawa et al., 2004). Using clone as a probe in FISH is a dependable cytological method for chromosome identification. Genome mapping is vital for identifying and characterizing the genetic basis of phenotypic features in organisms and detecting specific genes of interest. To create a physical connection with unknown targeted sequences, BAC clones provide a practical and trustworthy landmark. BAC-FISH tool will help us assess how well a linkage map may create and covers a saturated genetic map on a broad scale. Some BAC based studies have been reported for C. magur but still there is need of expansion more such works to build detailed information on physical localization of genes using BAC library of C. magur. The present study aimed to analyze magur BAC clones using their end sequences and whole genome information for gene and SSR mining and pathway analysis which could aid in genomic selection programs or genetic diversity studies and complement aquaculture production.
Material and methods
BAC library construction
Using genomic high molecular weight DNA from magur blood, the BAC library was built as part of an earlier research initiative supported by the Indian government’s Department of Biotechnology in New Delhi. In brief, the HindIII restriction enzyme was used to digest genomic DNA, size selection was performed and selected size insert DNA fragments were attached to the pCC1BAC vector (Epicentre Biotechnologies, Madison, WI, USA). Subsequently, approximately 115kb DNA pieces were converted and propagated in Escherichia coli Phage Restraint DH10~ competent cells (Invitrogen, Burlington, ON, Canada). Using a Genetix Qpix 2 Automated Arraying Bacterial Colony Picker (Molecular Devices, Sunnyvale, CA, USA), the modified BAC clones were robotically lifted, put on plates, and kept in Luria Broth (LB) culture.
BAC clone culture, DNA isolation and BAC end sequencing
From the BAC library, consisting of 55,141 clones stored in 144 plates each of 384-well format, a plate (ID: 012A) was chosen at random for BAC end sequencing and BAC-FISH. After thawing the plate, 15 μl of each clone was transferred to 15 ml centrifuge tubes for revival, culture and insert DNA isolation using previously reported methodology (Kumar et al., 2020). T7 forward (5’TAATACGACTCACTATAGGG3’) and pbRP1 reverse (5’CTCGTATGTT GTGTGGAATTGTGAGC3’) primers were used to sequence both ends of the clones on an ABI 3500 Genetic Analyzer (Thermo Fisher Scientific, USA). The BAC end sequences (BESs) that were produced were then mapped onto the magur genome scaffolds and examined using a custom Perl script and the Blast tool. For insert DNA isolation and BAC-FISH, the clones that were bioinformatically positioned on the same scaffolds were merged into a single culture.
Chromosome preparation, probe labelling and BAC-FISH
With the help of a fisherman, live and healthy magur specimens were collected from a nearby pond in Lucknow, Uttar Pradesh, India, and brought to the lab in a live form. Using a conventional procedure, the metaphase chromosomal spreads were prepared in vivo from the anterior kidney cells. To make the DNA probe for BAC-FISH, one µg of isolated BAC insert DNA was taken from every clone. Using the direct labeling “nick translation” method, the DNA was tagged with the red fluorophore tetramethyl-rhodamine-5-dUTP (Roche, Basel, Switzerland) and green fluorescein-12-dUTP (Fermentas, Vilnius, Lithuania). Metaphase chromosomal spreads that were two to three days old were subjected to FISH for 60 minutes at 95 °C (Kumar et al., 2017). VectaShield mounting media (Vector Labs, Burlingame, CA, USA) containing DAPI and antifade was used to counterstain the chromosomes for 60 minutes after hybridization. Two band filters were then used to view the slides under a Leica fluorescence microscope (Wetzlar, Germany): DAPI (excitation at 340–380 nm, emission at 461 nm) for chromosome visualization, I3 (excitation at 450–490 nm) for fluorescein-labeled probe visualization, and N2.1 (excitation at 515–560 nm, emission at 595–605 nm) for rhodamine-labeled probe visualization. For probe signal screening, about 50 metaphase spreads per clone were analyzed. A consensus karyotype was created after establishing karyotypes from good spread for every hybridized clone.
BAC mapped genes and functional description
Four hybridized clones with an e-value of 10-5 on the magur genome assembly (NCBI’s Genome Acc. No. QNUK00000000) had their BESs aligned using the BLASTN method. For further examination, the BESs that were aligned on the same scaffold were removed. Simple sequence repeats (SSRs) found in the genes identified from the clones were mined using the MISA bioinformatic program.
Comparative genomics and phylogenetics analysis
Ensembl and NCBI databases were searched for zebrafish (Danio rerio) and channel catfish (Ictalurus punctatus) genomes as queries and gene locations as well as chromosome information were retrieved to perform synteny analysis of annotated clone genes. Circos plot (Krzywinski et al., 2009) was used to visualize synteny among 3 fishes (magur, channel catfish and zebrafish) focusing on genes having same magur scaffolds but distinct positions on chromosomes. Phylogenetic study was performed using gene sequences from the channel catfish, zebrafish and magur scaffolds using MEGA tool (Kumar et al., 2016) and also using interactive tree of life (iTOL) v5.5 tool (Letunic et al., 2019) was used to visualize the evolutionary lineages and DNA sequences phylogenetics structure.
Network analysis of proteins to proteins
The STRING 12.0 (Szklarczyk et al., 2023) database was used to analyze the protein-protein interaction (PPI) networks of the annotated genes, and the Cytoscape v3.6.0 program was used to show the results (Shannon et al., 2003). In order to guarantee interactions with a high degree of confidence and to be included in the interaction network, the network was constructed using a strict confidence score threshold of 0.04.
Functional annotation and enrichment analysis
The identified genes were functionally annotated using Gene Ontology (GO) using BLAST and the UniProtKB/Swiss-Prot databases (http://www.uniprot.org/). The BLOSUM62 substitution matrix with an E-value of less than 1e-4 and a similarity of greater than 80% were the predetermined criteria used to pick BLAST hits. The GO framework was employed to annotate gene sets and KEGG pathway database (Kanehisa & Sato ,2020) was used to obtain information on molecular interactions and network reactions. The PANTHER gene ontology tool was used to perform functional enrichment analysis of the cluster network’s nodes in order to uncover functionally enriched gene networks inside the GO Biological Process and to learn more about the biological significance of the genes.
Results
BAC end mapping and gene mining
Sequence quality check resulted in a good quality sequence for 32 clones, out of which only 13 BAC clones could be sequenced with both forward and reverse end sequences, rest 19 had either forward OR reverse sequence. BESs of these 13 BAC clones were only used for further downstream bioinformatic analysis. Good sequence size was indicated by the 13 clones’ forward and reverse end sequence lengths, which varied from 429 bp (forward end sequence of clone ID: 012G22) to 951 bp (reverse end sequence of clone ID: 012A12) (Table 1). The magur genome’s BES mapping showed that they were dispersed throughout 12 scaffolds. The size of the scaffolds varied from 4,200,247 bp (ID: 012H23 on Scaffold21) to 340,296 bp (ID: 012H1 on Scaffold657). The lengths of the clones were predicted bioinformatically by aligning both end sequences of the clones on the scaffolds of the magur genome, and the clones size ranged from 45.98 kb (ID: 012J12 on Scaffold22) to 143.307 kb (ID: 012A12 on Scaffold111). A total of 34 genes were identified, annotated and characterized after mapping BESs on magur genome scaffolds (Table 2, Supplementary Table 1). One BAC clone (012H23) contained 5 genes, 2 clones (012H7, 012H21) contained 4 genes, 3 clones (012H8, 012J12, 012G22) contained 3 genes, 5 clones (012H15, 012H1, 012A12, 012B15, 012A15) contained 2 genes, while 2 clones (012A22, 012G24) were found to possess only one gene each. The mean size of all clones was around 113.196 kb. A total of 1275 SSRs could identified from the sequences of all 13 BAC clones using MISA tool (Table 1). BAC clone ID: 012H1 contained maximum SSRs (149), while clone ID: 012J12 contained least SSRs (33).
| S. No. | Clone ID | Scaffold mapped on C. magur genome | Scaffold length | Sequence length | BAC ends position mapped on C. magur scaffold | Estimated BAC size (kb) | Number of SSR on the BAC present | %GC content |
No of Genes | ||
|---|---|---|---|---|---|---|---|---|---|---|---|
| 1. | 012H23 | Scaffold 21 | 4200247 | 927 | 900 | 1536131 | 1653231 | 117.101 | 71 | 37.72 | 5 |
| 2. | 012H7 | Scaffold 27 | 3918154 | 907 | 618 | 1869141 | 1982924 | 113.784 | 81 | 38.41 | 4 |
| 3. | 012H8 | Scaffold65 | 2520177 | 698 | 518 | 1622436 | 1728132 | 105.697 | 120 | 40.78 | 3 |
| 4. | 012H15 | Scaffold72 | 2332806 | 802 | 892 | 603066 | 716705 | 113.64 | 82 | 38.3 | 2 |
| 5. | 012H21 | Scaffold222 | 1147004 | 573 | 582 | 694436 | 828095 | 133.66 | 130 | 38.65 | 4 |
| 6. | 012J12 | Scaffold22 | 4179625 | 799 | 898 | 2020754 | 2066733 | 45.98 | 33 | 39.11 | 3 |
| 7. | 012G22 | Scaffold68 | 2435928 | 429 | 310 | 243382 | 341745 | 98.364 | 62 | 38.6 | 3 |
| 8. | 012H1 | Scaffold657 | 340296 | 769 | 897 | 89407 | 211638 | 122.232 | 149 | 41.12 | 2 |
| 9. | 012A12 | Scaffold111 | 1875956 | 875 | 951 | 1206038 | 1325900 | 143.307 | 123 | 39.65 | 2 |
| 10. | 012B15 | Scaffold22 | 4179625 | 778 | 272 | 1788839 | 1911851 | 123.013 | 138 | 39.55 | 2 |
| 11. | 012A15 | Scaffold349 | 749303 | 859 | 338 | 359629 | 481144 | 121.516 | 68 | 39.57 | 2 |
| 12. | 012A22 | Scaffold368 | 723143 | 477 | 774 | 350497 | 444907 | 94.411 | 128 | 39.38 | 1 |
| 13. | 012G24 | Scaffold49 | 3144600 | 643 | 900 | 1454430 | 1593272 | 138.843 | 90 | 38.02 | 1 |
| S. No. | From | Protein names | Gene Ontology (biological process) | Gene Ontology (cellular component) | Gene Ontology (molecular function) |
|---|---|---|---|---|---|
| 1. | tmem17 | Transmembrane protein 17 | NA | ciliary membrane [GO:0060170] | symporter activity [GO:0015293] |
| 2. | agbl2 | Cytosolic carboxypeptidase 2 isoform X1 | NA | NA | carboxypeptidase activity [GO:0004180] |
| 3. | agbl2 | Cytosolic carboxypeptidase 2 (ATP/GTP-binding protein-like 2) (Protein deglutamylase CCP2) | proteolysis [GO:0006508] | cell projection [GO:0042995]; centriole [GO:0005814]; cytosol [GO:0005829] | metallocarboxypeptidase activity [GO:0004181]; zinc ion binding [GO:0008270] |
| 4. | Cnot2 | CCR4-NOT transcription complex subunit 2 isoform X1 | NA | NA | NA |
| 5. | washc4 | WASH complex subunit 7 | NA | WASH complex [GO:0071203] | NA |
| 6. | pdxp | Pyridoxal phosphate phosphatase | NA | NA | NA |
| 7. | mier3a | Mesoderm induction early response protein 3-like | NA | nucleus [GO:0005634] | NA |
| 8. | DAT39_003426 | G protein-coupled receptor kinase (EC 2.7.11.-) | phosphorylation [GO:0016310]; signal transduction [GO:0007165] | NA | ATP binding [GO:0005524]; G protein-coupled receptor kinase activity [GO:0004703] |
| 9. | ash2l | Set1/Ash2 histone methyltransferae complex subunit ASH2 isoform X2 | methylation [GO:0032259] | Set1C/COMPASS complex [GO:0048188] | methyltransferase activity [GO:0008168] |
| 10. | DAT39_006333 | Serine/threonine-protein kinase SBK1-like | phosphorylation [GO:0016310] | NA | ATP binding [GO:0005524]; protein kinase activity [GO:0004672] |
| 11. | nlrc3 | NLR family CARD domain-containing protein 3 | NA | cytoplasm [GO:0005737]; membrane [GO:0016020] | NA |
| 12 | wdr90 | WD repeat-containing protein 90 | NA | NA | NA |
| 13. | CHIA | Acidic mammalian chitinase-like | carbohydrate metabolic process [GO:0005975] | NA | chitin binding [GO:0008061]; hydrolase activity, hydrolyzing O-glycosyl compounds [GO:0004553] |
| 14. | CHIA | Acidic mammalian chitinase-like | carbohydrate metabolic process [GO:0005975] | NA | NA |
| 15. | CHIA | Acidic mammalian chitinase-like | carbohydrate metabolic process [GO:0005975] | NA | chitin binding [GO:0008061]; hydrolase activity, hydrolyzing O-glycosyl compounds [GO:0004553] |
| 16. | CHIA | Acidic mammalian chitinase-like | carbohydrate metabolic process [GO:0005975] | NA | NA |
| 17. | uba3 | NEDD8-activating enzyme E1 catalytic subunit (EC 6.2.1.64) | protein neddylation [GO:0045116] | NA | ubiquitin-like modifier activating enzyme activity [GO:0008641] |
| 18. | mltF | Membrane-bound lytic murein transglucosylase F | NA | NA | NA |
| 19. | lin7c | Protein lin-7 homolog C | exocytosis [GO:0006887]; protein transport [GO:0015031] | anchoring junction [GO:0070161]; plasma membrane [GO:0005886] | NA |
| 20. | mybpc3 | Myosin-binding protein C, cardiac-type (C-protein, cardiac muscle isoform) | NA | NA | NA |
| 21. | slc39a13 | Zinc transporter ZIP13 (Solute carrier family 39 member 13) (Zrt- and Irt-like protein 13) | NA | cytoplasmic vesicle membrane [GO:0030659] | metal ion transmembrane transporter activity [GO:0046873] |
| 22. | pcm | Argininosuccinate lyase | NA | membrane [GO:0016020] | lyase activity [GO:0016829] |
| 23. | DAT39_002900 | Uncharacterized protein | NA | NA | NA |
| 24 | DAT39_002797 | Suppressor of cytokine signaling 5-like | intracellular signal transduction [GO:0035556]; negative regulation of signal transduction [GO:0009968]; protein ubiquitination [GO:0016567] | NA | NA |
| 25. | spns1 | Protein spinster homolog 1 (Spns1) | NA | lysosomal membrane [GO:0005765] | transmembrane transporter activity [GO:0022857] |
| 26. | DAT39_006477 | Ataxin-2-like protein isoform X1 | NA | NA | RNA binding [GO:0003723] |
| 27. | pitpnbl | Phosphatidylinositol transfer protein beta isoform-like | NA | endoplasmic reticulum membrane [GO:0005789]; Golgi membrane [GO:0000139] | phospholipid transporter activity [GO:0005548] |
| 28. | unc50 | Protein unc-50 | NA | nuclear inner membrane [GO:0005637] | NA |
| 29. | slc25a12 | Calcium-binding mitochondrial carrier protein Aralar1-like | malate-aspartate shuttle [GO:0043490] | mitochondrial inner membrane [GO:0005743] | calcium ion binding [GO:0005509] |
| 30. | slc25a12 | Calcium-binding mitochondrial carrier protein Aralar1-like | malate-aspartate shuttle [GO:0043490] | mitochondrial inner membrane [GO:0005743] | calcium ion binding [GO:0005509] |
| 31. | stk38a | Serine/threonine-protein kinase 38 | phosphorylation [GO:0016310] | NA | ATP binding [GO:0005524]; protein serine/threonine kinase activity [GO:0004674] |
| 32. | prex1 | Phosphatidylinositol 3,4,5-trisphosphate-dependent Rac exchanger 1 protein | anatomical structure development [GO:0048856]; intracellular signal transduction [GO:0035556] | NA | guanyl-nucleotide exchange factor activity [GO:0005085] |
| 33. | DAT39_002823 | Neurexin-1a isoform X10 | anatomical structure development [GO:0048856] | membrane [GO:0016020] | NA |
| 34. | DAT39_002905 | Uncharacterized protein | NA | NA | NA |
| 35. | Otogl | Otogelin-like protein | NA | NA | NA |
| 36. | Otogl | Otogelin-like | NA | membrane [GO:0016020] | transmembrane transporter activity [GO:0022857] |
| 37. | Otogl | Otogelin-like protein | L-arabinose metabolic process [GO:0046373] | NA | alpha-L-arabinofuranosidase activity [GO:0046556] |
| 38. | Otogl | Otogelin-like | L-arabinose metabolic process [GO:0046373] | NA | alpha-L-arabinofuranosidase activity [GO:0046556] |
| 39. | ypel1 | Protein yippee-like 1 | NA | NA | NA |
| 40. | bmp5-1 | Bone morphogenetic protein 5 | NA | extracellular region [GO:0005576] | growth factor activity [GO:0008083] |
Chromosomal complements and BAC-FISH
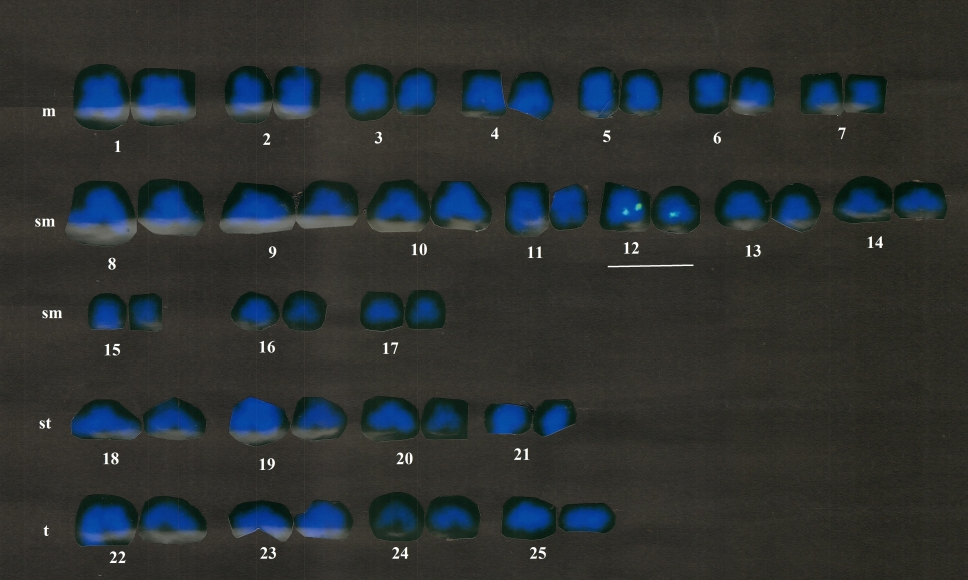
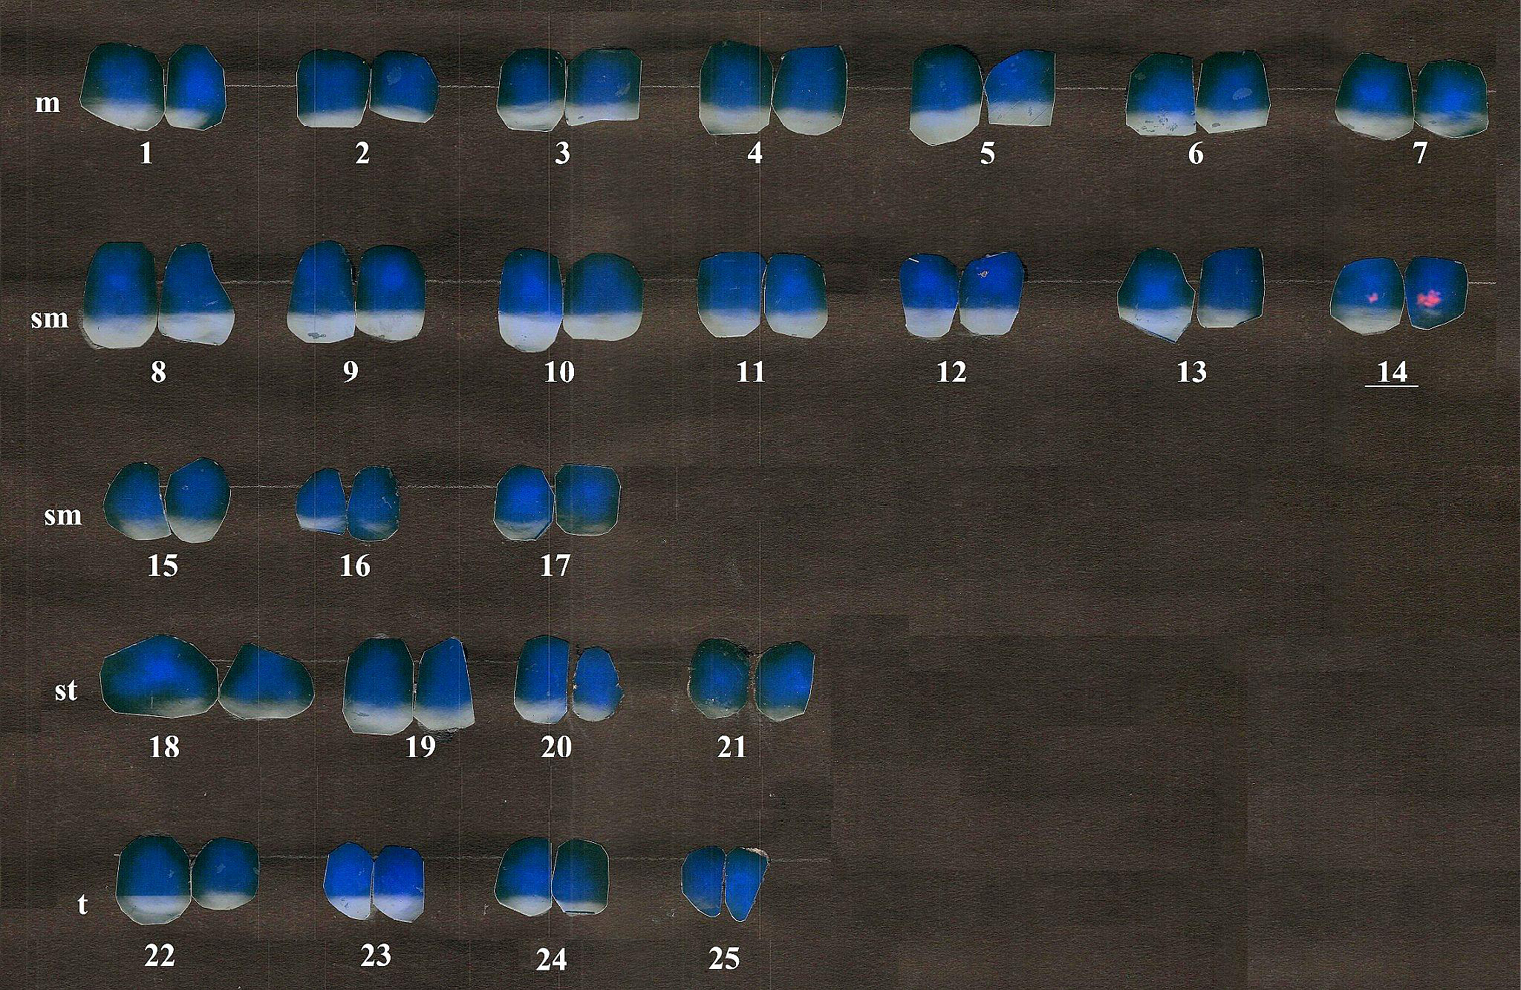
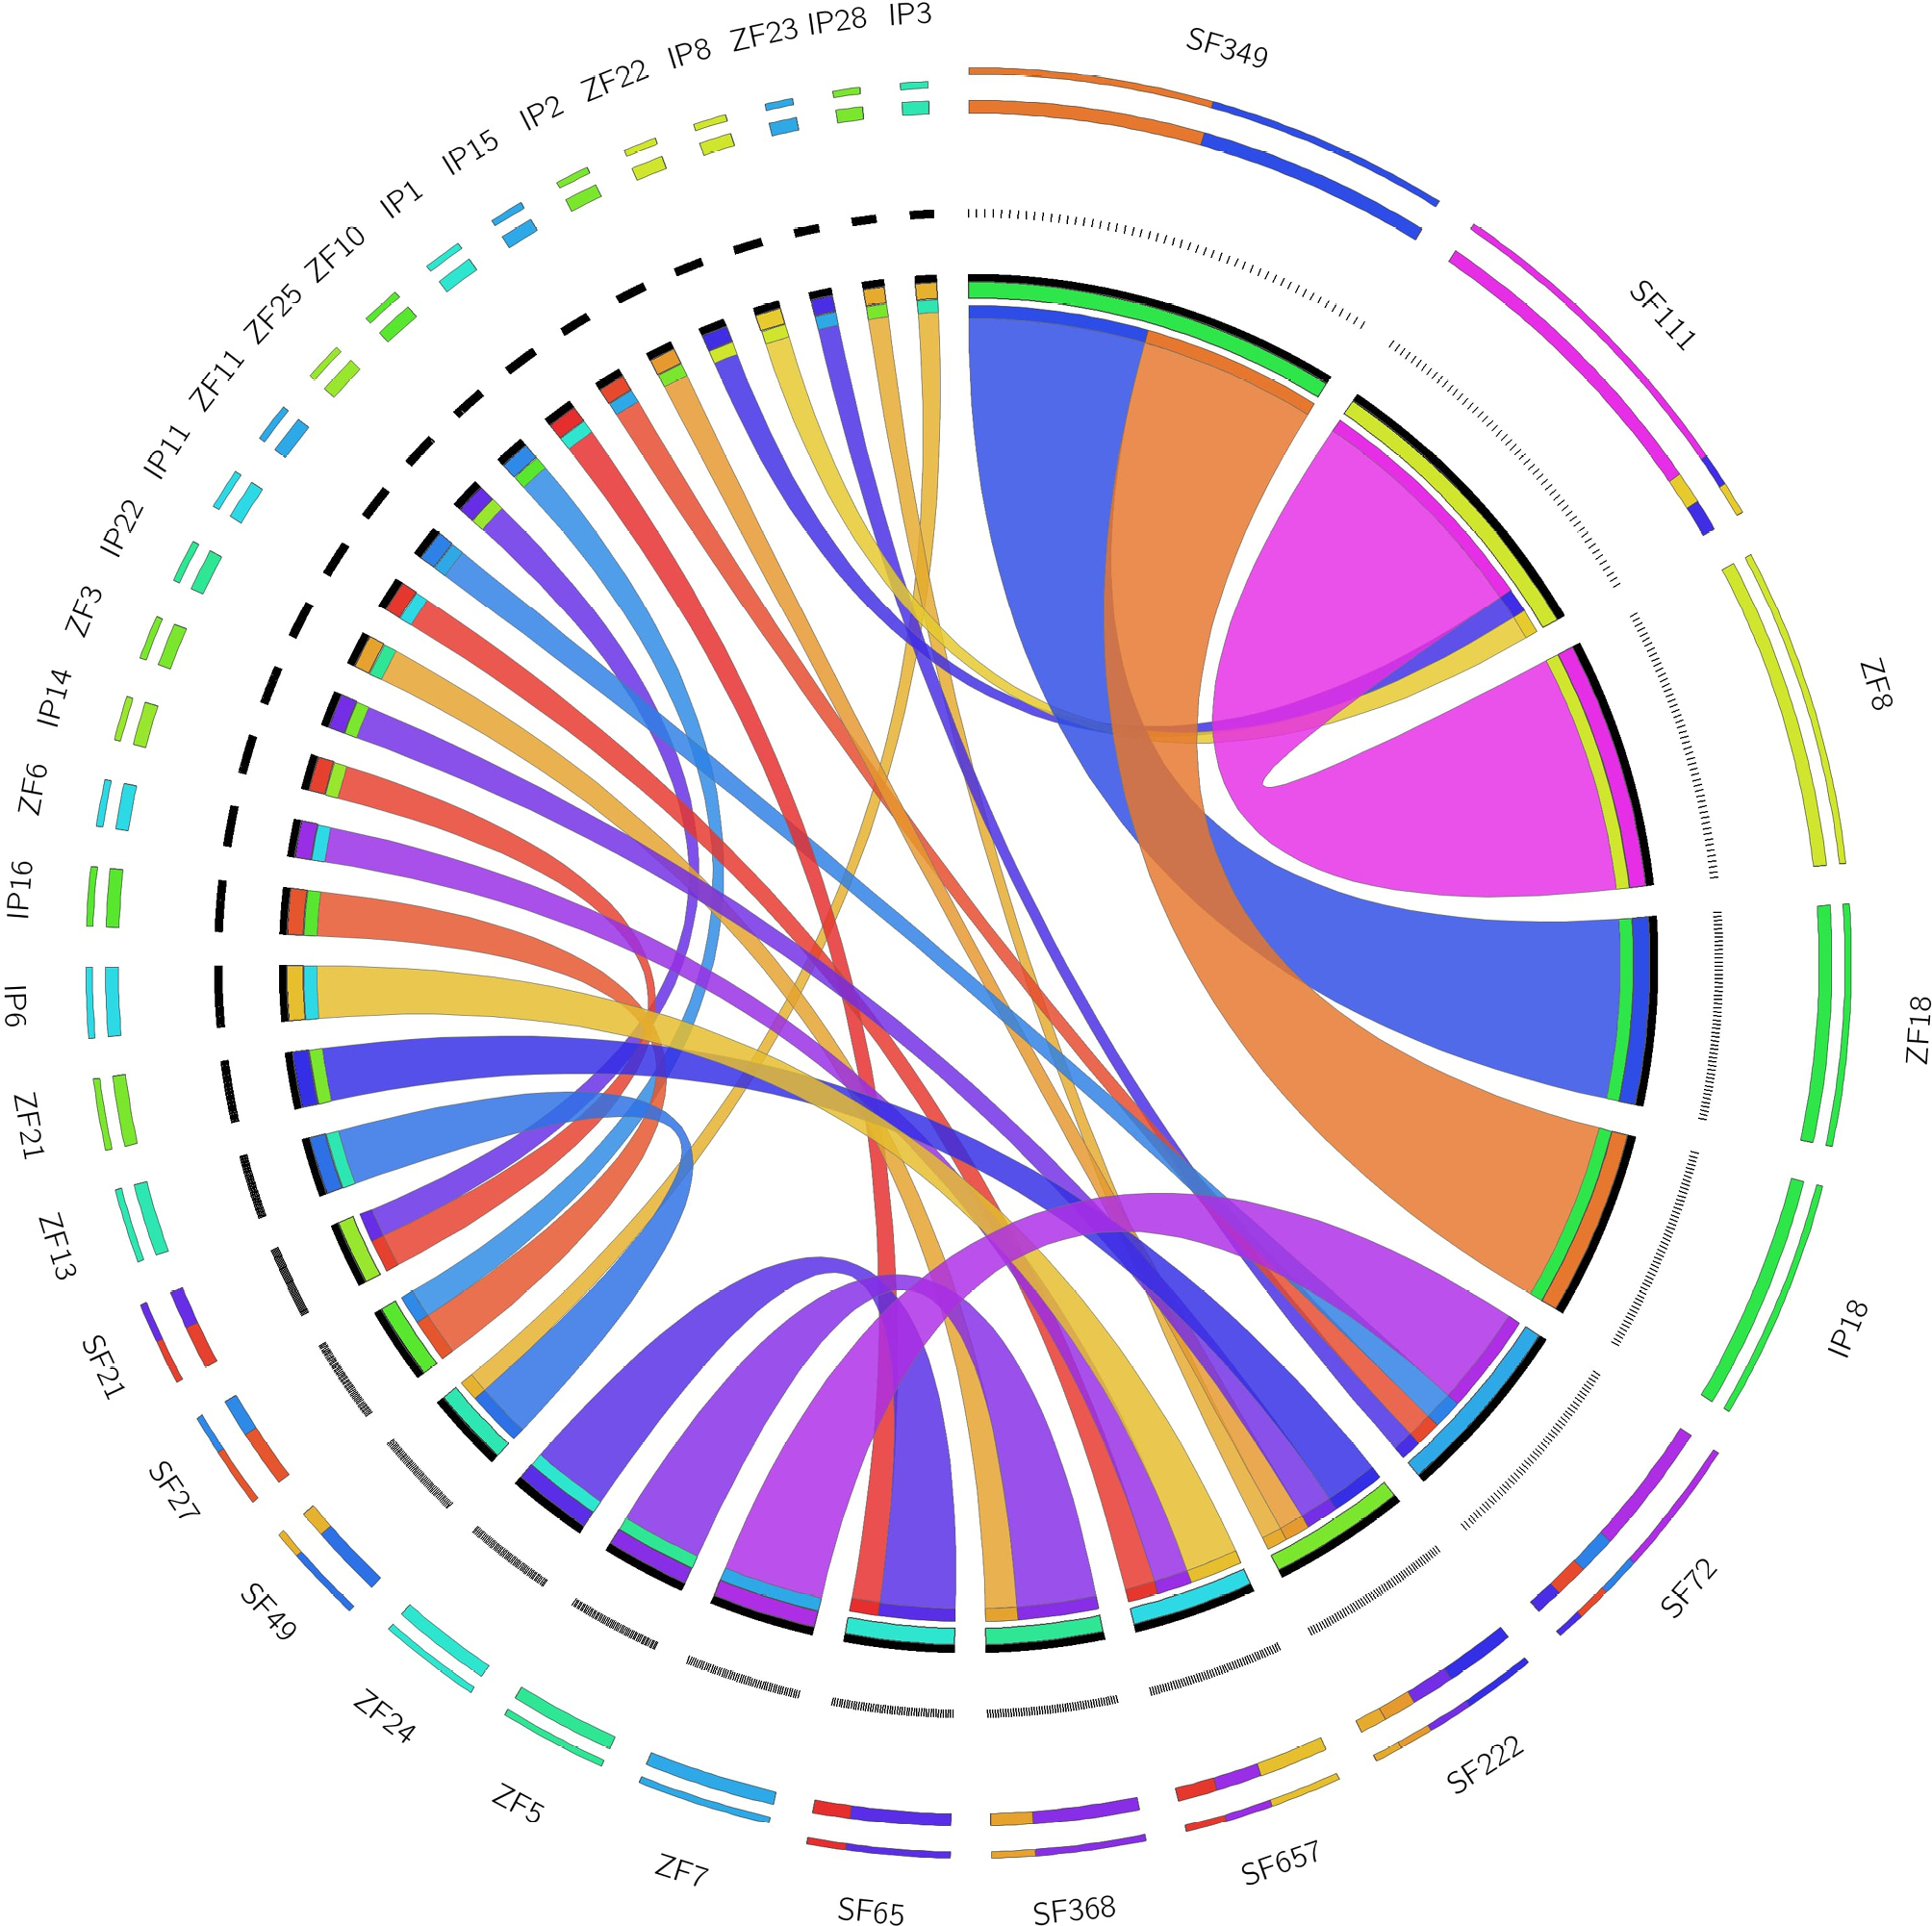
Metaphase chromosomal complements were generated manually with a diploid chromosome (2n) count of 50. According to the morphology and chromosome count, the karyotype was determined to be 14m + 20sm + 8st + 8t with a fundamental arm number (FN) of 90. Clone ID: 012H23, contained maximum 5 genes (Table 1) and labelled with green colour fluorescein-12-dUTP, was mapped on the 11th pair of sub-metacentric chromosomes (Fig. 1), while clone 012H7, contained 4 genes (Table 1) and labelled with red colour rhodamine-5-dUTP, was located on the fourteenth sub-metacentric chromosomal pair. (Fig. 2). The chromosomes’ genes were clearly identified, and were compared with zebrafish and channel catfish for the synteny (Fig. 3) which represents the conserveness of the genes across these species.
Functional enrichment and gene ontology analysis
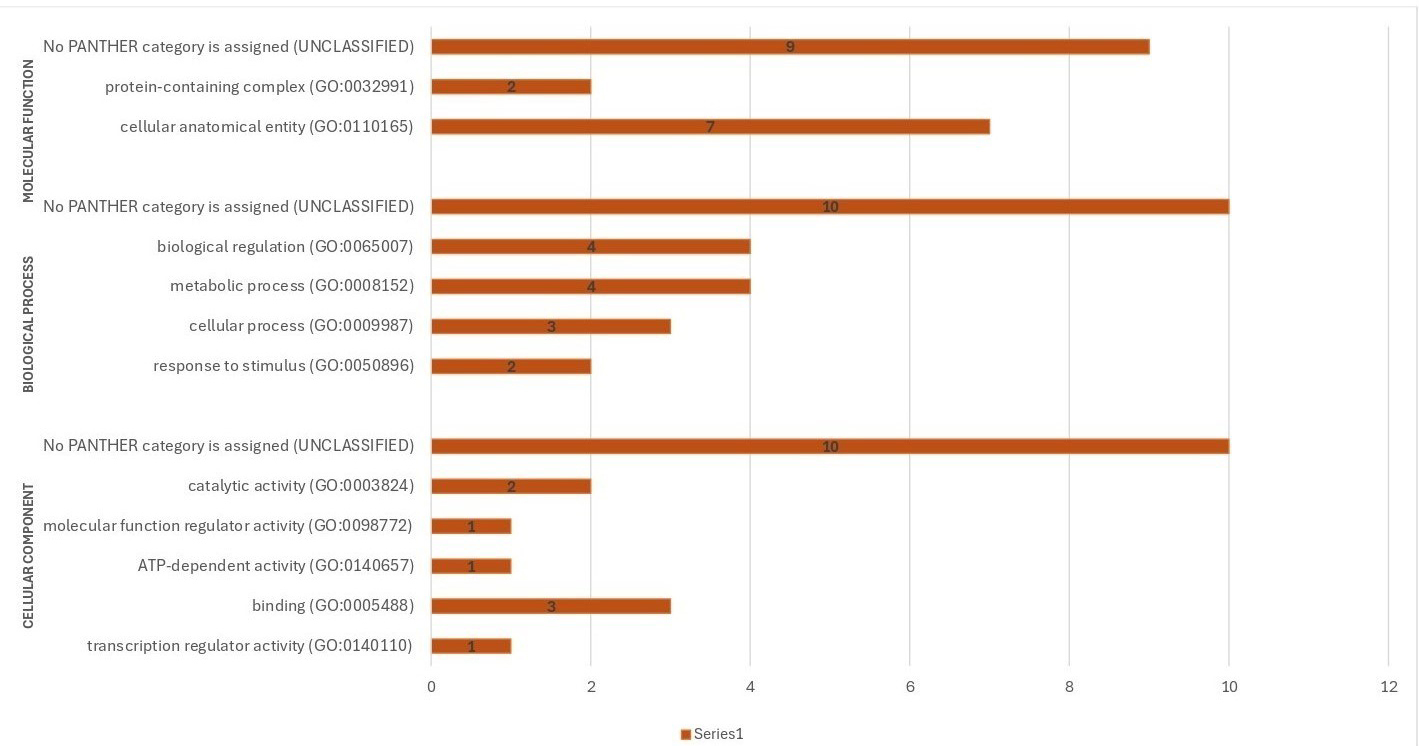
The ‘cellular anatomical (GO:0110165)’ had the maximum number (13) of GO terms (Fig. 4). There are genes encoding proteins localized to specific molecular function such as the nucleus (e.g. MIER3A, UNC50), cytoplasmic vesicle membrane (e.g. SLC39A13) and lysosomal membrane (e.g. SPNS1). Enhancement of cellular constituents such as ‘cellular anatomical entity’, ‘protein-containing complex’ point towards cellular structures and protein interactions. Higher-order processes, like ‘multicellular organismal process’ and ‘response to stimulus’, hint at responses to environmental cues and organismal functions. Notably, enrichment in ‘binding’ and ‘catalytic activity’ suggests significant involvement in these functions within the studied context. Additionally, ‘transcription regulator activity’ and ‘ATP-dependent activity’ underscore their regulatory and energy-related roles. In biological processes, the enrichment in ‘cellular process’, ‘biological regulation’ and ‘metabolic process’ emphasizes their importance in various cellular activities and regulatory pathways. Overall, these genes represent a wide spectrum of biological functions, from molecular regulation to cellular structural integrity, highlighting the complexity and diversity of cellular processes.
TMEM17 gene encodes a transmembrane protein, primarily situated within the ciliary membrane and facilitating symporter activity. AGBL2 gene is involved in proteolysis and is predominantly found in the centriole and cytosol, with notable metallo-carboxypeptidase activity and zinc ion binding. WASHC4 interact with VCP in zebrafish and impacts muscle function as well as autophagy with distinct roles in protein degradation and ER stress. Pitpnb is crucial for double cone cell maintenance in the zebrafish retina, while Pitpna supports early development. Additionally, proteins, like PDXP, PCM and MLPF, contribute to pyridoxal phosphate phosphatase activity, lyase activity in the membrane, and membrane-bound lytic murein transglucosylase activity, respectively. Other proteins are essential for many biological functions, including signal transmission. (DAT39_003426, DAT39_002797), intracellular transport (LIN7C, PITPNBL) and metabolic pathways (CHIA, SLC25A12). Notably, some proteins, like UBA3 and SLC39A13, are engaged in crucial regulatory functions such metal ion transport and protein neddylation, respectively. Moreover, several genes encode proteins with undefined functions (e.g. DAT39_002905, YPEL1). Overall, this classification illustrates the complexity of biological systems by offering insights into the variety of gene functions across many cellular contexts and pathways.
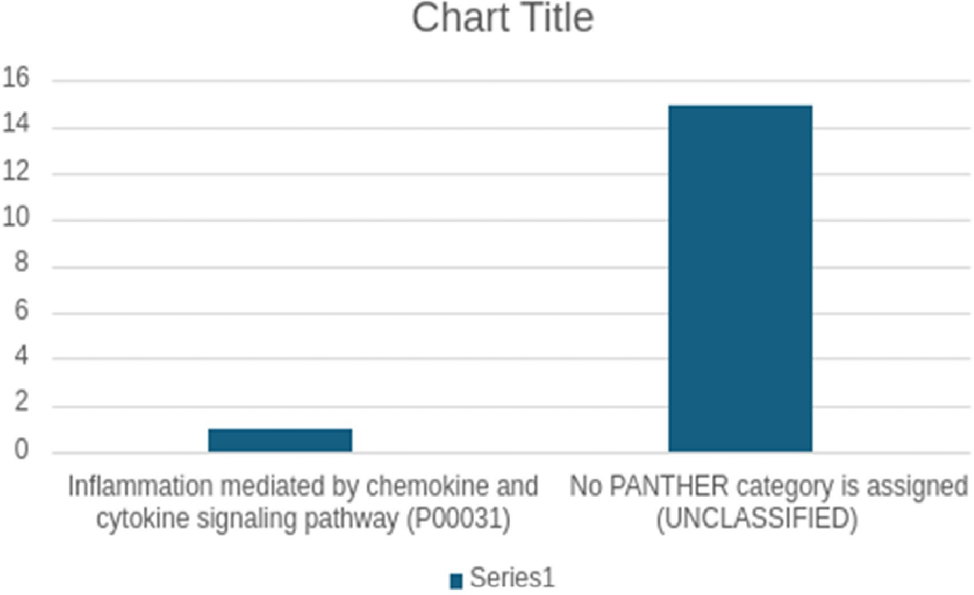
Four pathways, which provided insights into potential cellular mechanisms, could be predicted using PANTHER, viz. Nicotinic acetylcholine receptor signalling pathway (P00044), PI3 kinase pathway (P00048), p53 pathway (P00059) and Ubiquitin proteasome pathway (P00060) (Fig. 5).
Study of protein-protein interactions
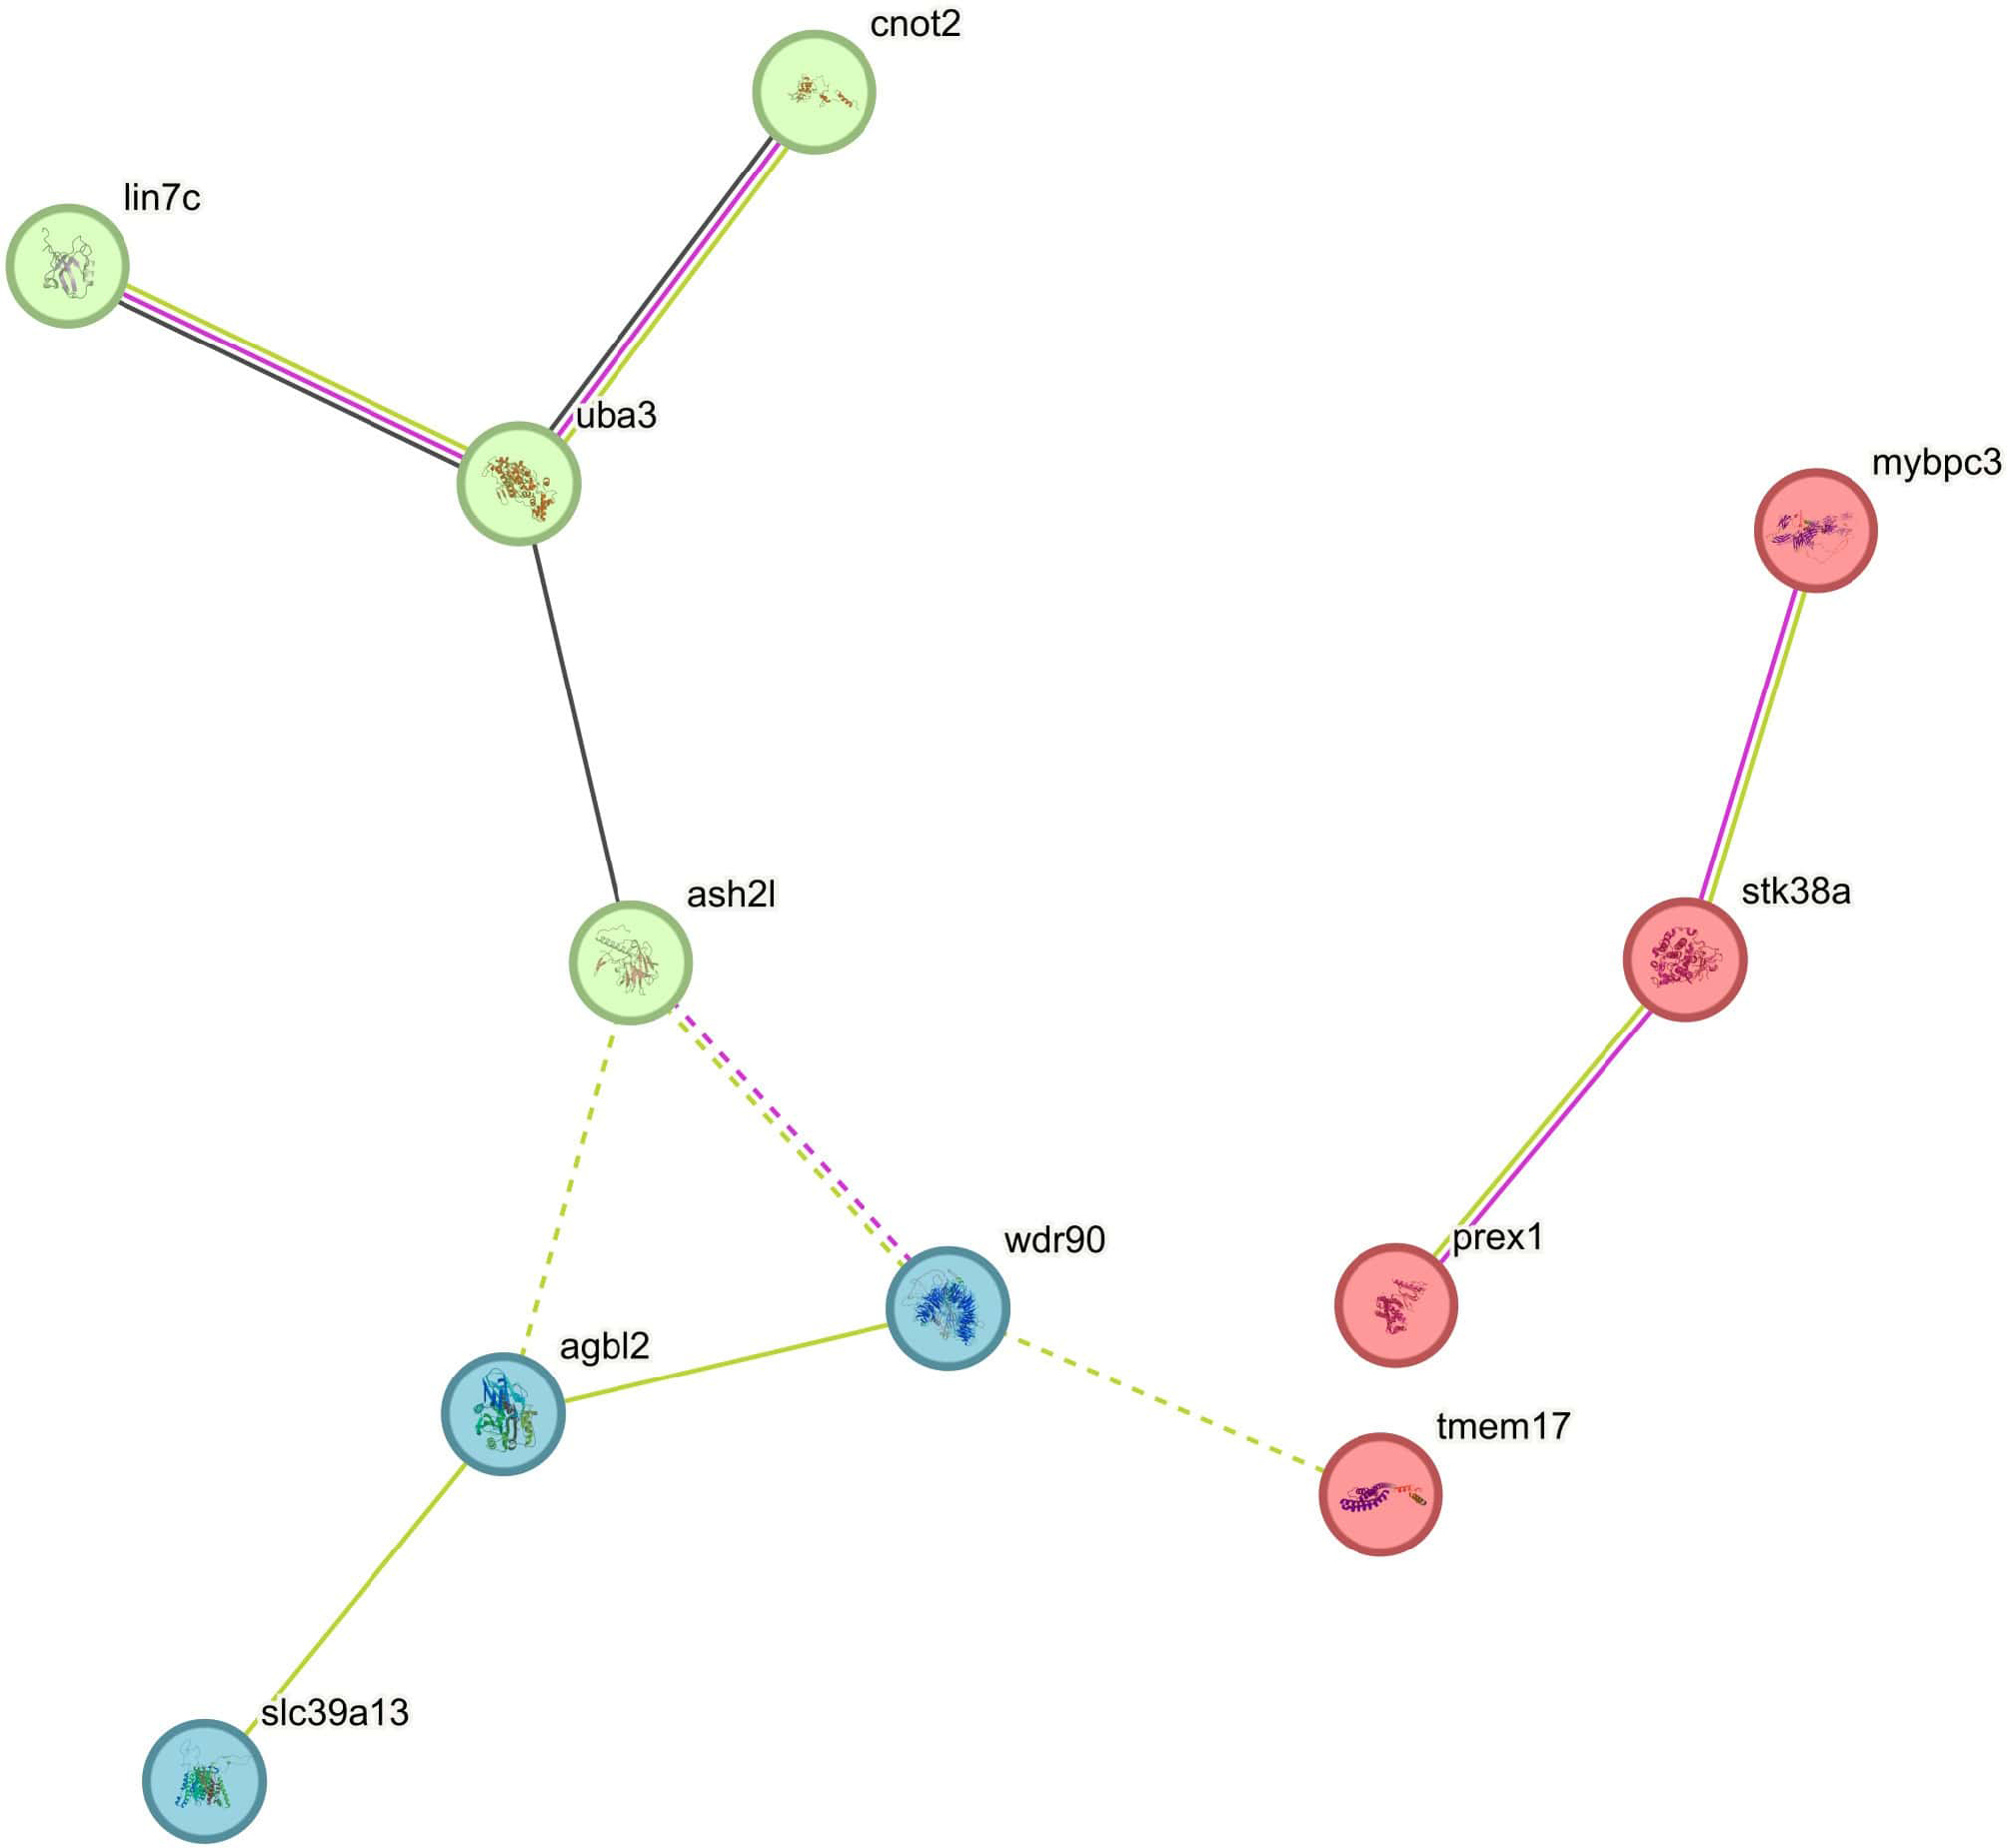
The protein-protein interaction (PPI) network analysis identified 11 genes (mybpc3, prex1, stk38a, tmem17, ash2l, cnot2, lin7c, uba3, agbl2, slc39a13, wdr90) interconnected by 10 edges, representing their interactions. Cluster analysis revealed three distinct clusters represented by red, blue, and green colours. The red cluster includes mybpc3, prex1, stk38a, and tmem17, indicating close interactions likely involved in a shared functional pathway. The green cluster includes uba3, lin7c, cnot2, and ash2l, with uba3 acting as a central hub. The blue cluster includes agbl2, slc39a13, and wdr90, showing localized interactions. These clusters may represent distinct functional modules or pathways, providing insights into the biological roles and relationships among these genes and warranting further analysis to explore their functional and regulatory significance. (Fig. 6).
Comparative genomics and phylogenetics analysis
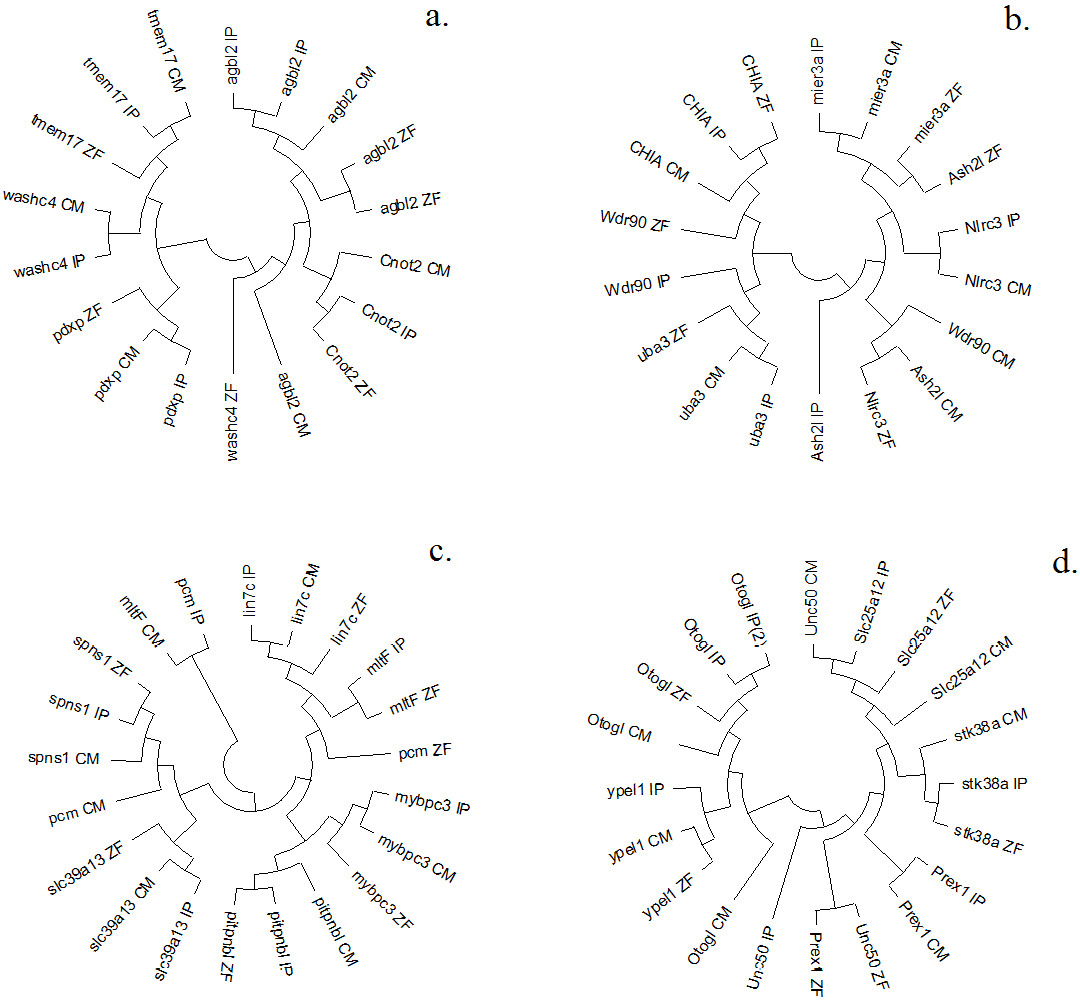
Based on the p-distances, four neighbor-joining (NJ) circular unrooted phylogenetic trees were built to clearly visualize 24 related genes found on the chromosomes of the zebrafish, channel catfish, and magur genome scaffolds. Wash4 gene of zebrafish did not cluster either with channel catfish or magur. Similarly, Aash2I gene of channel catfish did not cluster either with magur or zebrafish. The NJ-phylogeny of genes representing in scaffolds (SF), SF_21, SF_21, SF_21, SF_21 and SF_27 combining magur with channel catfish and zebrafish produced two clusters. (Fig. 7a), as similar SF_27, SF_27, SF_65, SF_65, SF_72, SF_72 (Fig. 7b). Likewise, SF_22, SF_68, SF_68, SF_222, SF_222, SF_222, SF_222 and SF_222 generated 4 clusters (Fig. 7c) and SF_111, SF_111, SF_349, SF_368, SF_657 & SF_657 generated 2 clusters (Fig. 7d). 34 genes located on 13 BAC clones of magur genome were annotated with gene id; protein id; amino acid (AA) and gene size in bp. Mybpc3 gene present on clone ID: 012H1 contained maximum AAs (1250), while the gene (DAT39_002900) present on clone ID: 012J12 possessed smallest (59 AAs) and rest gene were unannotated (Supplementary Table 1). A total of 14 genes of magur (out of 34 genes) were synchronized with zebrafish and channel catfish chromosomes by aligning end sequences of 13 clones (Fig. 3; Supplementary Table 1). Remaining 20 genes present on clones were found in chromosomes of either channel catfish or zebrafish, therefore, not considered for synteny visualization.
Discussion
Several studies have been reported where BAC end sequences were utilized for genomic studies in different biological contexts (Meyers et al., 2004; Baisvar et al., 2022), indicating BACs are an important resource of live genetic material. There are several databases of BAC end sequences developed for numerous model species, including human, rice, mouse, and sea urchin (Poulsen et al., 2004). Baisvar et al. (2022) have reported a BAC-based partial physical map of magur genome employing whole genome and BAC clones. BAC libraries and their characterization using end sequencing of clones can provide insights into the magur genome. In the present study, isolated plasmid DNA of 13 clones of magur genome. Of these, 14 genes were common to zebrafish and channel catfish.
Metaphase chromosomal complements prepared were of good quality. Similar karyotype results have been obtained by other researchers in magur (Baisvar et al., 2022; Kumar et al., 2021). Baisvar et al. (2022) employed BAC-FISH as a cytological marker for identifying individual chromosomes. BAC-FISH includes selecting an appropriate clone and obtaining high-quality chromosomal spread for FISH signal detection as well as to distinguish chromosome-based morphology. In the present study, two clones, viz. 012H23 (containing 5 genes) and 012H7 (containing 4 genes), were mapped on 11th and 14th sub-metacentric chromosomes pair, respectively.
A network-based method for identifying and ranking potential genes and their functional links is protein-protein interaction analysis. PPI analysis network revealed two interactions among 11 nodes and between 10 edges. These interactions were assessed based on various parameters, including their source in the database, experimental evidence, co-expression patterns and text mining, with a confidence score of 0.004 and PPI enrichment value (p-value of 0.000734). Clustering analysis of these 11 genes resulted in three distinct clusters. The red and green clusters contained 4 genes (mybpc3, prex1, stk38a, tmem17) and (ash2l, cnot2, lin7c, uba3) each, respectively, while the blue colour cluster consisted of 3 genes (agbl2, slc39a13, wdr90).
Gene enrichment analysis sheds light on a wide range of molecular and biological processes associated with the gene set under study. Deeper comprehension of the roles of the examined gene set in cellular activities and interactions is made possible by these analyses, which provide thorough insights into the biological processes, molecular functions, and possible pathways connected to the gene set. The GO categorizes genes into molecular functions, biological processes, and cellular components. Among cellular function binding was the most frequent, followed by transcription regulator activity and ATP-dependent activity. For biological processes, metabolic process and biological regulation each were the most prevalent (4), followed by response to stimulus and cellular process. Cellular anatomical entity was the most frequent (7 times), followed by protein-containing complex (twice). The genes in the list cover a wide range of cellular locations and biological roles. Four pathways, viz. nicotinic acetylcholine receptor signalling pathway (P00044), PI3 kinase pathway (P00048), p53 pathway (P00059), and ubiquitin proteasome pathway (P00060), could be identified from PANTHER analysis offering glimpses into synaptic transmission, cellular signalling, stress response and protein turnover, respectively. The list also includes the ‘Inflammation mediated by chemokine and cytokine signalling pathway (P00031)’, highlighting the genes involved in inflammation via chemokine and cytokine signalling. Additionally, there are entries labelled as No PANTHER category (UNCLASSIFIED), occurring ten times for cellular components and biological process, and nine times for molecular function. The presence of unclassified entries suggests potential novel functions requiring further investigation.
Conclusion
BAC based genomic library is very useful resource for mapping of genes on the chromosomes using FISH. A total of 9 genes found to be present in two BAC clones of C. magur were mapped in this study. The BAC end sequencing of 13 clones and mapping on magur genome scaffolds generated information of a total of 34 genes. This is the first report of physical mapping of these genes in C. magur. The PPI network among 11 genes revealed their interaction in three different clusters. This information is valuable for the point of further utilization of BAC resources of C. magur .
Acknowledgments
The present reported work was carried out by the first author at ICAR-NBFGR, Lucknow, for her Ph.D. program. The director of the ICAR-National Bureau of Fish Genetic Resources in Lucknow provided laboratory space and other assistance that the authors needed to complete the Ph.D. research, for which they are grateful. For mapping BAC resources and providing financial assistance for the study, the authors further acknowledge the DBT, New Delhi, and the CABin Scheme of ICAR, which is run by the Division of Agricultural Bioinformatics, ICAR-IASRI, New Delhi. The BAC resource utilized here is the outcome of DBT funded project entitled ‘Whole genome sequencing and development of allied genomics resources in two commercially important fish- Labeo rohita and Clarias batrachus (Sanction Order BT/PR3688/AAQ/3/571/2011 dated 10.09.2013)’ and the consumables and other laboratory resources were utilized from the ICAR CABin Scheme sub-project entitled ‘Construction of physical map of Clarias magur genome’ executed at ICAR-NBFGR, Lucknow, under the ‘Network project on Agricultural Bioinformatics and Computational Biology’ implemented through Division ,ICAR-IASRI, New Delhi. The authors are also grateful to Integral University for providing necessary guidance and help to the first author. This manuscript is also acknowledged under Integral University Manuscript number- IU/R&D/2024-MCN0002767.
Declaration of interest statement
The authors state that none of the work described in this study could have been influenced by any known competing financial or non-financial, professional, or personal conflicts.
Funding information
The authors are thankful to the DBT, New Delhi, and CABin Scheme of ICAR, implemented through Division of Agricultural Bioinformatics, ICAR-IASRI, New Delhi, for providing BAC resource and financial support to the study. The BAC resource utilized here is the outcome of DBT funded project entitled ‘Whole genome sequencing and development of allied genomics resources in two commercially important fish- Labeo rohita and Clarias batrachus (Sanction Order BT/PR3688/AAQ/3/571/2011 dated 10.09.2013)’ and the consumables and other laboratory resources were utilized from the ICAR CABin Scheme sub-project entitled ‘Construction of physical map of Clarias magur genome’ executed at ICAR-NBFGR, Lucknow, under the ‘Network project on Agricultural Bioinformatics and Computational Biology’ implemented through Division of Agricultural Bioinformatics, ICAR-IASRI, New Delhi.
Author contribution statemant
RV: Experimentation, draft writing and editing; BK: Conceptualization, Project Administration, Data Curation, Investigation, Methodology, Writing -original draft; UA: Project Administration: VSB: Formal Analysis, draft writing, editing; SM: Formal Analysis; MSK: Methodology, Formal Analysis, Writing, reviewing, and editing; TD: Formal Analysis, editing; RK: Project Administration, Resources, Supervision, Writing - review and editing.
References
Baisvar VS, Kushwaha B, Kumar R, Kumar MS, Singh M, Rai A, Sarkar UK. 2022. BAC-FISH Based Physical Map of Endangered Catfish Clarias magur for Chromosome Cataloguing and Gene Isolation through Positional Cloning. Int. J. Mol. Sci. 24:15958. https://doi.org/10.3390/ijms232415958.
Derelle E, Ferraz C, Rombauts S, Rouzé P, Worden AZ, Robbens S, Partensky F, Degroeve S, Echeynié S, Cooke R, Saeys Y, Wuyts J, Jabbari K, Bowler C, Panaud O, Piégu B, Ball SG, Ral JP, Bouget FY, Piganeau GDe, Baets B, Picard A, Delseny M, Demaille J, Peer YV, Moreau H.2006. Genome analysis of the smallest free-living eukaryote Ostreococcus tauri unveils many unique features. Proc Natl Acad Sci U S A. 103(31): 11647-52.
Devassy A, Kumar R, Shajitha PP, John R, Padmakumar KG, Basheer V S, Gopalakrishnan A,Mathew L.2016. Genetic identification and Phylogenetic relationships of Indian clariids based on mitochondrial COI sequences. Mitoch. DNA 27(5): 3777–3780.
Hanson RE, Zwick MS, Choi S, Islam-Faridi MN, McKnight TD, Wing RA, Price HJ , Stelly DM .1995. Fluorescent in situ hybridization of a bacterial artificial chromosome. Genome. 38(4): 646-651.
Jiang J, Gill BS, Wang G, Ronald PC, Ward DC. 1995. Metaphase and interphase fluorescence in situ hybridization mapping of the rice genome with bacterial artificial chromosomes. Proc Natl Acad Sci USA. 92(10): 4487-4491.
Kanehisa M, Sato Y. 2020. KEGG Mapper for inferring cellular functions from protein sequences. Prot. Sci. 29(1): 28–35.
Krzywinski M, Schein J, Birol I, Connors J, Gascoyne R, Horsman D, Jones SJ, Marra MA. 2009. Circos: An information aesthetic for comparative genomics. Gen.Res. 19(9): 1639–1645.
Kumar R, Baisvar VS, Kushwaha B, Murali S, Singh VK. 2020. Improved protocols for BAC insert DNA isolation, BAC end sequencing and FISH for construction of BAC based physical map of genes on the chromosomes. Mol. Bio. Rep. 47(3): 2405–2413.
Kumar R, Baisvar VS, Kushwaha B, Waikhom G, Nagpur NS. 2017. Cytogenetic investigation of Cyprinus carpio (Linnaeus, 1758) using giemsa, silver nitrate, CMA3 staining and fluorescence in situ hybridization. Nuc. 60: 1–8.
Kumar S, Stecher G, Tamura K. 2016. MEGA7: Molecular Evolutionary Genetics Analysis Version 7.0 for Bigger Datasets. Mol. Bio. Evol. 33(7): 1870–1874.
Letunic I, Bork P. 2019. Interactive Tree of Life (iTOL) v4: Recent updates and new developments. Nucl. Aci.Res. 47(W1): W256–W259.
Meyers B C, Scalabrin S, Morgante M. 2004. Mapping and sequencing complex genomes: Let us get physical. Nat Rev Genet. 5(8): 578–89.
Mishra BM, Khalid MA, Labh, SN. 2019. Assessment of the effect of water temperature on length gain, feed conversion ratio (FCR) and protein profile in brain of Labeo rohita (Hamilton 1822) fed Nigella sativa incorporated diets. Intl J Fish Aquatic Studies. 3: 6-13.
Ng HH, Kottelat M. 2008. The identity of Clarias batrachus (Linnaeus,1758), with the designation of a neotype (Teleostei: Clariidae). Zoo. J. Lin. Soc. 153(4): 725–732.
Osoegawa B, Zhu CL, Shu T, Ren Q, Cao G M, Vessere MM. 2004. BAC resources for the rat genome project. Genome Res. 14(4): 780–785.
Osoegawa K, Mammoser AG, Wu C, Frengen E, Zeng C, Catanese JJ, de Jong PJ. 2001. A bacterial artificial chromosome library for sequencing the complete human genome. Geno. Res. 113: 483-96.
Poulsen TS, Johnsen HE, Zhao S, Stodolsky M.2004. BAC End Sequencing. In Methods in Molecular Biology. Bacterial Artificial Chromosomes, Library Construction, Physical Mapping and Sequencing Humana Press Inc. Totowa. 255: 157–161.
Shannon P, Markiel A, Ozier, O, Baliga NS ,Wang JT, Ramage D, Amin N, Schwikowski B, Ideker T.2003. Cytoscape: a software environment for integrated models of biomolecular interaction networks. Gen. Res. ,13(11): 2498-504.
Shizuya Hiroaki, Bruce Birren, Ung-Jin Kim, Valeria Mancino, Tatiana Slepak, Yoshiaki Tachiiri, & Melvin Simon. 1992. Cloning and stable maintenance of 300-kilobase-pair fragments of human DNA in Escherichia coli using an F-factor-based vector. Proc Natl Acad Sci U S A. 89(18): 8794-8797.
Szklarczyk D, Kirsch R, Koutrouli M, Nastou K, Mehryary F, Hachilif R, Gable AL, Fang T, Doncheva NT, Pyysalo S, Bork P, Jensen LJ, Mering CV. 2023. The STRING database in 2023: protein-protein association networks and functional enrichment analyses for any sequenced genome of interest. Nuc. Ac. Res.51(D1): D638-D646.
Vishwanath W. 2010.Clarias magur. The IUCN Red List of Threatened Species. 2010: e.T168255A6470089. https://doi.org/10.2305/IUCN.UK.2010-4. RLTS.T1682 55A64 70089.
Woo SS, Jiang J, Gill BS, Paterson AH, Wing RA. 1994. Construction and characterization of a bacterial artificial chromosome library of Sorghum bicolor. Nc. Ac. Res.22(23):4922-31.