https://doi.org/10.36253/caryologia-3365
Received: March 7, 2025; Accepted: July 16, 2025; Published: October 1, 2025
Genomic portraits: karyotyping of some Nigerian bat species
1 Department of Zoology and Environmental Biology, University of Nigeria, Nsukka, Enugu State, Nigeria
2 Department of Plant Science and Biotechnology, University of Nigeria, Nsukka, Enugu State, Nigeria
*Corresponding author. Email: elijah.okwuonu@unn.edu.ng.
Abstract. Chromosome studies were conducted on bat species in the Nsukka Local Government Area of Enugu State, Nigeria, to determine their karyotypes and assess relatedness. Chromosomes were isolated from the bone marrow and testes of various bat species using 0.4% colchicine for cell division arrest. A calibrated eye-piece graticule was used for counting and measuring chromosomes from prepared slides. Calculations for arm ratios and centromeric indices were performed to categorize chromosomes, and ideograms were created based on these measurements. Standard karyotypes for each species were established using photomicrographs of mitotic metaphase chromosomes. A total of eight bat species were sampled, representing the suborders Yinpterochiropera and Yangochiroptera. The species included Epomophorus wahlbergi, Epomophorus gambianus, Microteropus pusillus from Yinpterochiropera, and Nycteris major, Nycteris grandis, Nycteris arge, Scotophilus diaganii, and Scotophilus leucogaster from Yangochiroptera. The diploid chromosome numbers (2n) and fundamental numbers (FN) were as follows: Epomophorus wahlbergi (2n=35, FN=70), Epomophorus gambianus (2n=36, FN=79), Microteropus pusillus (2n=36, FN=79), Nycteris major (2n=40, FN=80), Nycteris grandis (2n=42, FN=82), Nycteris arge (2n=40, FN=78), Scotophilus diaganii (2n=36, FN=45), and Scotophilus leucogaster (2n=36, FN=54). Variations in 2n and FN were attributed to centric fission and loss of p arm segments in some chromosomal pairs, leading to different morphological traits observed in the bat species. The study highlights the rich diversity of bat species in Nsukka and supports the use of karyotyping as an effective method for species differentiation.
Keywords: chromosomes, megabats, centric fission, Epomophorus, Microteropus, Nycteris, Scotophilus.
Contents
Trapping of experimental animals
Introduction
Bats, constituting a significant percentage of living mammals, belong to the order Chiroptera, which is the second most diverse order of mammals (Wilson and Reeder 2005; Stevens and Willig 2002; Simmons and Conway 2003). They exhibit unique adaptations such as flight, echolocation, and a wide range of ecological roles, feeding on various food sources like fish, insects, blood, nectar, and fruit (Fenton et al. 2016; Teeling et al. 2012). Bats play essential ecological roles, including seed dispersal, pest control, and pollination of crops (e.g., agave for tequila production) (McCracken et al. 2012; Bumrungsri et al. 2013).
Bats are also known reservoirs for several deadly viruses, including Ebola, SARS, rabies, and MERS, often remaining asymptomatic (Wang et al. 2011; Drexler et al. 2012; Anthony et al. 2017). Remarkably, they have long lifespans and low cancer rates, which may provide insights into aging and longevity (Austad 2010; Wang et al. 2011).
The taxonomic classification of bats has evolved, with a shift from the “wide” polytypic to the “narrow” monotypic species concept due to advancements in morphological and karyological techniques (Strelkov 2006; Kruskop 2005). Recent taxonomic revisions have identified 14 new Far Eastern bat species (Kruskop et al. 2012; Ruedi et al. 2015). However, African bats remain under-researched, with over 70% of fossil data missing, complicating conservation efforts (Teeling et al. 2012).
This study aimed to investigate the cytotaxonomy of bat species in Nsukka LGA, Enugu State, Nigeria, by determining chromosome numbers and characteristics, constructing karyotypes, and assessing species relatedness, addressing the lack of cytotaxonomic data in this region.
Materials and methods
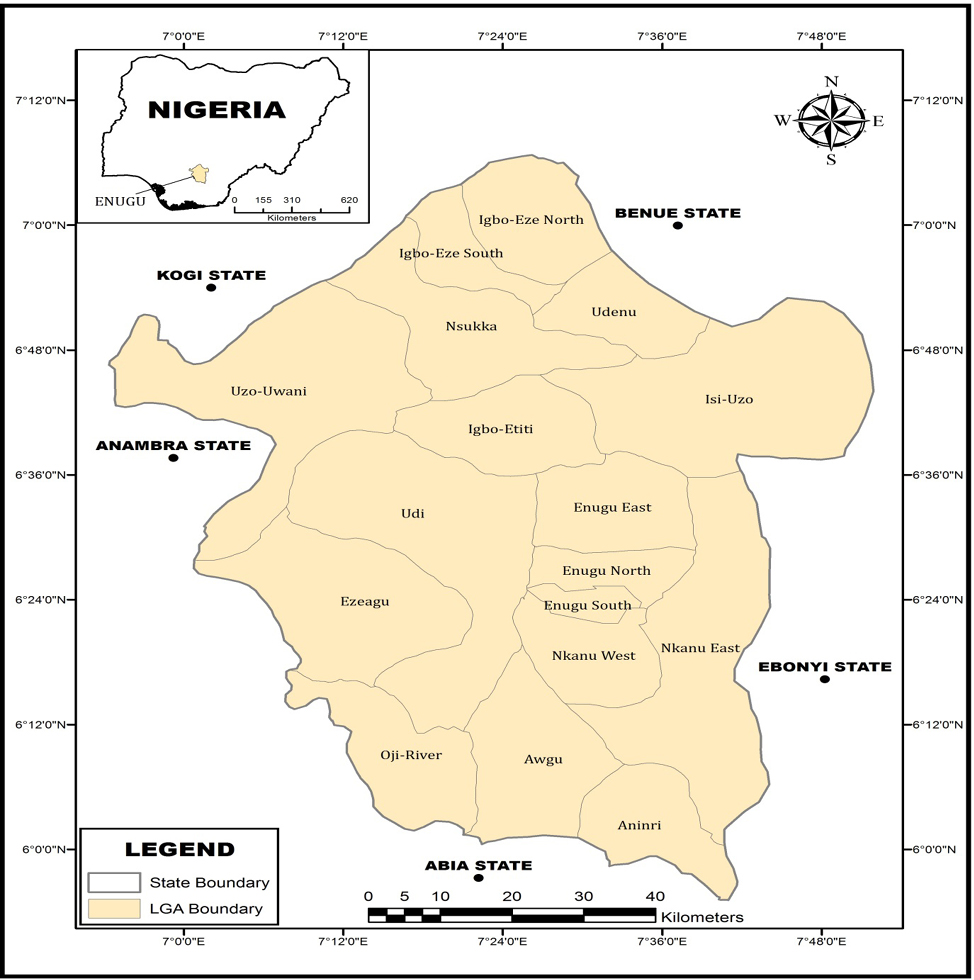
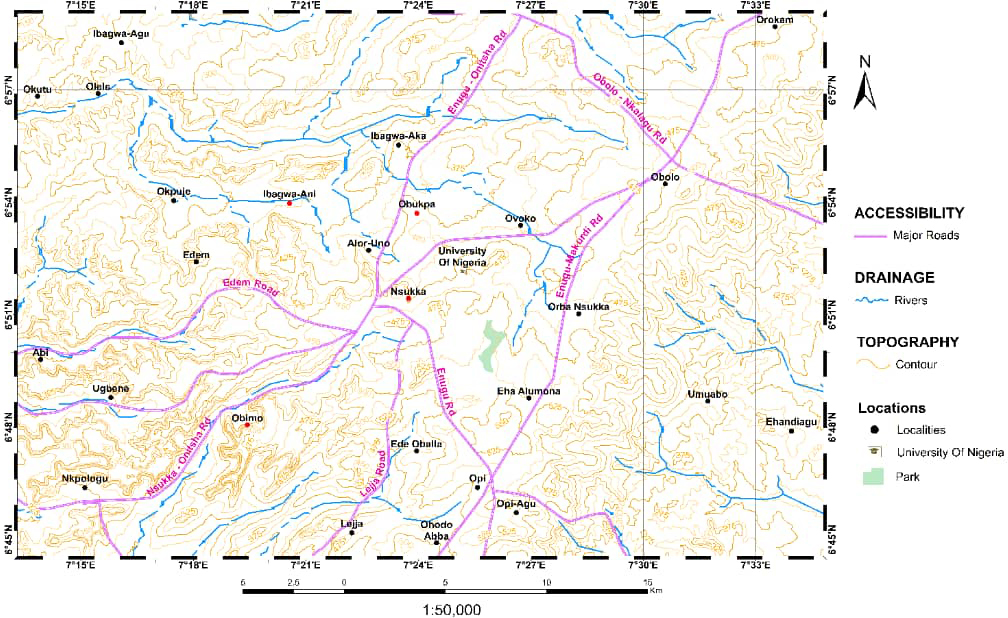
The study was conducted in the Nsukka Local Government Area (LGA) of Enugu State, Nigeria, within the northern senatorial zone (Figure 1). Nsukka LGA is characterized by its green, steep terrain and includes villages such as Alor-Uno, Ede-Oballa, and Okpuje, covering an area of 1,810 km² with a population of 309,448 (ANON, 2006). The study sites included Obimo, Ibagwa-Ani, Nsukka, and Obukpa (Figure 2).
Data analysis
The data collected were analyzed based on observations from Abraham and Prasad (1983) and Adegoke and Ejere (1991). These observations facilitated the classification of chromosomes into four groups: metacentric, submetacentric, subtelocentric, and acrocentric. Additionally, the relationships among the species were determined by measuring the chromosomes’ relative lengths and centromeric indices.
Trapping of experimental animals
Bats were trapped using a triple high mist net and a harp trap, following methods from Denys et al. (2013). Traps were set across potential flight paths for one night, checked every 10 to 20 minutes to prevent entanglement. Two bats (one male and one female) from each species were sacrificed for chromosome studies, with an additional specimen kept as a voucher.
Experimental design
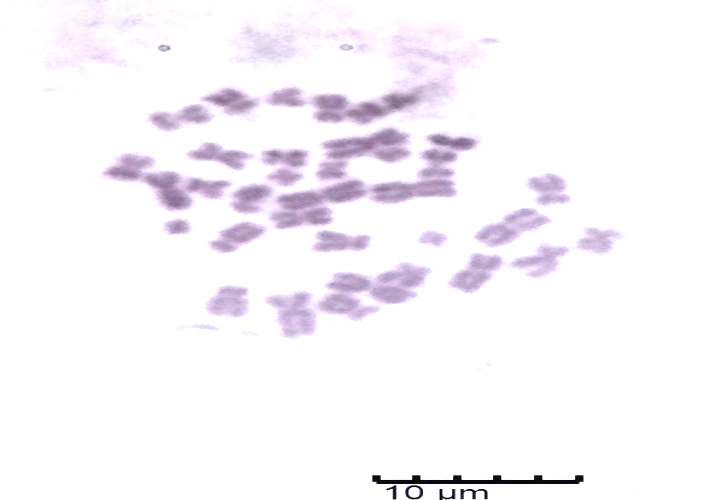
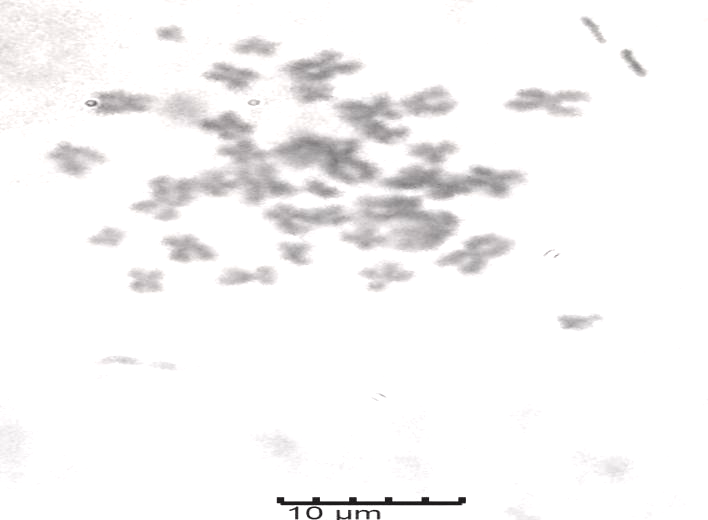
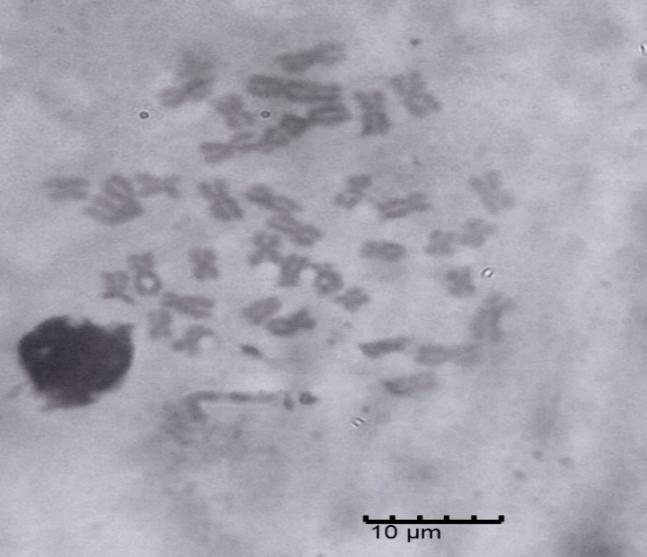
The standard colchicine method was employed to prepare metaphase chromosome samples, following the protocol of Ejere and Adegoke (2001) with slight modifications. This procedure involved administering an intraperitoneal injection of 0.1 ml of 0.4% colchicine to each bat species for 2 hours to halt mitotic cell division. After euthanizing the bats with iso-fluorine, the hind leg bones were dissected and trimmed. Bone marrow was extracted using a heparinized syringe containing 3 ml of 0.55% KCl, which was then placed in labeled 15 ml centrifuge tubes, homogenized, and allowed to sit for 15 minutes. The resulting suspensions were centrifuged for 5 minutes at 1500 rpm, and the supernatant was discarded, leaving 0.5 ml of liquid in which the cells were resuspended. The cells were fixed with fresh cold Carnoy’s fixative and allowed to sit for about 30 seconds before undergoing centrifugation again, with the supernatant removed. This centrifugation process in the fixative was repeated twice more, after which the cells were resuspended and diluted with the fixative prior to being spread on glass slides. The slides were stained in a Coplin jar with 5 ml of Giemsa stain for 30 minutes, rinsed with tap water, and then placed in a slide warmer at 60 °C for 2 hours. Stained slides were examined for dividing cells under a light microscope at 10x magnification. Well-separated, countable metaphase chromosomes were measured and photographed under oil immersion at approximately 1000x magnification. The resulting photomicrographs were used to construct karyotypes (Adegoke and Ejere 1991; Ejere and Adegoke 2001).
Morphological identification
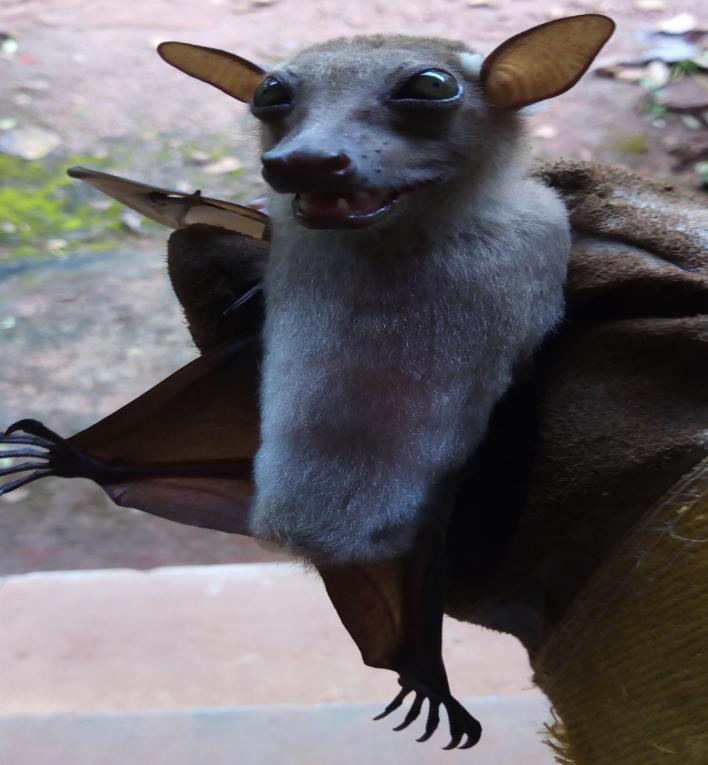
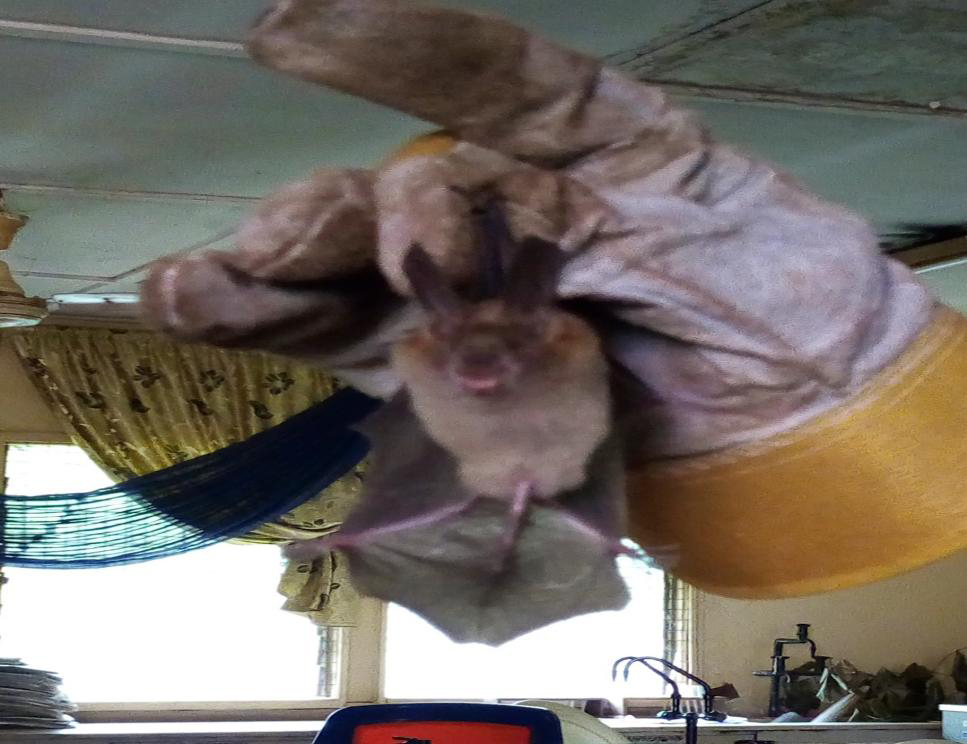
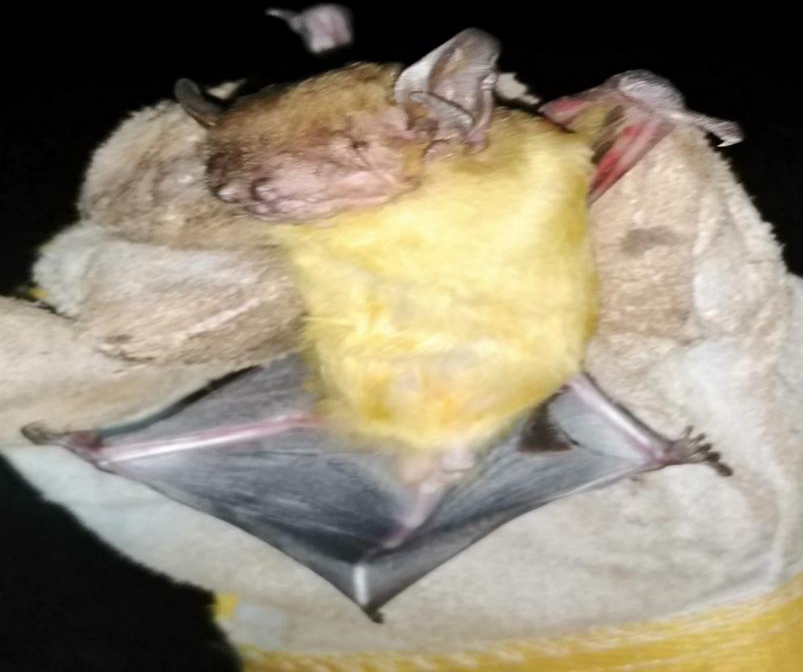
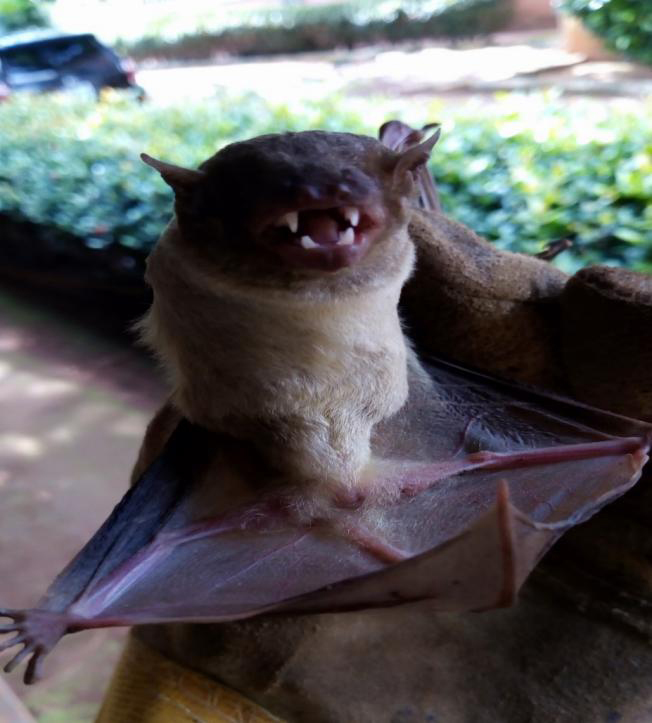
Morphological identification was performed according to Happold and Happold (2013), and specimens were deposited at the University of Nigeria’s Zoology Museum, tagged Ew, Ep, Mp, Nm, Ng, Na, Sa, and Sl.
Ethical approval
Ethical standards were upheld as per the Faculty of Biological Science Ethics and Biosafety Committee, University of Nigeria, Nsukka (Ref. Number: UNN/FBS/EC/1013).
Results
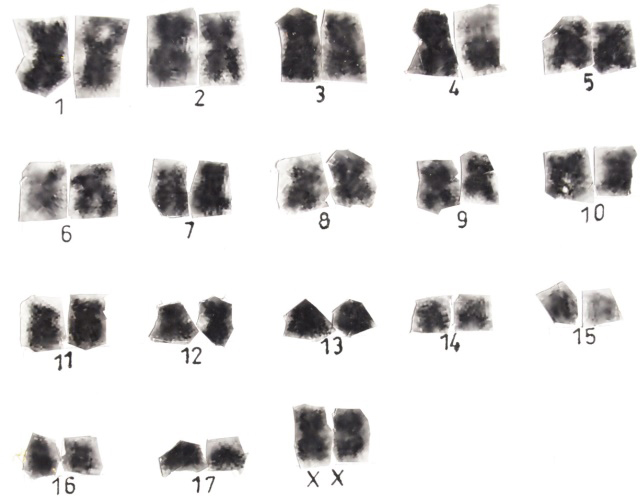
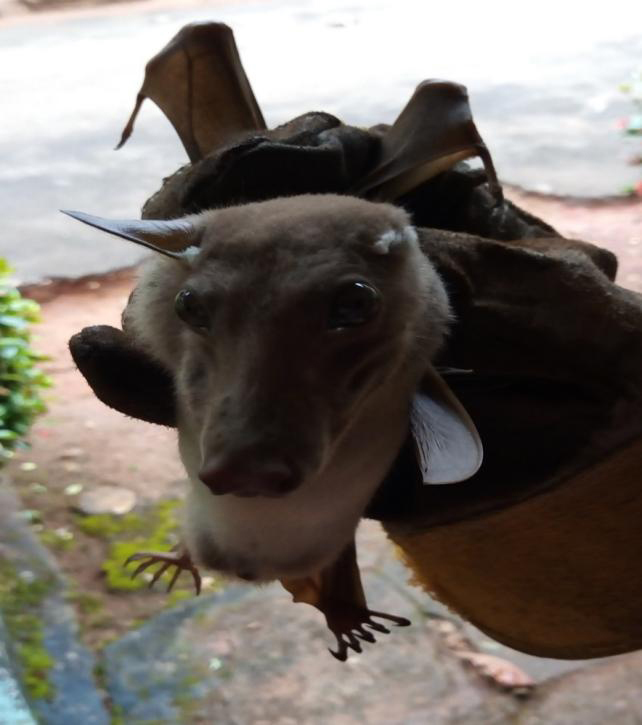
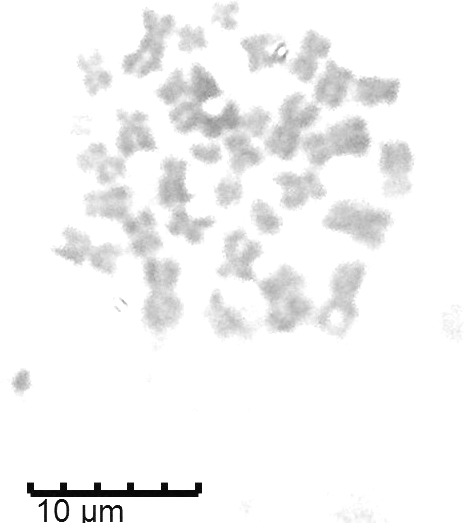
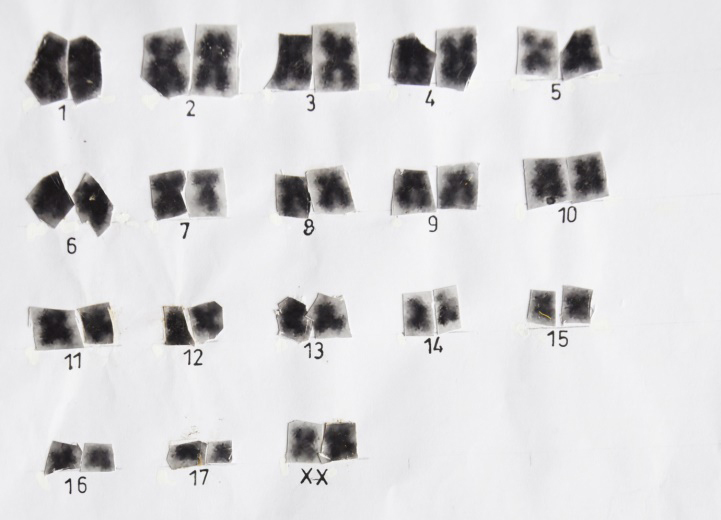
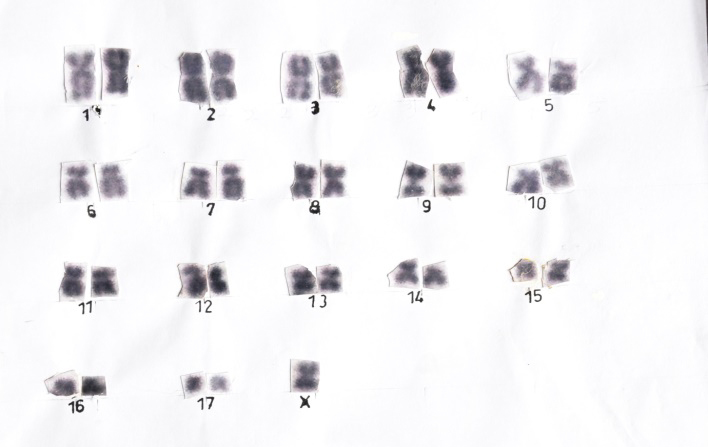
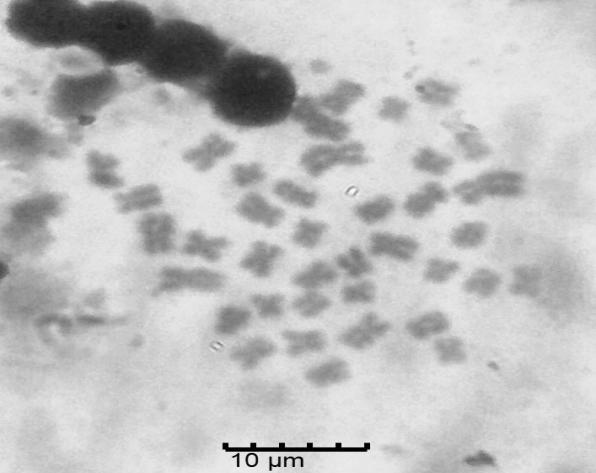
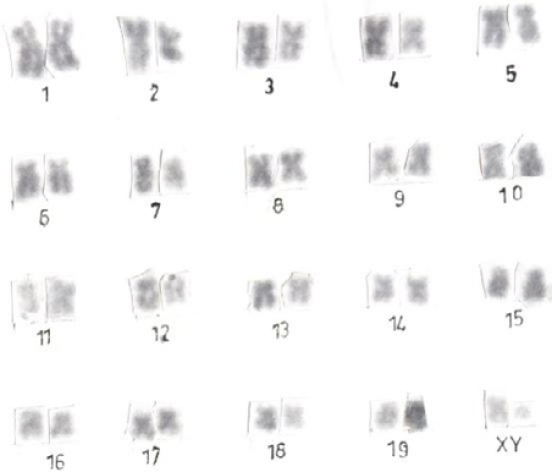
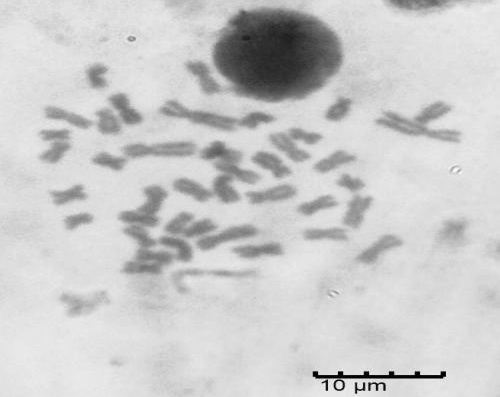
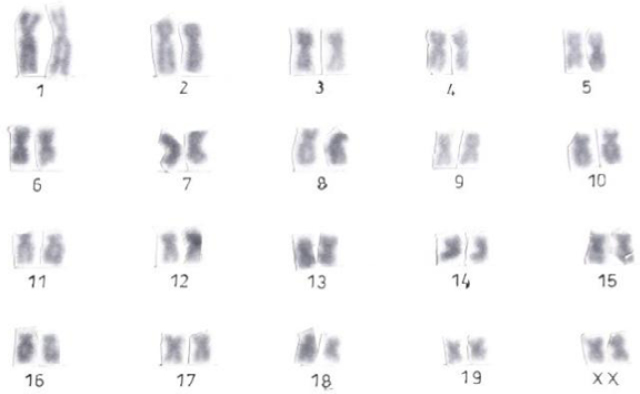
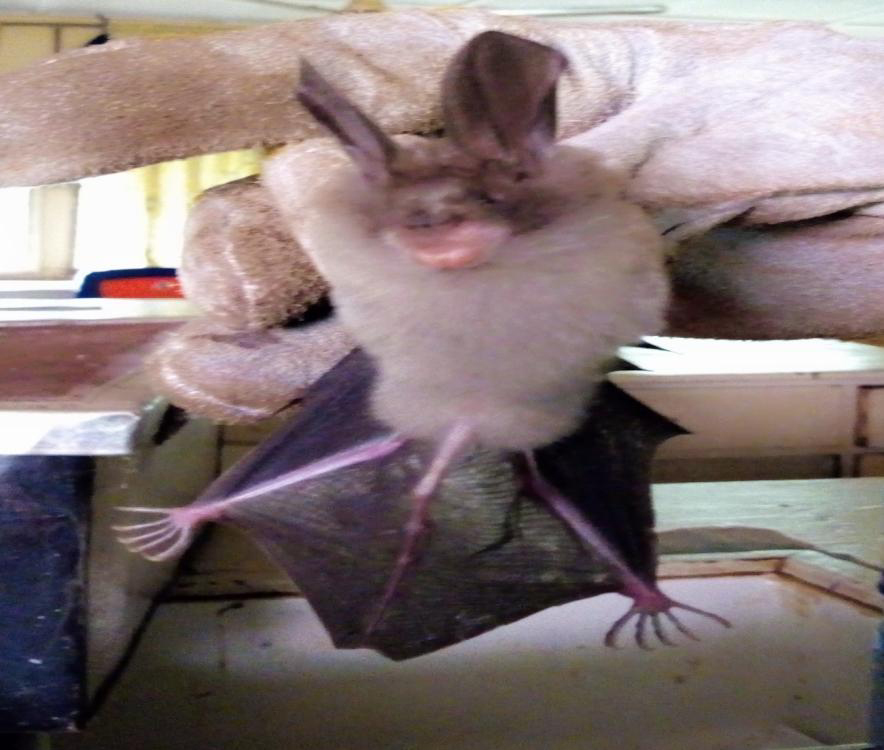
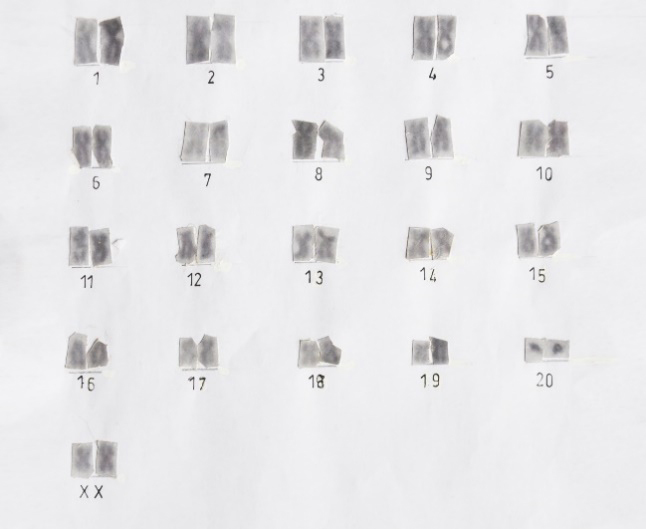
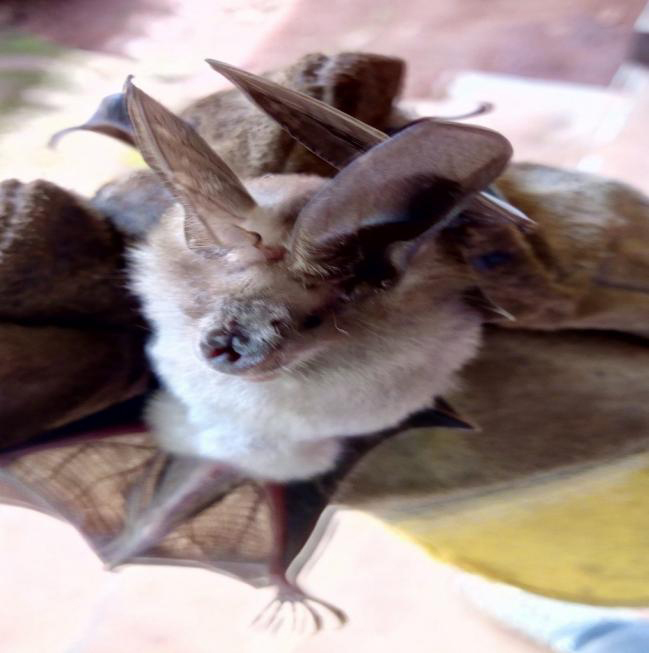
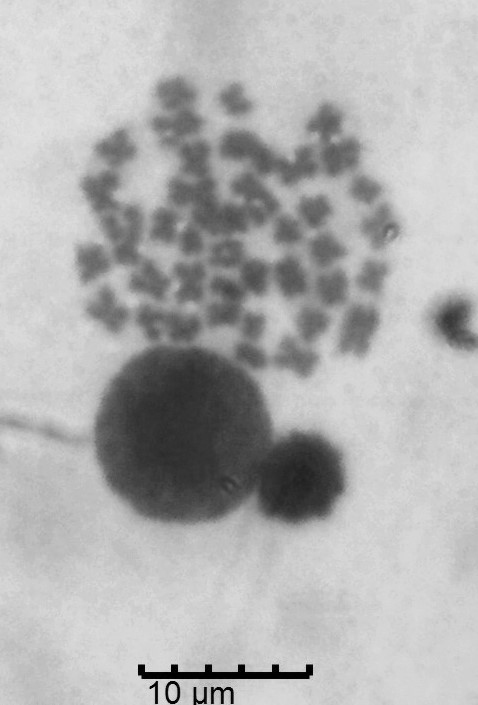
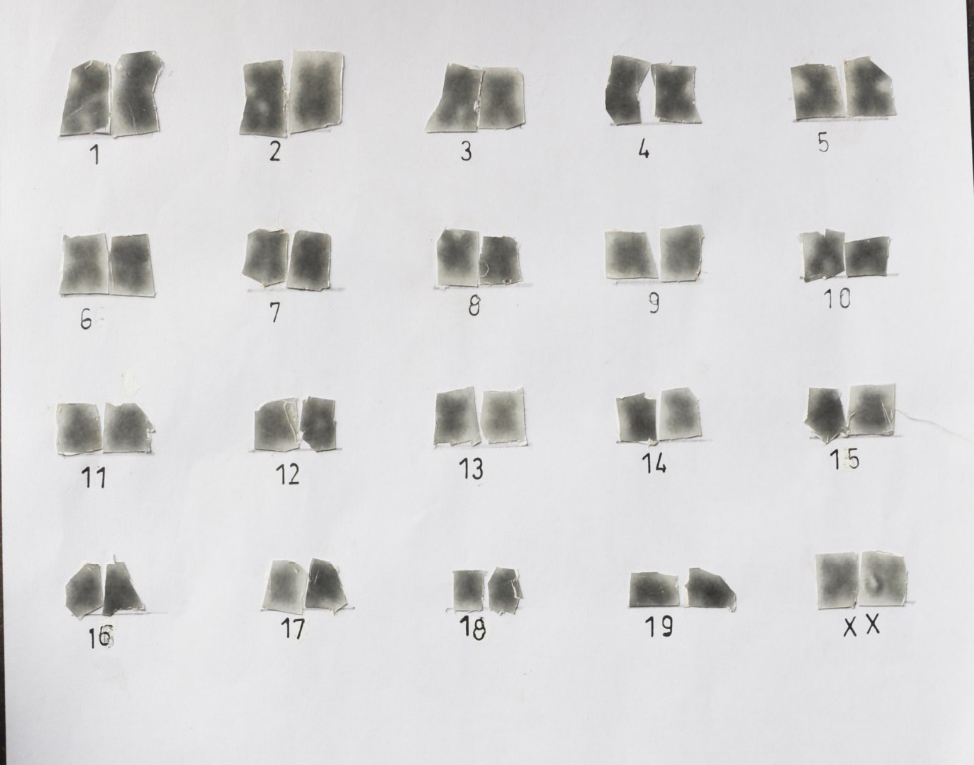
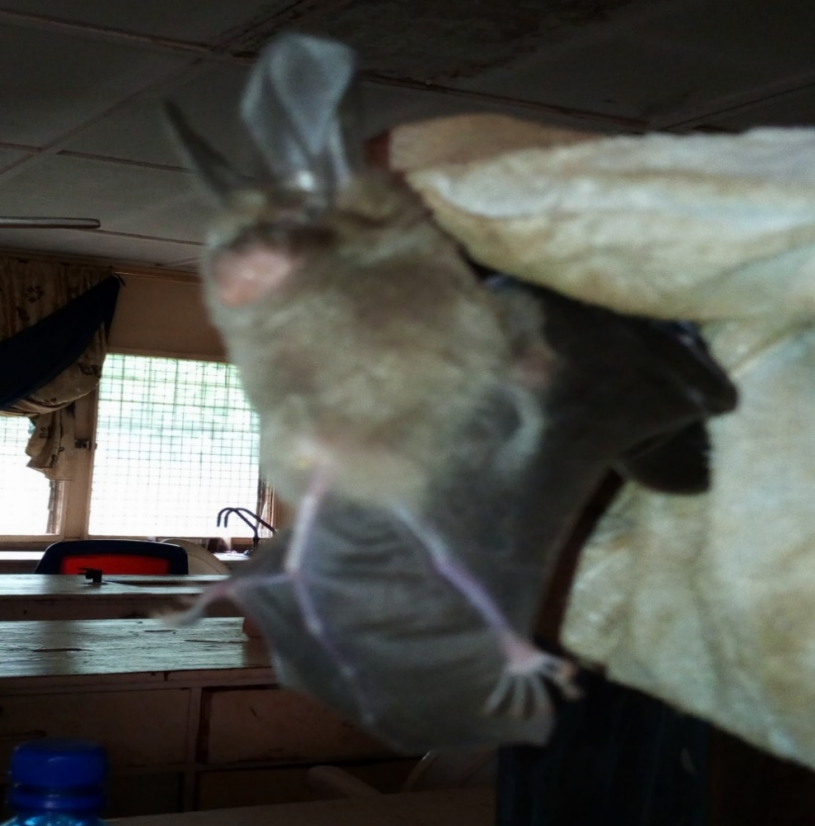
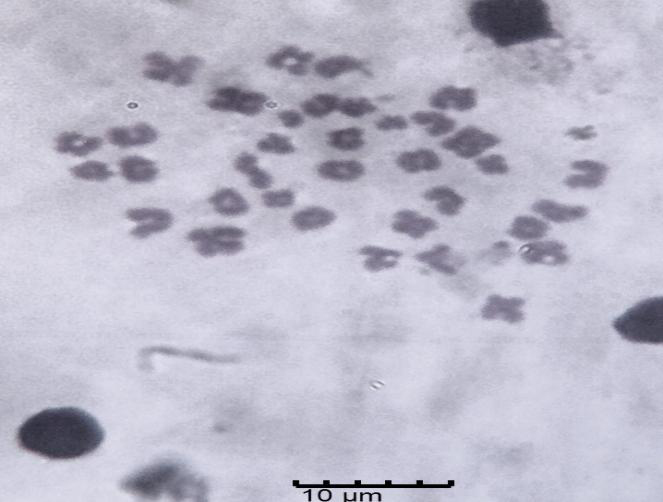
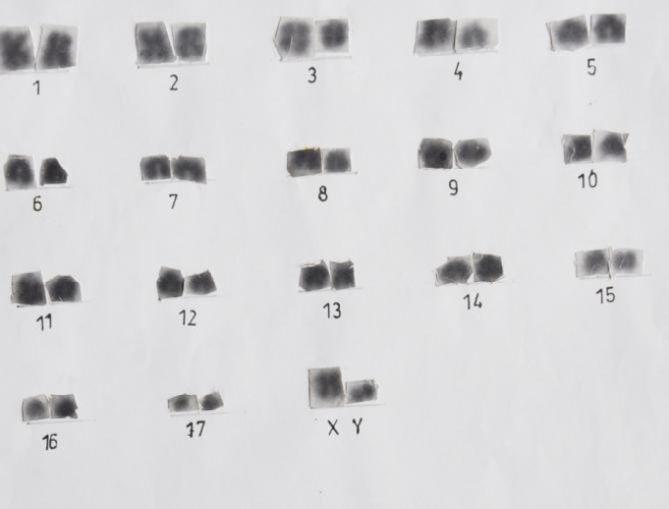
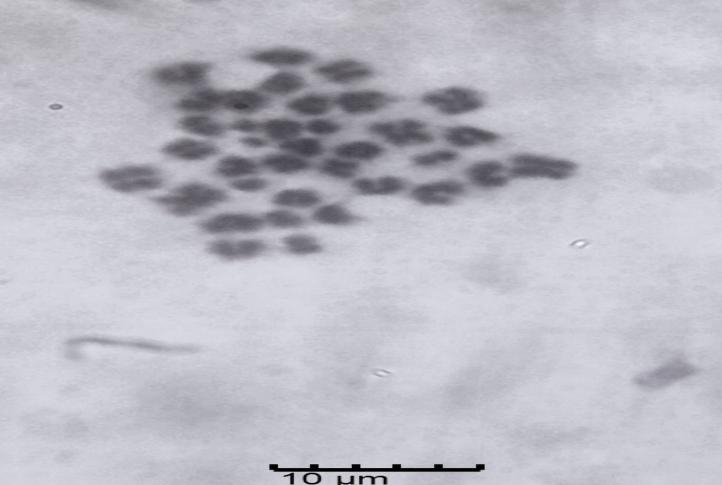
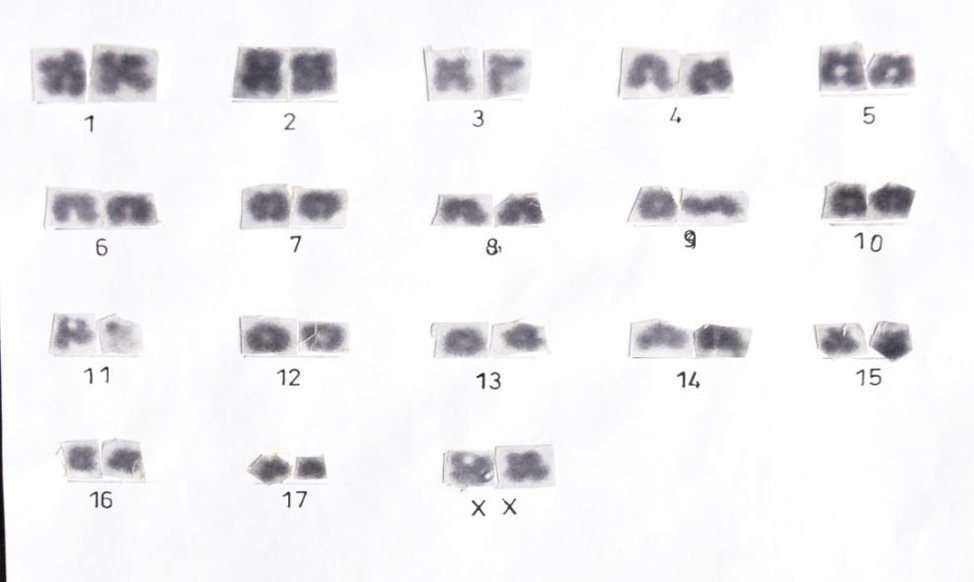
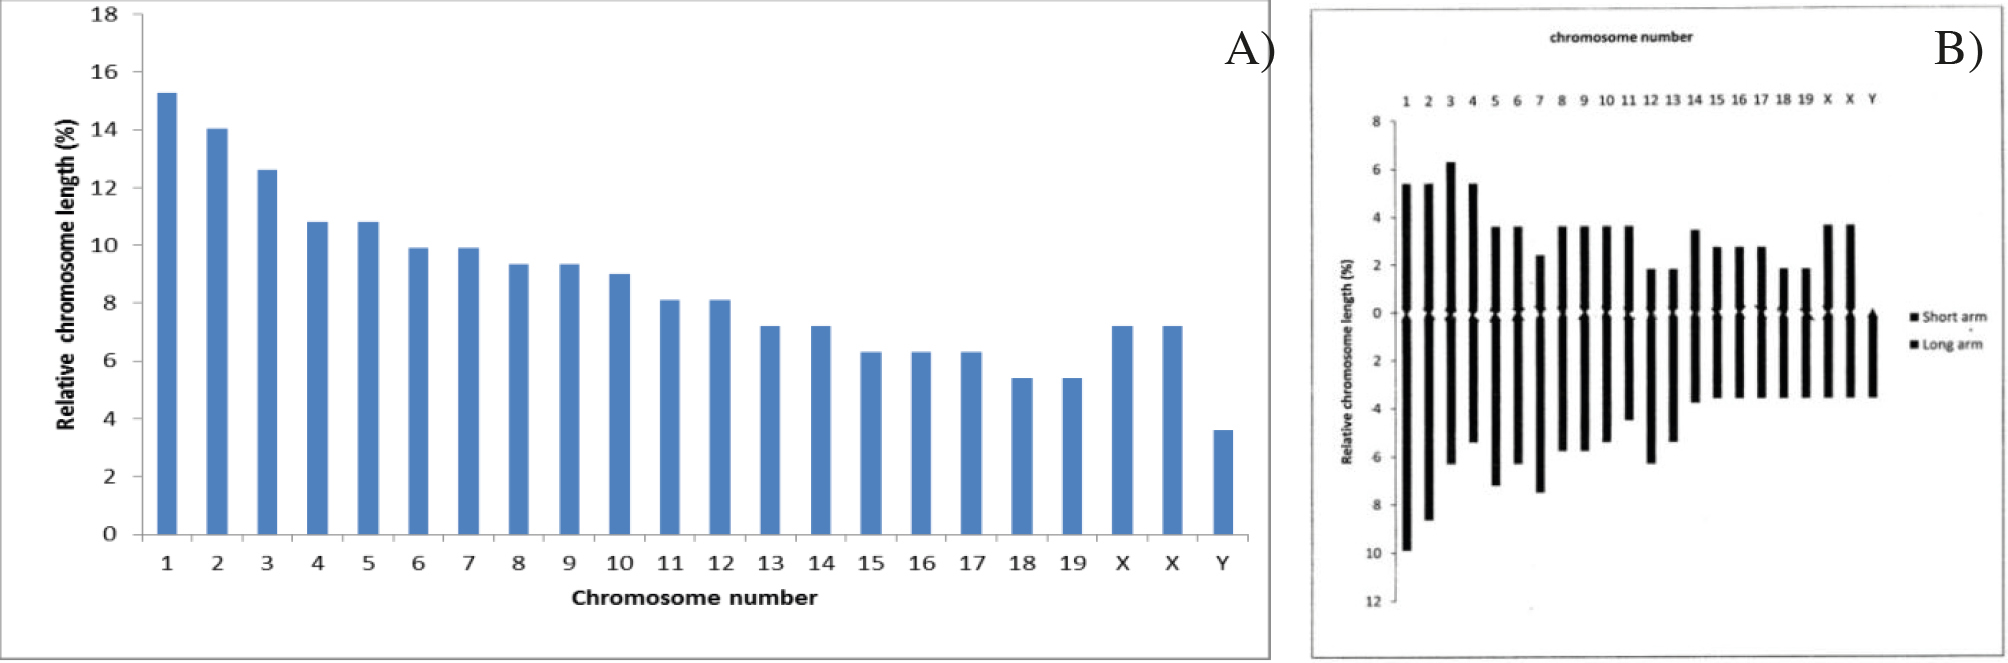
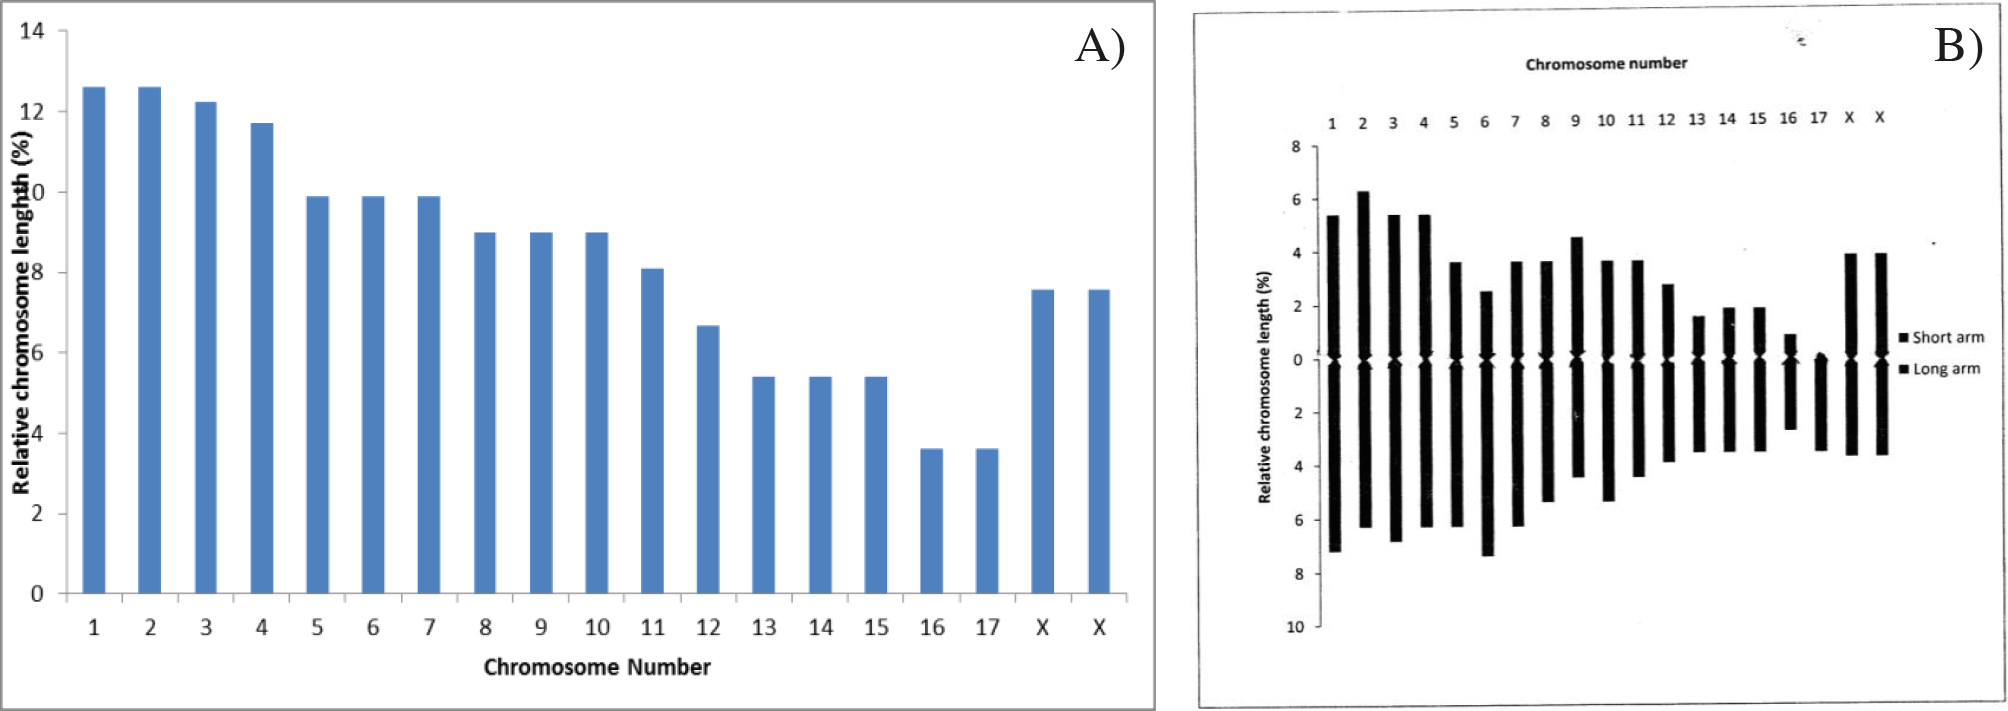
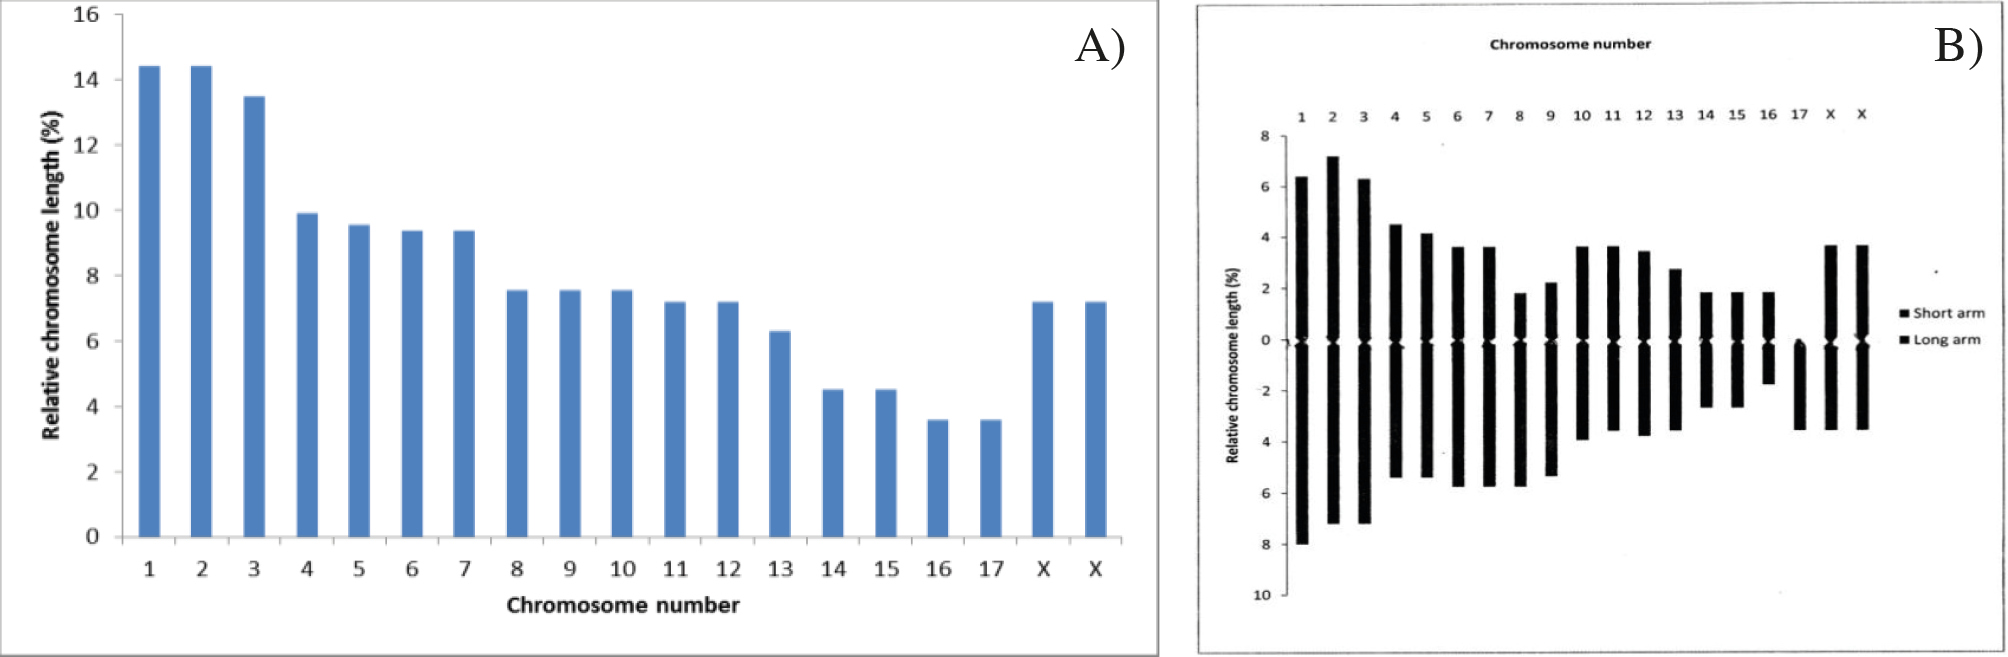
During the study, various species of bats from the families Yinpterochiropera and Yangochiroptera were identified in Nsukka LGA. The Yinpterochiropera family included Epomophorus wahlbergi, Epomophorus gambianus, and Microteropus pusillus, while the Yangochiroptera family featured Nycteris major, Nycteris grandis, and Nycteris arge. The Vespertilionidae family included Scotophilus leucogaster and Scotophilus diaganii. Table 1 presents the chromosomal numbers and fundamental numbers (FN) along with karyotype diagrams.
| S/N | Bat species | Mitotic metaphase chromosome spread | Karyotype | Diagram | Diploid chromosome number | Funda-mental number (FN) |
|---|---|---|---|---|---|---|
| 1. | Epomophorus wahlbergi | Plate 1A | Plate 1B | Plate 1C | 2n=35 | 70 |
| 2. | Epomophorus gambianus | Plate 2A | Plate 2B | Plate 2C | 2n=36 | 79 |
| 3. | Epomophorus (Microteropus) pusillus | Plate 3A | Plate 3B | Plate 3C | 2n=36 | 79 |
| 4. | Nycteris major | Plate 4A & Plate 4B | Plate 4C (male) & Plate 4D (female) | Plate 4E (male) & Plate 4F (female) | 2n=40 | 80 |
| 5. | Nycteris grandis | Plate 5A | Plate 5B (female) | Plate 5C | 2n=42 | 82 |
| 6. | Nycteris arge | Plate 6A | Plate 6B | Plate 6C | 2n=40 | 78 |
| 7. | Scotophilus diaganii | Plate 7A | Plate 7B | Plate 7C | 2n=36 | 45 |
| 8. | Scotophilus leucogaster | Plate 8A | Plate 8B | Plate 8C | 2n=36 | 54 |
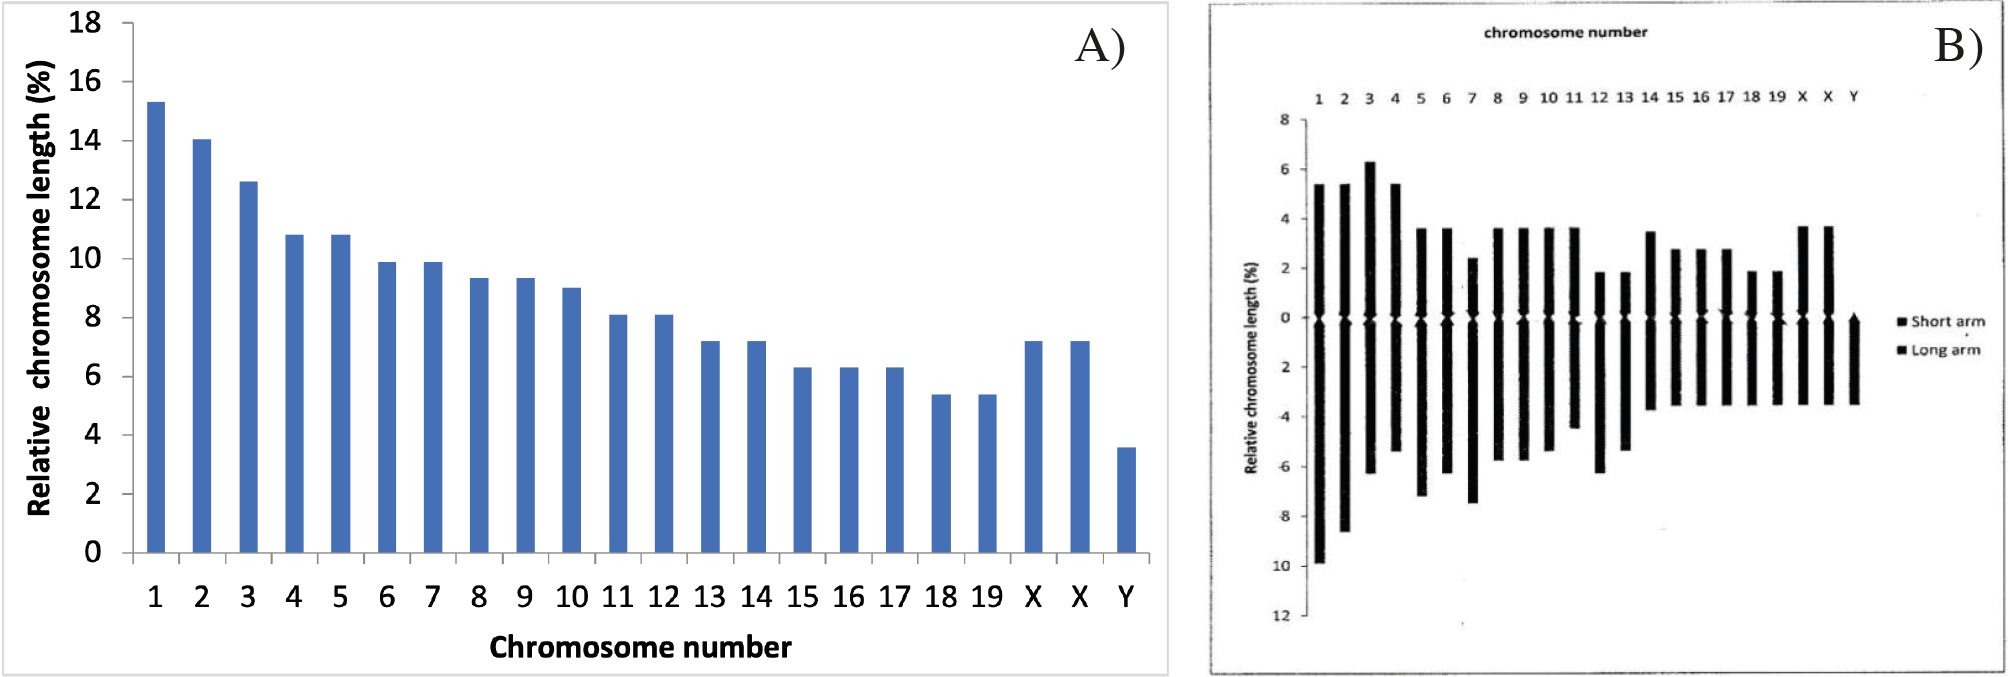
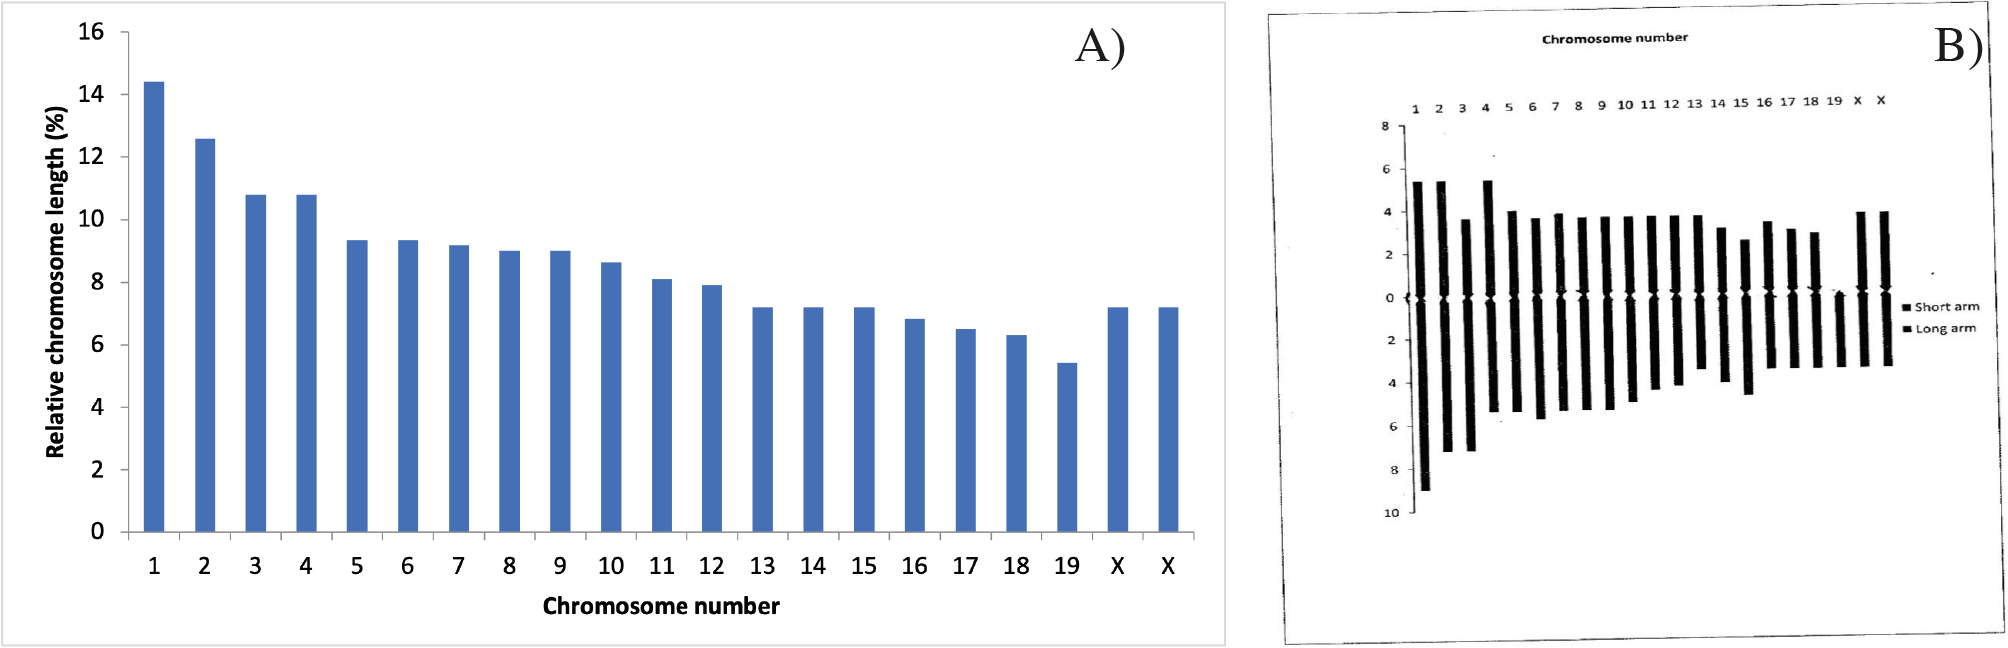
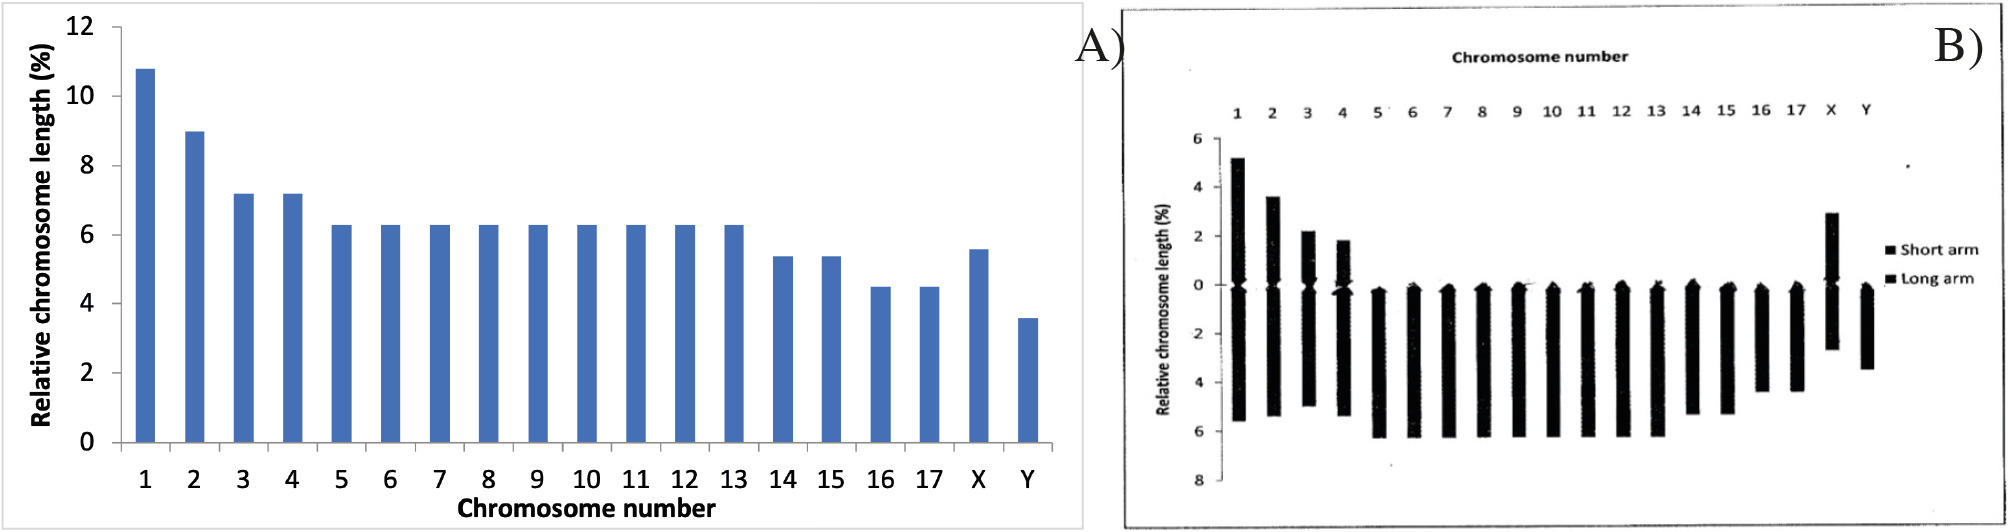
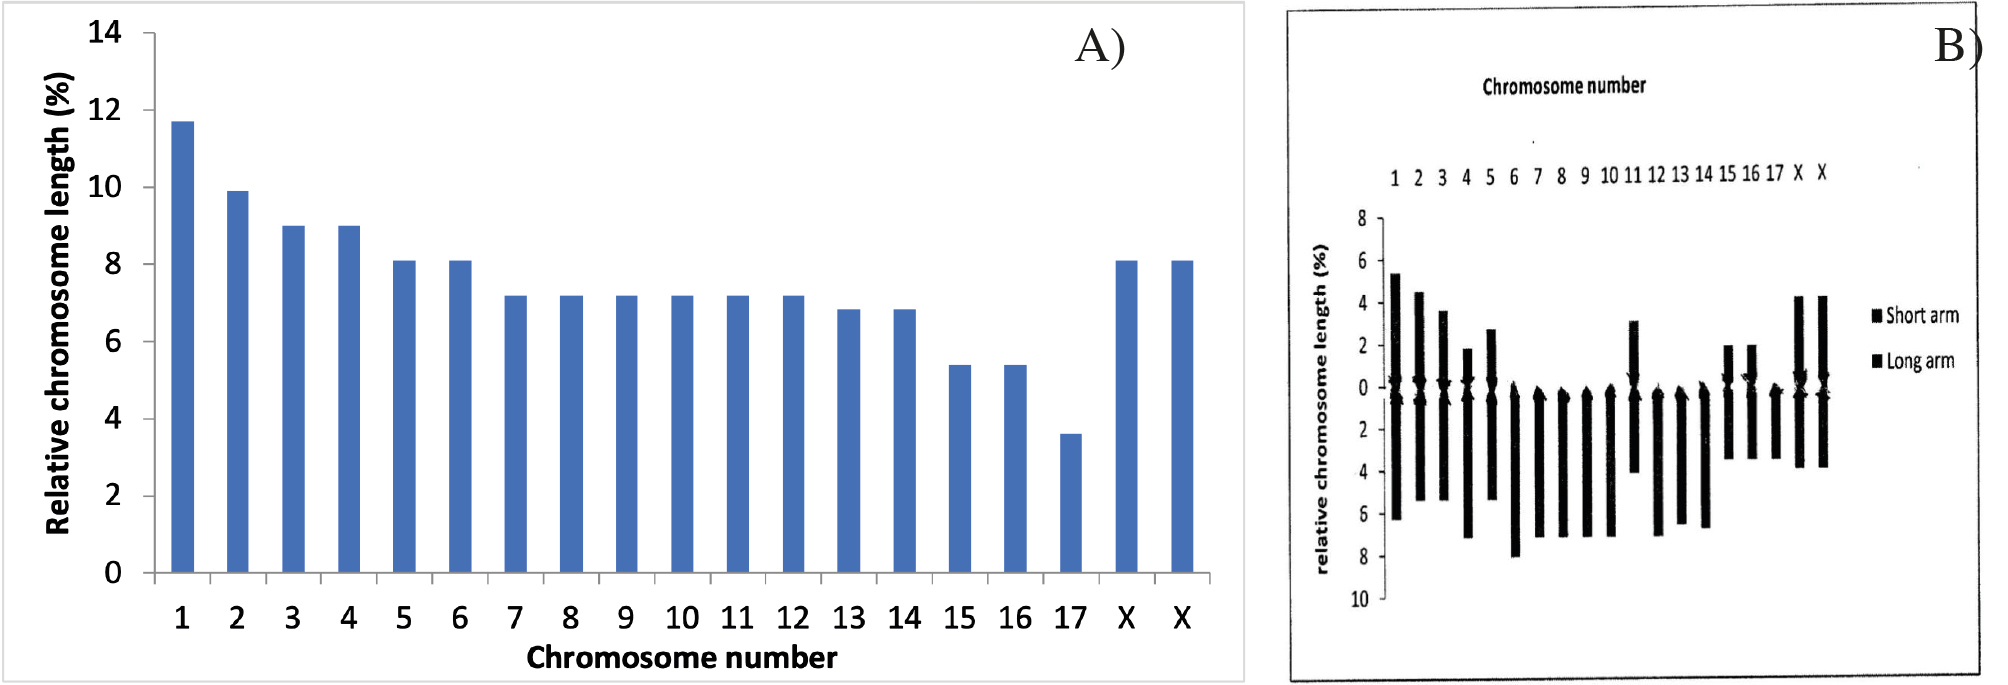
For each bat species analyzed, distinct karyotypes were established based on size. For example, in Epomophorus wahlbergi, the karyotype was categorized into three groups, with group one comprising four large chromosomes, group two including medium-sized chromosomes, and group three consisting of smaller chromosomes (Table 2). Similarly, Epomophorus gambianus and Microteropus pusillus displayed comparable karyotypic structures, with varying numbers of chromosomes in each size category (Tables 3 and 4).
| Chromosome Number | Short Arm (S) % |
Long Arm (L) |
Total Length (C) % | Centromeric Index (I) |
Nomenclature | ||||||||||||||
|---|---|---|---|---|---|---|---|---|---|---|---|---|---|---|---|---|---|---|---|
| 1. | 5.40 | 9.00 | 14.40 | 37.50 | Nearly submedian (-) | ||||||||||||||
| 2. | 7.20 | 7.20 | 14.40 | 50.00 | Median | ||||||||||||||
| 3. | 6.30 | 7.20 | 13.50 | 46.67 | Nearly median | ||||||||||||||
| 4. | 4.50 | 7.20 | 11.70 | 38.46 | Nearly median | ||||||||||||||
| 5. | 3.60 | 6.30 | 9.90 | 36.36 | Nearly submedian (-) | ||||||||||||||
| 6. | 2.80 | 6.56 | 9.36 | 29.91 | Nearly submedian (-) | ||||||||||||||
| 7. | 3.60 | 5.76 | 9.36 | 38.46 | Nearly median | ||||||||||||||
| 8. | 3.96 | 5.40 | 9.36 | 42.31 | Nearly median | ||||||||||||||
| 9. | 3.60 | 5.40 | 9.00 | 40.00 | Nearly median | ||||||||||||||
| 10. | 2.60 | 6.40 | 9.00 | 28.89 | Nearly submedian (-) | ||||||||||||||
| 11. | 2.50 | 5.60 | 8.10 | 30.86 | Nearly submedian (-) | ||||||||||||||
| 12. | 3.60 | 4.32 | 7.92 | 45.45 | Nearly median | ||||||||||||||
| 13. | 2.70 | 3.60 | 6.30 | 42.86 | Nearly median | ||||||||||||||
| 14. | 2.70 | 3.60 | 6.30 | 42.86 | Nearly median | ||||||||||||||
| 15. | 1.80 | 3.60 | 5.40 | 33.33 | Nearly submedian (-) | ||||||||||||||
| 16. | 1.80 | 1.80 | 3.60 | 50.00 | Median | ||||||||||||||
| 17. | 1.80 | 1.80 | 3.60 | 50.00 | Median | ||||||||||||||
| X. | 3.60 | 3.60 | 7.20 | 50.00 | Median | ||||||||||||||
| The chromosomal centromeric index (i) was calculated using the method i = 100s/c. In the above table, the chromosome lengths were measured in microns as described under materials and methods, and then individually converted to percentages of total complement | |||||||||||||||||||
| Chromosome Number | Short Arm (S) % |
Long Arm (L) |
Total Length (C) % | Centromeric Index (I) |
Nomenclature |
|---|---|---|---|---|---|
| 1. | 5.40 | 7.20 | 12.60 | 42.86 | Nearly median |
| 2. | 6.30 | 6.30 | 12.60 | 50.00 | Median |
| 3. | 5.40 | 6.84 | 12.24 | 44.12 | Nearly median |
| 4. | 5.40 | 6.30 | 11.70 | 46.15 | Nearly median |
| 5. | 3.60 | 6.30 | 9.90 | 36.36 | Nearly submedian (-) |
| 6. | 2.50 | 7.40 | 9.90 | 25.25 | Nearly submedian (-) |
| 7. | 3.60 | 6.30 | 9.90 | 36.36 | Nearly submedian (-) |
| 8. | 3.60 | 5.40 | 9.00 | 40.00 | Nearly median |
| 9. | 4.50 | 4.50 | 9.00 | 50.00 | Median |
| 10. | 3.60 | 5.40 | 9.00 | 40.00 | Nearly median |
| 11. | 3.60 | 4.50 | 8.10 | 44.44 | Nearly median |
| 12. | 2.70 | 3.96 | 6.66 | 40.54 | Nearly median |
| 13. | 1.50 | 3.60 | 5.40 | 33.33 | Nearly submedian (-) |
| 14. | 1.80 | 3.60 | 5.40 | 33.33 | Nearly submedian (-) |
| 15. | 1.80 | 3.60 | 5.40 | 33.33 | Nearly submedian (-) |
| 16. | 0.80 | 2.80 | 3.60 | 22.22 | Nearly submedian (+) |
| 17. | 0.00 | 3.60 | 3.60 | 0.00 | Terminal |
| X. | 3.78 | 3.78 | 7.56 | 50.00 | Median |
| X. | 3.78 | 3.78 | 7.56 | 50.00 | Median |
| Chromosome Number | Short Arm (S) % |
Long Arm (L) |
Total Length (C) % | Centromeric Index (I) |
Nomenclature |
|---|---|---|---|---|---|
| 1. | 6.40 | 8.00 | 14.40 | 44.44 | Nearly median |
| 2. | 7.20 | 7.20 | 14.40 | 50.00 | Median |
| 3. | 6.30 | 7.20 | 13.50 | 46.67 | Nearly median |
| 4. | 4.50 | 5.40 | 9.90 | 45.45 | Nearly median |
| 5. | 4.14 | 5.40 | 9.54 | 43.40 | Nearly median |
| 6. | 3.60 | 5.76 | 9.36 | 38.46 | Nearly median |
| 7. | 3.60 | 5.76 | 9.36 | 38.46 | Nearly median |
| 8. | 1.80 | 5.76 | 7.56 | 23.81 | Nearly submedian (+) |
| 9. | 2.20 | 5.36 | 7.56 | 29.10 | Nearly submedian (-) |
| 10. | 3.60 | 3.96 | 7.56 | 47.62 | Nearly median |
| 11. | 3.60 | 3.60 | 7.20 | 50.00 | Median |
| 12. | 3.40 | 3.80 | 7.20 | 47.22 | Nearly median |
| 13. | 2.70 | 3.60 | 6.30 | 42.86 | Nearly median |
| 14. | 1.80 | 2.70 | 4.50 | 40.00 | Nearly median |
| 15. | 1.80 | 2.70 | 4.50 | 40.00 | Nearly median |
| 16. | 1.80 | 1.80 | 3.60 | 50.00 | Median |
| 17. | 0.00 | 3.60 | 3.60 | 0.00 | Terminal |
| X. | 3.60 | 3.60 | 7.20 | 50.00 | Median |
| X. | 3.60 | 3.60 | 7.20 | 50.00 | Median |
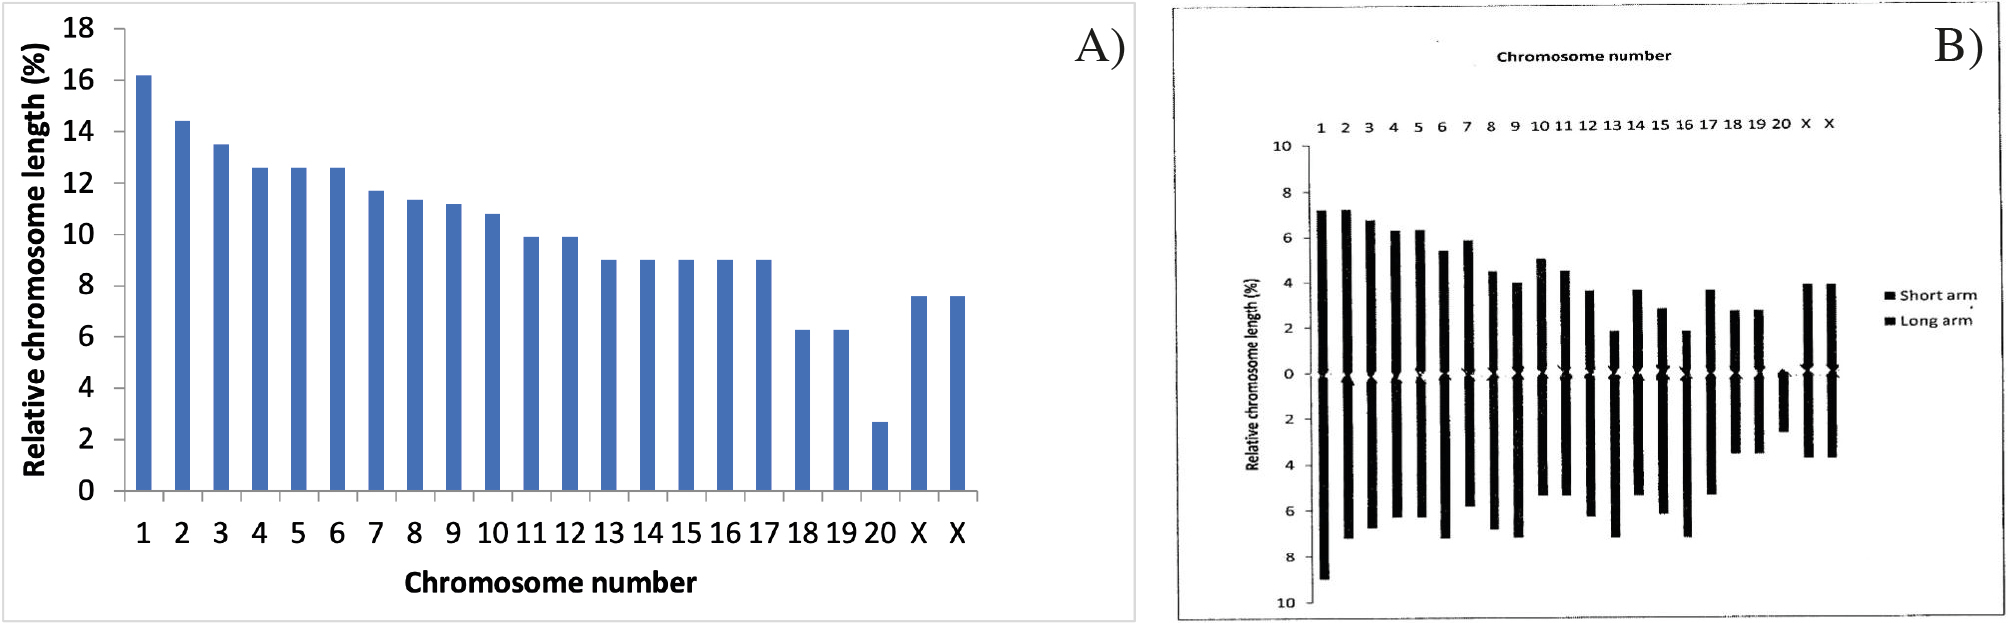
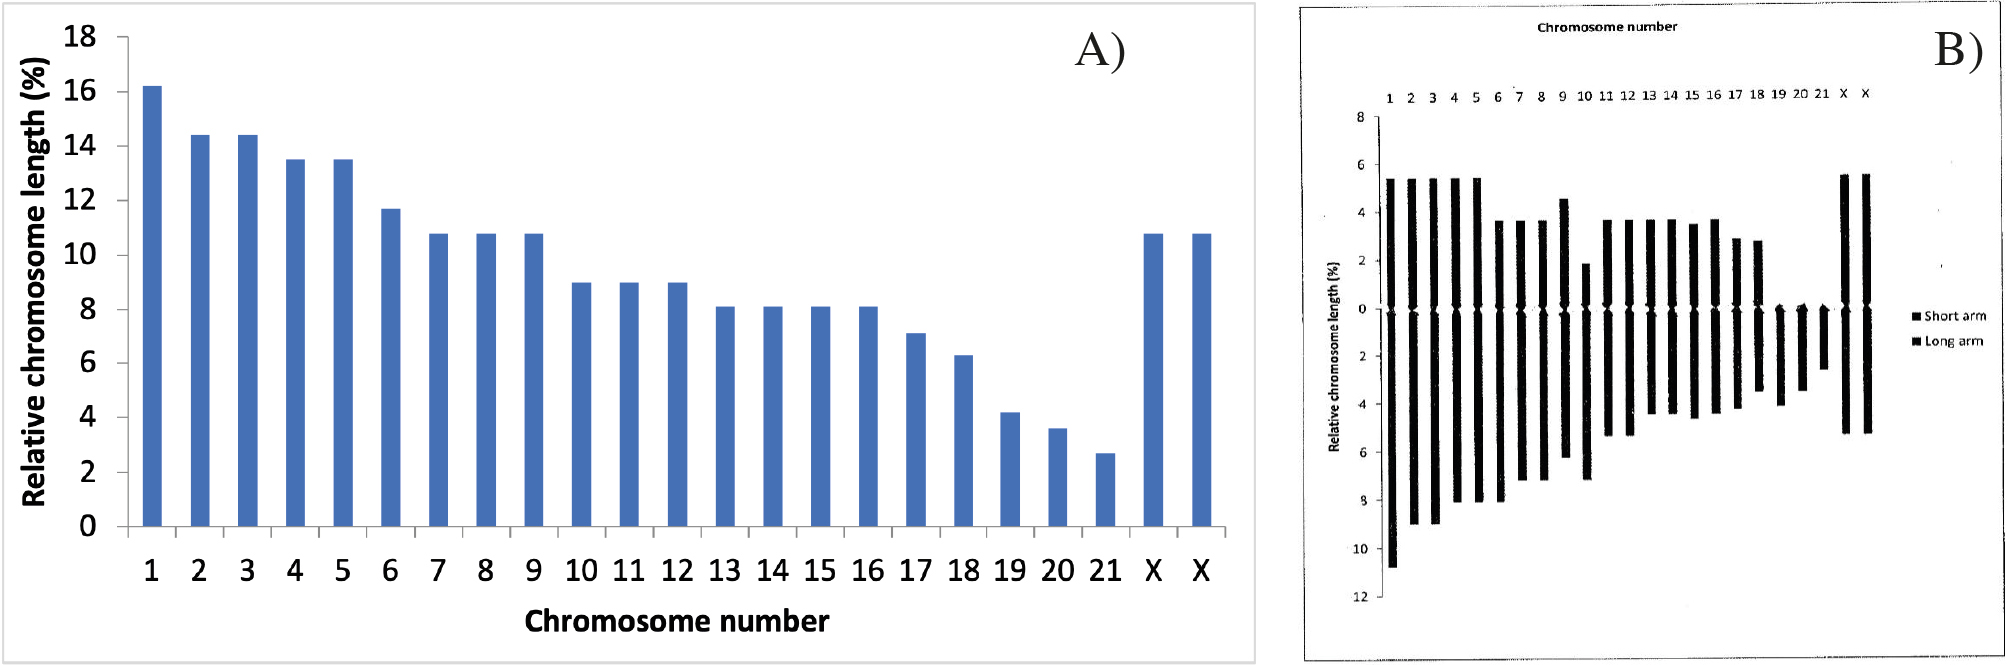
Nycteris major, Nycteris grandis, and Nycteris arge were also analyzed, revealing three main size groups in their karyotypes (Tables 5, 6 and 7). For Nycteris major, it was noted that males and females had distinct chromosome arrangements and FN. Comparisons between species showed that Yinpterochiropteran bats shared similarities, particularly in their larger chromosomes. Notably, Epomophorus wahlbergi and Epomophorus gambianus had similar chromosome structures, especially in larger and some medium-sized chromosomes.
| Chromosome Number | Short Arm (S) % |
Long Arm (L) |
Total Length (C) % | Centromeric Index (I) |
Nomenclature |
|---|---|---|---|---|---|
| 1. | 5.40 | 9.90 | 15.30 | 35.29 | Nearly sub-median (-) |
| 2. | 5.40 | 8.64 | 14.04 | 38.46 | Nearly median |
| 3. | 6.30 | 6.30 | 12.60 | 50.00 | Median |
| 4. | 5.40 | 5.40 | 10.80 | 50.00 | Median |
| 5. | 3.60 | 7.20 | 10.80 | 33.33 | Nearly submedian (-) |
| 6. | 3.60 | 6.30 | 9.90 | 36.36 | Nearly submedian (-) |
| 7. | 2.40 | 7.50 | 9.90 | 24.24 | Nearly submedian (+) |
| 8. | 3.60 | 5.76 | 9.36 | 38.46 | Nearly median |
| 9. | 3.60 | 5.76 | 9.36 | 38.46 | Nearly median |
| 10. | 3.60 | 5.40 | 9.00 | 40.00 | Nearly median |
| 11. | 3.60 | 4.50 | 8.10 | 44.44 | Nearly median |
| 12. | 1.80 | 6.30 | 8.10 | 22.22 | Nearly sub median (+) |
| 13. | 1.80 | 5.40 | 7.20 | 25.00 | Submedian |
| 14. | 3.42 | 3.78 | 7.20 | 24.62 | Nearly submedian (+) |
| 15. | 2.70 | 3.60 | 6.30 | 42.86 | Nearly median |
| 16. | 2.70 | 3.60 | 6.30 | 42.86 | Nearly median |
| 17. | 2.70 | 3.60 | 6.30 | 42.86 | Nearly median |
| 18. | 1.80 | 3.60 | 5.40 | 33.33 | Nearly submedian (-) |
| 19. | 1.80 | 3.60 | 5.40 | 33.33 | Nearly submedian (-) |
| X. | 3.60 | 3.60 | 7.20 | 50.00 | Median |
| X. | 3.60 | 3.60 | 7.20 | 50.00 | Median |
| Y. | 0.00 | 3.60 | 3.60 | 0.00 | Terminal |
| Chromosome Number | Short Arm (S) % |
Long Arm (L) |
Total Length (C) % | Centromeric Index (I) |
Nomenclature |
|---|---|---|---|---|---|
| 1. | 7.20 | 9.00 | 16.20 | 44.44 | Nearly median |
| 2. | 7.20 | 7.20 | 14.40 | 50.00 | Median |
| 3. | 6.75 | 6.75 | 13.50 | 50.00 | Median |
| 4. | 6.30 | 6.30 | 12.60 | 50.00 | Median |
| 5. | 6.30 | 6.30 | 12.60 | 50.00 | Median |
| 6. | 5.40 | 7.20 | 12.60 | 42.86 | Nearly median |
| 7. | 5.85 | 5.85 | 11.70 | 50.00 | Median |
| 8. | 4.50 | 6.84 | 11.34 | 39.68 | Nearly median |
| 9. | 3.96 | 7.20 | 11.16 | 34.14 | Nearly submedian (-) |
| 10. | 5.04 | 5.40 | 10.80 | 46.67 | Nearly median |
| 11. | 4.50 | 5.40 | 9.90 | 45.45 | Nearly median |
| 12. | 3.60 | 6.30 | 9.90 | 36.36 | Nearly submedian (-) |
| 13. | 1.80 | 7.20 | 9.00 | 20.00 | Nearly submedian (+) |
| 14. | 3.60 | 5.40 | 9.00 | 36.36 | Nearly submedian (-) |
| 15. | 2.80 | 6.20 | 9.00 | 31.11 | Nearly submedian (-) |
| 16. | 1.80 | 7.20 | 9.00 | 20.00 | Nearly submedian (+) |
| 17. | 3.60 | 5.40 | 9.00 | 36.36 | Nearly submedian (-) |
| 18. | 2.70 | 3.60 | 6.30 | 42.86 | Nearly median |
| 19. | 2.70 | 3.60 | 6.30 | 42.36 | Nearly median |
| 20. | 0.00 | 2.70 | 2.70 | 0.00 | Terminal |
| X. | 3.80 | 3.80 | 7.60 | 50.00 | Median |
| X. | 3.80 | 3.80 | 7.60 | 50.00 | Median |
| Chromosome Number | Short Arm (S) % |
Long Arm (L) |
Total Length (C) % | Centromeric Index (I) |
Nomenclature |
|---|---|---|---|---|---|
| 1. | 5.40 | 9.00 | 14.40 | 37.50 | Nearly submedian (-) |
| 2. | 5.40 | 7.20 | 12.60 | 42.86 | Nearly median |
| 3. | 3.60 | 7.20 | 10.80 | 33.33 | Nearly submedian (-) |
| 4. | 5.40 | 5.40 | 10.80 | 50.00 | Median |
| 5. | 3.96 | 5.40 | 9.36 | 42.31 | Nearly median |
| 6. | 3.60 | 5.76 | 9.36 | 38.46 | Nearly median |
| 7. | 3.78 | 5.40 | 9.18 | 41.18 | Nearly median |
| 8. | 3.60 | 5.40 | 9.00 | 40.00 | Nearly median |
| 9. | 3.60 | 5.40 | 9.00 | 40.00 | Nearly median |
| 10. | 3.60 | 5.04 | 8.64 | 41.67 | Nearly median |
| 11. | 3.60 | 4.50 | 8.10 | 44.44 | Nearly median |
| 12. | 3.60 | 4.32 | 7.92 | 45.45 | Nearly median |
| 13. | 3.60 | 3.60 | 7.20 | 50.00 | Median |
| 14. | 3.00 | 4.20 | 7.20 | 41.67 | Nearly median |
| 15. | 2.40 | 4.80 | 7.20 | 33.33 | Nearly submedian (-) |
| 16. | 3.24 | 3.60 | 6.84 | 47.37 | Nearly median |
| 17. | 2.88 | 3.60 | 6.48 | 44.44 | Nearly median |
| 18. | 2.70 | 3.60 | 6.30 | 43.86 | Nearly median |
| 19. | 0.00 | 3.60 | 5.40 | 0.00 | Terminal |
| X. | 3.60 | 3.60 | 7.20 | 50.00 | Median |
| X. | 3.60 | 3.60 | 7.20 | 50.00 | Median |
Scotophilus diaganii and Scotophilus leucogaster each had a single large chromosome (Tables 8 and 9), while other species exhibited a range of large and small chromosomes, indicating potential phylogenetic relationships. Differences in chromosomal counts and structural characteristics were highlighted, with telocentric chromosomes prevalent in the Scotophilus species. Table 10 summarizes that all bat species had at least one large chromosome, with specific similarities and differences noted in their karyotypic features (Figure 3).
| Chromosome Number | Short Arm (S) % |
Long Arm (L) |
Total Length (C) % | Centromeric Index (I) |
Nomenclature |
|---|---|---|---|---|---|
| 1. | 5.20 | 5.60 | 10.80 | 48.15 | Nearly median |
| 2. | 3.60 | 5.40 | 9.00 | 40.00 | Nearly median |
| 3. | 2.20 | 5.00 | 7.20 | 30.56 | Nearly submedian (-) |
| 4. | 1.80 | 5.40 | 7.20 | 25.00 | Submedian |
| 5. | 0.00 | 6.30 | 6.30 | 0.00 | Terminal |
| 6. | 0.00 | 6.30 | 6.30 | 0.00 | Terminal |
| 7. | 0.00 | 6.30 | 6.30 | 0.00 | Terminal |
| 8. | 0.00 | 6.30 | 6.30 | 0.00 | Terminal |
| 9. | 0.00 | 6.30 | 6.30 | 0.00 | Terminal |
| 10. | 0.00 | 6.30 | 6.30 | 0.00 | Terminal |
| 11. | 0.00 | 6.30 | 6.30 | 0.00 | Terminal |
| 12. | 0.00 | 6.30 | 6.30 | 0.00 | Terminal |
| 13. | 0.00 | 6.30 | 6.30 | 0.00 | Terminal |
| 14. | 0.00 | 5.40 | 5.40 | 0.00 | Terminal |
| 15. | 0.00 | 5.40 | 5.40 | 0.00 | Terminal |
| 16. | 0.00 | 4.50 | 4.50 | 0.00 | Terminal |
| 17. | 0.00 | 4.50 | 4.50 | 0.00 | Terminal |
| X. | 2.80 | 2.80 | 5.60 | 50.00 | Median |
| Y. | 0.00 | 3.60 | 3.60 | 0.00 | Terminal |
| Chromosome Number | Short Arm (S) % |
Long Arm (L) |
Total Length (C) % | Centromeric Index (I) |
Nomenclature |
|---|---|---|---|---|---|
| 1. | 5.40 | 6.30 | 11.70 | 46.15 | Nearly median |
| 2. | 4.50 | 5.40 | 9.90 | 45.45 | Nearly median |
| 3. | 3.60 | 5.40 | 9.00 | 40.00 | Nearly median |
| 4. | 1.80 | 7.20 | 9.00 | 20.00 | Nearly submedian (+) |
| 5. | 2.70 | 5.40 | 8.10 | 33.33 | Nearly sub median (-) |
| 6. | 0.00 | 8.10 | 8.10 | 0.00 | Terminal |
| 7. | 0.00 | 7.20 | 7.20 | 0.00 | Terminal |
| 8. | 0.00 | 7.20 | 7.20 | 0.00 | Terminal |
| 9. | 0.00 | 7.20 | 7.20 | 0.00 | Terminal |
| 10. | 0.00 | 7.20 | 7.20 | 0.00 | Terminal |
| 11. | 3.00 | 4.20 | 7.20 | 41.67 | Nearly median |
| 12. | 0.00 | 7.20 | 7.20 | 0.00 | Terminal |
| 13. | 0.00 | 6.64 | 6.84 | 0.00 | Terminal |
| 14. | 0.00 | 6.84 | 6.84 | 0.00 | Terminal |
| 15. | 1.80 | 3.60 | 5.40 | 33.33 | Nearly submedian (-) |
| 16. | 1.80 | 3.60 | 5.40 | 33.33 | Nearly submedian (-) |
| 17. | 0.00 | 3.60 | 3.60 | 0.00 | Terminal |
| X. | 4.05 | 4.05 | 8.10 | 50.00 | Median |
| X. | 4.05 | 4.05 | 8.10 | 50.00 | Median |
| Chromosome Number | Epomophorus wahlbergi | Epomophorus gambianus | Microteropus pusillus | Nycteris major | Nycteris grandis | Nycteris species | Nycteris arge | Scotophilus diaganii (yellow-bellied bat) | Scotophilus lecuogaster (white-bellied bat) | ||||||||||
|---|---|---|---|---|---|---|---|---|---|---|---|---|---|---|---|---|---|---|---|
| 1. | L, Sm | L, Sm | L, Sm | L, Ac | L, Sm | L, Ac | L, Ac | L, Mc | L, Sm | ||||||||||
| 2. | L, Mc | L, Mc | L, Mc | L, Sm | L, Mc | L, Ac | L, Sm | M, Sm | M, Sm | ||||||||||
| 3. | L, Sm | L, Sm | L, Sm | L, Mc | L, Mc | L, Ac | L, Ac | M, Tc | M, Sm | ||||||||||
| 4. | L, Sm | L, Sm | M, Sm | L, Mc | L, Mc | L, Sm | L, Mc | M, Ac | M, Sm | ||||||||||
| 5. | M, Ac | M, Ac | M, Sm | L, Ac | L, Mc | L, Sm | M, Sm | S, Tc | M, Sm | ||||||||||
| 6. | M, Ac | M, Ac | M, Sm | M, Ac | L, Sm | L, Ac | M, Sm | S, Tc | M, Ac | ||||||||||
| 7. | M, Sm | M, Ac | M, Sm | M, Ac | L, Mc | L, Ac | M, Sm | S, Tc | M, Tc | ||||||||||
| 8. | M, Sm | M, Sm | M, Ac | M, Mc | L, Sm | L, Mc | M, Sm | S, Tc | M, Tc | ||||||||||
| 9. | M, Sm | M, Mc | M, Ac | M, Mc | L, Ac | L, Sm | M, Sm | S, Tc | M, Tc | ||||||||||
| 10. | M, Ac | M, Sm | M, Sm, | M, Mc | L, Sm | M, Ac | M, Sm | S, Tc | M, Tc | ||||||||||
| 11. | M, Ac | M, Sm | M, Mc | M, Mc | M, Sm | M, Sm | M, Sm | S, Tc | M, Tc | ||||||||||
| 12. | M, Sm | S, Sm | M, Sm | M, Ac | M, Ac | M, Sm | M, Sm | S, Tc | M, Tc | ||||||||||
| 13. | S, Mc | S, Ac | M, Ac | M, Ac | M, Ac | M, Sm | M, Mc | S, Tc | S, Tc | ||||||||||
| 14. | S, Sm | S, Ac | S, Sm | M, Ac | M, Ac | M, Sm | M, Sm | S, Tc | S, Tc | ||||||||||
| 15. | S, Ac | S, Ac | S, Sm | S, Sm | M, Ac | M, Sm | M, Sm | S, Tc | S, Ac | ||||||||||
| 16. | S, Mc | S, Ac | S, Sm | S, Sm | M, Ac | M, Sm | S, Sm | S, Tc | S, Ac | ||||||||||
| 17. | S, Mc | S, Tc | S, Tc | S, Sm | M, Ac | M, Sm | S, Sm | S, Tc | S, Tc | ||||||||||
| 18. | S, Ac | S, Sm | S, Sm | S, Sm | |||||||||||||||
| 19. | S, Ac | S, Sm | S, Tc | S, Ac | |||||||||||||||
| 20. | S, Tc | S, Tc | |||||||||||||||||
| 21. | S, Tc | ||||||||||||||||||
| Key: L = Large; M = Medium; S = Small; Submetacentric = Sm; Metacentric = Mc; Acrocentic = Ac; Telocentric =Tc. | |||||||||||||||||||
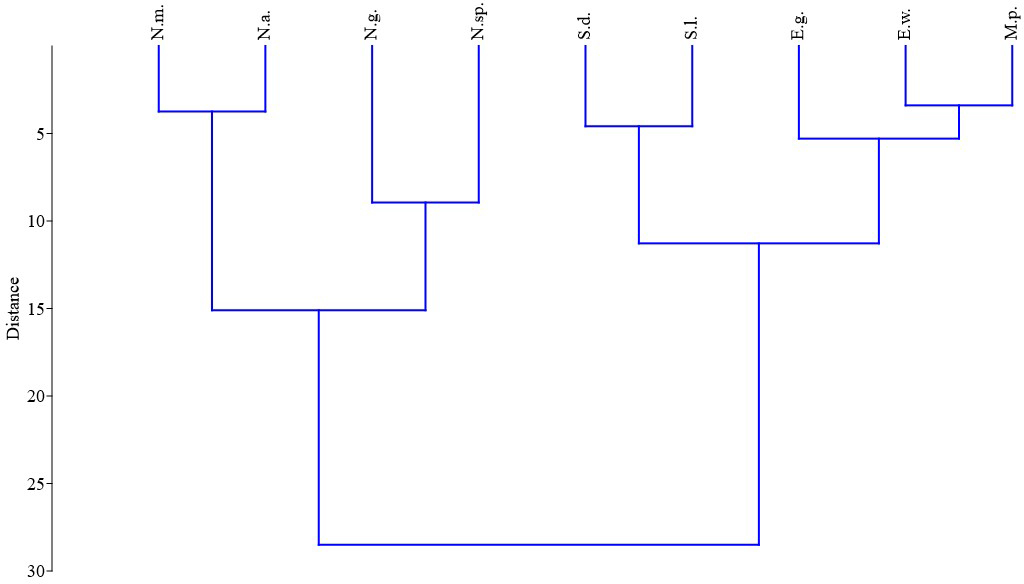
Key:
• Epomophorus wahlbergi = E.w.,
• Epomophorus gambianus = E.g.,
• Microteropus pusillus = M.p.,
• Nycteris major = N.m.,
• Nycteris grandis = N.g.,
• Nyceris arge = N.a.,
• Sctotophilus diaganii = S.d., and Scotophilus lecuogaster = s.l
Discussion
This study identified bat species from the Megachiroptera (frugivorous bats) and Microchiroptera (insectivorous bats), each exhibiting one large chromosome. The diploid chromosome number (2n) of the bat species analyzed ranged from 35 to 42, aligning with the known chromosome diversity in bats (2n=14 to 64) (Cibele et al. 2017). This indicates a high degree of conservation in diploid chromosome numbers among bat groups (Cibele et al. 2017).
The Pteropodidae family (fruit bats) displayed a chromosome range of 35-36, similar to the 2n range of 24-58 reported by Sotero-Caio et al. (2017). Specifically, Epomophorus wahlbergi was found to have 2n=35 and FN=70, differing from Kenyan and Zimbabwean species with 2n=36, FN=68 (Dulic and Mutere 1975; Peterson and Nagorsen 1975). This study confirms Epomophorus wahlbergi follows the X0 sex chromosome system. Epomophorus gambianus exhibited 2n=36 and FN=70, aligning with the XX system for Epomophorus species. Microteropus pusillus currently known as Epomophorus pusillus also displayed 2n=36 and FN=70, contrasting with prior reports of 2n=35, FN=64 in Cameroon (Haiduk et al. 1981).
The Nycteridae family was characterized by varying diploid numbers, with Nycteris major showing 2n=40 (FN=79 for males, FN=80 for females) and Nycteris grandis reported as 2n=42 (FN=82) (Porter et al. 2010). There were notable morphological and chromosomal differences observed among species within this family, which is classified into Nycteris with diploid counts ranging from 2n=34 to 42 (Denys et al. 2013).
In the Vespertilionidae family, Scotophilus diaganii presented 2n=36 and FN=45, consistent with South African specimens but differing in FN (52 and 50) reported by Schlitter et al. (1980) and Ruedas et al. (1990). Scotophilus leucogaster’s karyotype showed 2n=36, FN=54, differing from reports of 50 for specimens in Namibia and Burkina Faso (Ruedas et al. 1990; Volleth et al. 2006).
The chromosomes of these bat species differ from those of lizards, suggesting genus-specific variations. As research advances to molecular levels, previously misclassified species are being correctly positioned within taxonomic frameworks, revealing geographic influences on chromosomal variations (Foley et al. 2017). Notable patterns of karyotype similarities were identified across species, potentially linked to cryptic species and geographical isolation (Cibele et al. 2017).
In summary, this detailed study of the cytogenetics of bat species in Nsukka reported karyotypes for eight species: Epomophorus wahlbergi (2n=35), Epomophorus gambianus (2n=36), Microteropus pusillus (2n=36), Nycteris major (2n=40), Nycteris grandis (2n=42), Nycteris arge (2n=40), Scotophilus diaganii (2n=36), and Scotophilus leucogaster (2n=36). Further research utilizing modern cytogenetic techniques is needed to fill knowledge gaps in this field.
Author contribution statement
Chinedu Innocent Ngene and Vincent Chinwendu Ejere: conceptualization of the project research; Chinedu Innocent Ngene and Elijah Sunday Okwuonu: data collection; Chinedu Innocent Ngene: lab work; Chinedu Innocent Ngene, Elijah Sunday Okwuonu, Ifeanyi Damian Ogbonna and Chinaza Blessing Ukwueze: manuscript drafting and review
Acknowledgements
We thank the Small Mammal Conservation Organization (SMACON) for providing harp traps and mist nets. We also thank Johnmartin Oforkansi, Samson Ugwuanyi, Elijah Okwuonu, Osita Ezeugwu, and Francis Abonyi, for assisting in the field. Finally, we are grateful to Professor Vincent C. Ejere, and the late Prof. Felicia C. Eke, for providing chemicals, equipment, and instructions for chromosomal extractions.
References
Abraham Z. & Prasad PN. (1983). A system of chromosome classification and nomenclature. Cytologia, 48, 95–101. https://doi.org/10.1508/cytologia.48.95.
Adegoke JA. & Ejere VC. Description of the chromosomes of three lizard species belonging to the genus, Mabuya (Scincidae, Reptilia). Caryologia, 44, 333–342. https://doi.org/10.1080/00087114.1991.10797199.
Anthony SJ, Johnson CK, Greig DJ, Kramer S, Che X et al. (2017). Global patterns in coronavirus diversity. Virus Evolution, 3(1), vex012. https://doi.org/10.1093/ve/vex012.
Austad SN. (2010). Methuselah’s zoo: how nature provides us with clues for extending human health span. Journal of Comparative Pathology, 142, S10–S21. https://doi.org/10.1016/j.jcpa.2009.10.024.
Baker RJ. & Bickham JW. (1980). Karyotypic evolution in bats: Evidence of extensive and conservative chromosomal evolution in closely related taxa. Systematic Zoology, 29(3), 239–253. https://doi.org/10.2307/2412660.
Bickman JW. (1979). Banded Karyotypes of 11 Species of American Bats (Genus Myotis). Journal of Mammalogy, 60, 350 – 363. https://doi.org/10.2307/1379807.
Brook CE. & Dobson AP. (2015). Bats as “special” reservoirs for emerging zoonotic pathogens. Current Trends Microbiology, 23(3), 172–180.
Bulkina TM. & Kruskop SV. (2009). Search for morphological differences between genetically distinct brown long-eared bats (Plecotus auritus s. lato, Vespertilionidae). Plecotus, 11-12: 3–13.
Bumrungsri S, Lang D, Harrower C, Sripaoraya E, Kitpipit K and Racey PA. (2013). The dawn bat, Eonycteris spelaea Dobson (Chiroptera: Pteropodidae) feeds mainly on pollen of economically important food plants in Thailand. Acta Chiropterologica, 15(1), 95–104. https://doi.org/10.3161/150811013X667894.
Cibele G. Sotero-Caio, Robert J. Baker, and Marianne Volleth (2017). Chromosomal evolution in Chiroptera. Genes, 8, 273. https://doi.org/10.3390/genes8100272.
Denys C, Kadjo B, Missoup AD, Monadjem A and Aniskine V. (2013). New records of bats (Mammalia: Chiroptera) and karyotypes from Guinean Mount Nimba (West Africa). Italian Journal of Zoology, 80(2): 279–290. https://doi.org/10.1080/11250003.2013.775367.
Drexler JF, Corman VM, Muller MA, Maganga GD, Vallo P, Binger T. et al. (2012). Bats host major mammalian paramyxoviruses. Nature Communications, 3, 796. https://doi.org/10.1038/ncomms1796.
Dulic B. & Mutere FA. (1975). Les chromosome de tro’s especes, des, megachropteres (mamm ba, chiroptera) d’Afrique orientale. Caryologia, 26, 389–396.
Eick GN, Jacobs DS, Yang F and Volleth M. (2007). Karyotypic differences on sibling species of Scotophilus from South Africa (Vespertilionidae, Chiroptera, Mammalia). Cytogenetic and Genome Research, 118(1), 72–77. https://doi.org/10.1159/000106444.
Ejere VC. & Adegoke JA. (2001). Karyological study of banded gecko, Hemidactylus fasciatus fasciatus Gray (Gekkonidae, Reptilia). Cytologia, 66, 133–137. https://doi.org/10.1508/CYTOLOGIA.66.133.
Fahr J. (2013). Rhinolophus maclaudi Maclaud’s horseshoe bat in mammals of Africa. In: Happold M & Happold DCD (Editors). Mammals of Africa, Volume IV: Hedgehogs, Shrews and Bats. Bloomsbury, London, England.
Fenton MB, Grinnell AD, Popper AN and Fay RR. (2016). Bat Bioacoustics. Springer, New York.
Foley NM, Goodman SM, Whelan CV, Peuchmaille SJ and Teeling T. (2017). Towards navigating the minotaur’s labyrinth: cryptic diversity and taxonomic revision within the speciose genus Hipposideros (Hipposideridae). Acta Chiropterologica, 19, 1–18. https://doi.org/10.3161/15081109ACC2017.19.1.001.
Geospatial Analysis Mapping and Environmental Research Solution (GAMERS). 2018. Map of Enugu State, Nigeria. Available at: https://www.gamers.com.ng/map-of-enugu-state-nigeria/. Accessed on 22nd August 2019.
Haiduk MW, Baker RJ, Robbins L and Shlitter DA. (1981). Chromosomal evolution in African Megachiraptera: G-and C-band assessment of the magnitude of change in similar standard karyotypes. Cytogenetics & Cell Genetics, 29(4), 221–232. https://doi.org/10.1159/000131573
Happold M. & Happold DCD. (2013). Mammals of Africa. Volume IV: Hedgehogs, Shrews and Bats. Bloomsbury Publishing, London, United Kingdom. 800 pp.
Hsu TC. & Arrighi FE. (1971). Distribution of constitutive heterochromatin in mammalian chromosomes. Chromosoma, 34(3), 243–253. https://doi.org/10.1007/BF00286150.
Kartavtseva IV. (2002). Karyosystematics of Wood and Field Mice (Rodentia: Muridae). Dal’nauka Press, Vladivostok. 144 pp.
Kearney TC, Volleth M, Contrafatto G and Taylor PG. (2002). Systematic implications of chromosome GTG-band and bacula morphology for southern African Eptesicus and Pipistrellus and several other species of Vespertilioninae (Chiroptera: Vespertilionidae). Acta Chiropterologica, 4(1), 55–76. https://doi.org/10.3161/001.004.0107.
Koubinová D, Sreepoda K, Koubek P and Zima J. (2010). Karyotypic variation in rhinolophid and hopposiderid bats (Chiroptera; Rhirolophidae, Hipposideridae). Acta Chiropterologica, 12, 393–400. https://doi.org/10.3161/150811010X537972.
Kruskop SV. (2006). Towards the taxonomy of the Russian Murina. Russian Journal of Theriology, 4(2), 135–140. https://doi.org/10.15298/rusjtheriol.04.2.01.
Kruskop SV. (2012). Order Chiroptera. In: Pavlinov, I.Y. & Lissovsky, A.A. (Editors). The Mammals of Russia: A Taxonomic and Geographic Reference. KMK Scientific Press, Moscow. 604 pp. https://doi.org/10.5772/intechopen.78767.
Kruskop SV, Borisenko AV, Ivanova NV, Lim BK and Eger JL. (2012). Genetic diversity of northeastern Palaearctic bats as revealed by DNA barcodes. Acta Chiropterologica, 14(1), 1–14. https://doi.org/10.3161/150811012X654222.
Matthey, R. 1973. The chromosome formulae of eutherian mammals. In Cytotaxonomy and Vertebrate Evolution, ed. A. B. Chiarelli and E. Capanna, 531–616. Academic Press: London/New York.
McCracken GF, Westbrook JK, Brown VA, Eldridge M, Federico P and Kunz TH. (2012). Bats track and exploit changes in insect pest populations. PLoS ONE, 7(8), e43839. https://doi.org/10.1371/journal.pone.0043839.
Peterson RL. & Nagorsen DW. (1975). Chromosome of fifteen species of bats (Chiroptera) form kerygad Rhodesia. Life Science Occasional Paper Royals Ontario Museum, 27, 1–14.
Porter CA, Primus AW., Hoffmann FG and Baker RJ (2010). Karyology of five species of bats (Vespertiliondae Hipposideridae, and Nycteridae) from Gabon with comments on the taxonomy of Glauconycteris museum of Texas Tech. University Occasion paper, 295. https://doi.org/10.5962/bhl.title.156992.
Primes A, Harvey J, Guimondou S, Mboumba S, Ngangui R, Hoffmann F, Baker R and Porter CA. (2006). Karyology and chromosome evolution of some small mammals inhabiting the rainforest of the Rabi oil field, Gabon. Bulletin of the Biological Society of Washington, 12, 372–382.
Puig-Montserrat X, Torre I, L´opez-Baucells A, Guerrieri E and Monti MM. (2015). Pest control service provided by bats in Mediterranean rice paddies: linking agroecosystems structure to ecological functions. Mammalian Biology, 80(3), 237–245. https://doi.org/10.1016/j.mambio.2015.03.008.
Rautenbach IL, Bronner GN, Schlitter DA. (1993). Karyotypic data and attendant systematic implications for the bats of Southern Africa. Koedoe, 36, 87–104. https://doi.org/10.4102/koedoe.v36i2.377.
Riccucci M. & Lanza B. (2014). Bats and insect pest control: a review. Vespertilio, 17, 161–169.
Rickart EA, Mercier JA, Henny LR. (1999). Cytogeography of Philippine bats (Mammalia; Chiroptera). Proceedings of the Biological Society of Washington, 112, 453–469. https://doi.org/10.5281/zenodo.13442161.
Ruedas LA, Lee TE, Bickman J and Schlitter DA. (1990). Chromosomes of five species of vespertilionid bats from Africa. Journal of Mammalogy, 71(1), 94. https://doi.org/10.2307/1381324.
Ruedi M, Csorba G, Lin LK and Chou CH. (2015). Molecular phylogeny and morphological revision of Myotis bats (Chiroptera: Vespertilionidae) from Taiwan and adjacent China. Zootaxa, 3920(1), 301–342. https://doi.org/10.11646/zootaxa.3920.2.6.
Schlitter DA, Rautenbach IL, Wohlhuter DA. (1980). Karyotpyes and morphometrics of two species of Scotophilus in South Africa (Mammalia: Vespertilionidae). Annals of the Transvaal Museum, 32, 231–239. https://doi.org/10.2307/1381324.
Simmons NB (2005). Order Chiroptera. In: Wilson, D. & Reeder, D.M. (Editors). Mammal Species of the World: A Taxonomic and Geographic Reference. Smithsonian Institution Press, Washington DC.
Simmons NB. & Conway TM. (2003). Evolution of ecological diversity in bats. In: Kunz, T.H. & Fenton, M.B. (Editors). Bat Ecology. University of Chicago Press, Chicago, Illinois. Pp. 493–535.
Sotero CG, Baker RJ, Volleth M. (2017). Chromosomal evolution in Chiroptera. Genes, 8(10), 272. https://doi.org/10.3390/gene8100272.
Sreepada K, Koubinová D, Konecny A, Koubek P, Rab P, Rábová M and Zima J. (2008). Karyotypes of three species of molossid bats (Molossidae, Chiroptera) from India and West Africa. Folia Zoologica, 57, 347–357. https://www.ivb.cz/wp-content/uploads/57_347-357.pdf. ISSN 0139-7893.
Stevens RD. & Willig MR. (2002). Geographical ecology at the community level: perspectives on the diversity of New World bats. Ecology, 83, 545–560. https://doi.org/10.1890/0012-9658(2002)083[0545:GEATCL]2..0.CO;2.
Strelkov PP. (2006). The crisis of the polytypic species concept is illustrated by the genus Plecotus. Plecotus, 9, 3–7.
Teeling EC, Dool S, Springer MS. (2012). Phylogenies, fossils and functional genes: the evolution of echolocation in bats. In: Gunnell, G. and Simmons, N. (Editors). Evolutionary History of Bats: Fossils, Molecules and Morphology. Cambridge University Press, Cambridge. Pp. 1–22. https://doi.org/10.1016/.tree.2006.01.001.
Tiunov MP (2011). Distribution of the bats in the Russian Far East. Proceedings of the Japan-Russia Cooperation Symposium on the Conservation of the Ecosystem. Okhotsk, Sapporo, pp. 359–369. https://doi.org/10.5772/intechopen.78767.
Volleth M. & Heller KG (2012). Variations on a theme: karyotype comparison in Eurasian myotis species and implications for phylogeny. Vespertilio, 16, 329–350.
Volleth M, Heller KG, Fahr J. (2006). Phylogenetic relationships of three “Nycticeiini” genera (Vespertilionidae, Chiroptera, Mammalia) as revealed by karyological analysis. Mammalian Biology, 71(1), 1–12. https://doi.org/10.1016/j.mambio.2005.09.001.
Volleth M, Heller KG, Pfeiffer RA and Hameister HA (2002). A comparison of zoo fish analysis in bats elucidates the phylogenetic relationships between Megachiroptera and five microchiroptera formulas. Chromosome Research, 10, 477–497. https://doi.org/10.1023/a:1020992330679.
Volleth M, Son NT, Wu Y, Li Y, Yu W. et al. (2017). Comparative chromosomal studies in Rhinolophus formosae and R. luctus from China and Vietnam: elevation of R. l. lanosus to species rank. Acta Chiropterologica, 19(1), 41–50. https://doi.org/10.3161/15081109ACC2017.19.1.003.
Wang LF, Walker PJ, Poon LL. (2011). Mass extinctions, biodiversity, and mitochondrial function: are bats “special” as reservoirs for emerging viruses? Current Opinion in Virology, 1(6), 649–657. https://doi.org/10.1016/j.coviro.2011.10.013.
Wilson DE. & Reeder DM. (2005). Mammal Species of the World: A Taxonomic and Geographic Reference. 3rd Edition. Johns Hopkins University Press, Baltimore. https://doi.org/10.1644/06-MAMM-R-422.1.
Supplementary materials
Material 10. Giemsa Stain Preparation.
0.5g of Giemsa powder was dissolved in 33ml glycerol and kept in an Erlmyer bottle in a dark compartment overnight. The next day, it was heated in a water bath set at 60°C for 2 hours and allowed to cool, after which 33 ml of methanol was added and thoroughly mixed. This solution was then stored in an amber-coloured bottle as the stock Giemsa stain. 6% of the stock Giemsa stain was diluted as described below:
3 ml of the Giemsa stain, was diluted to 50 ml in Phosphate buffer, P.H. 6.8. The phosphate buffer was prepared fresh each time before usage by mixing 25 ml each of 9.464g of M/15 Na2HPO4 and 9.073g of M/15 KH2PO4, simultaneously.
| Nomenclature | Notation | R1 S/L | R2 L/S | I1 100s/c | I2 100L/C |
|---|---|---|---|---|---|
| Median | M | 1.00 | 1.00 | 50.00 | 50.00 |
| Nearly median | Nm | 0.99–0.61 | 1.01–1.63 | 49.99–38.01 | 50.01–61.99 |
| Nearly submedian | nsm(-) | 0.60–0.34 | 1.64–2.99 | 38.00–25.00 | 62.00–74.99 |
| Sub-median | SM | 0.33 | 3.00 | 25.00 | 75.00 |
| Nearly submedian | nsm(+) | 0.32–0.23 | 3.01–4.26 | 24.95–18.20 | 75.01–81.80 |
| Nearly subterminal | nst(-) | 0.22–0.15 | 4.27–6.99 | 18.10–12.51 | 81.81–87.49 |
| Subterminal | ST. | 0.14 | 7.00 | 12.50 | 87.50 |
| Nearly subterminal | nst(+) | 0.13–0.07 | 7.01–14.38 | 12.49–5.01 | 87.51–94.99 |
| Nearly terminal | nt | 0.06–0.01 | 14.39–19.99 | 5.00–0.01 | 95.00–99.99 |
| Terminal | T | 0.00 | 0.00 | 0.00 | 100.00 |