https://doi.org/10.36253/caryologia-3633
Received: July 6, 2025; Accepted: September 30, 2025; Published: December 20, 2025
Chromosome, ploidy analysis, and flow cytometric genome size of caper (Capparis spinosa) medicinal plant
Department of Plant Genetics and Breeding, College of Agriculture, Tarbiat Modares University, Tehran P. O. Box 14115-336, Iran
*Corresponding author. Email: karimzadeh_g@modares.ac.ir
Abstract. Caper (Capparis spinosa) is a shrubby, deciduous perennial medicinal plant belonging to the Capparaceae family. Its use is in folk medicine, pharmacy, food, and spices. Chromosome, ploidy analysis, and flow cytometric genome size of 10 populations collected from different parts of Iran were analyzed. The results showed that all populations were diploid, with nine populations having 2n = 2x = 30 (P1-P8, P10) and one population having 2n = 2x = 34 (P9) chromosomes. The average chromosome length (CL) for these two chromosome groups was 1.05 and 0.97 μm, respectively. The mean monoploid genome sizes for the populations with 30 and 34 chromosomes were 0.646 and 0.633 pg, respectively. As a whole, the mean genome size of all populations was 0.643 pg. The chromosome number as well as the genome size are being reported for the first time. Cluster analysis and principal component analysis revealed a categorization of the caper population into four distinct groups. The first group comprised three populations (P1, P3, and P4), while the second group included only P2 population, the third group was represented by two populations (P5 and P7), and the fourth group encompassed four populations (P6, P8, P9, and P10). Future research on the genetic traits and breeding methodologies of this species can build upon the foundational findings of this study.
Keywords: caper, Capparis spinosa, chromosome, karyology, 2Cx DNA, genome size, flow cytometry.
Contents
Flow cytometric genome size estimation
Nuclear genome size estimation
Multivariate statistical analysis
Introduction
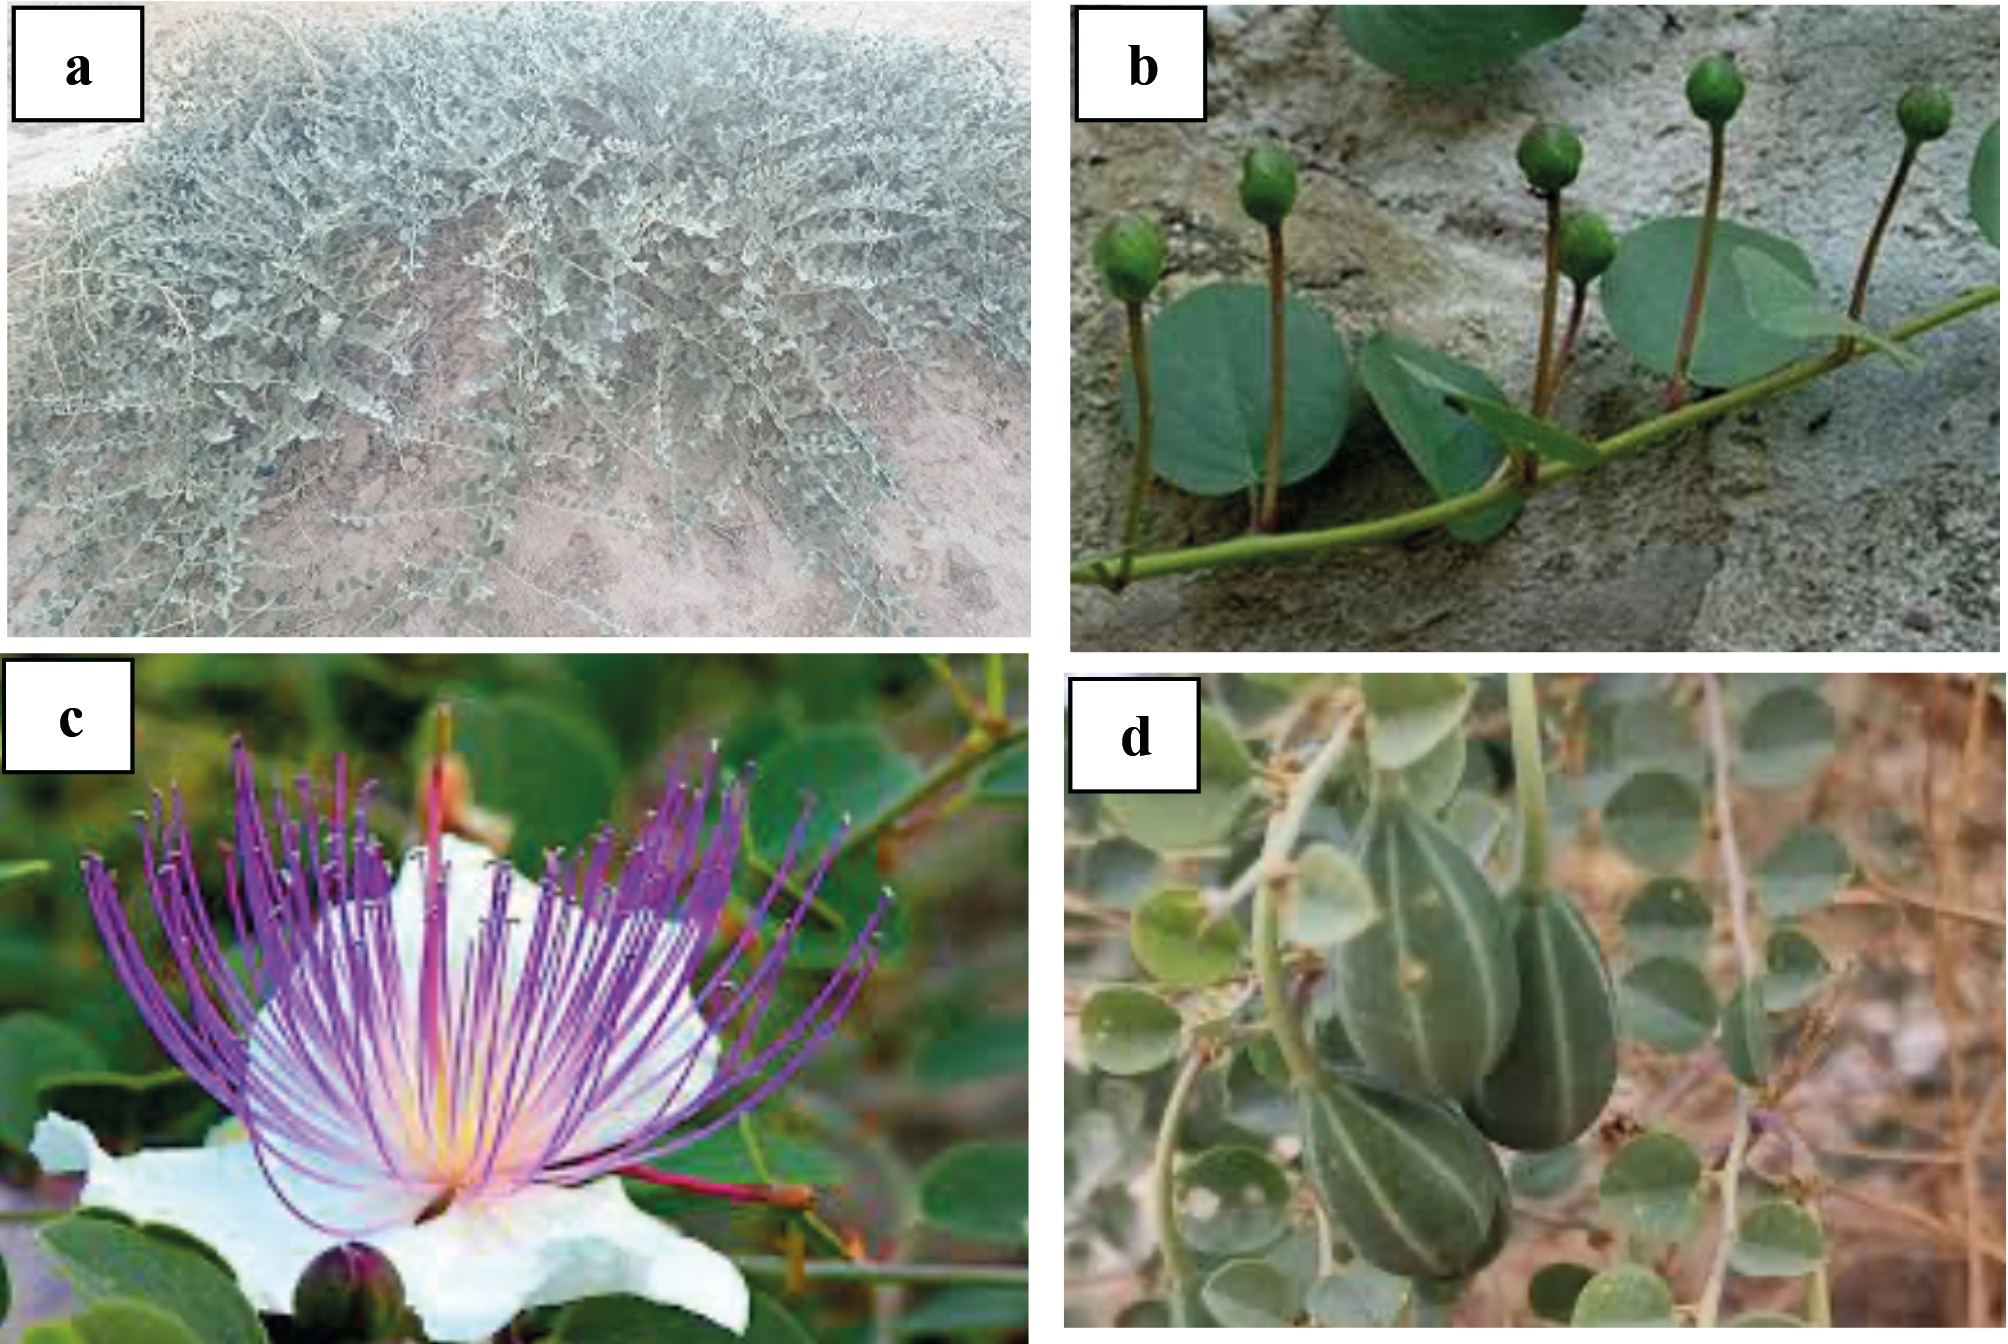
People of every culture have always experimented with endemic plants over thousands of years and have recognized that almost all of nature is used for food, clothing, shelter, and they have adapted based on the available resources. Plants that have beneficial pharmacological effects on the human body are called medicinal plants and are useful almost exclusively due to their natural ability to synthesize secondary metabolites (Sundarrajan and Bhagtaney, 2023). The presence of various secondary metabolites such as flavonoids, alkaloids, saponins, tannins, terpenoids, and phenolic compounds in medicinal plants has anti-inflammatory, antimicrobial, and antioxidant effects, confirming that the use of medicinal plants is a suitable alternative to current conventional methods in the treatment of many problems such as wounds (Cedillo-Cortezano et al., 2024). Caper (Capparis spinosa L.) is a common member of the Capparis genus of the Capparaceae (Capparidaceae) family, which is a thorny perennial shrub and an aromatic plant common in many parts of the world, especially the Mediterranean regions (Shahrajabian et al., 2021). This shrubby plant has woody stems and herbaceous branches with thick, shiny, bright green, oval-shaped, and alternate simple leaves. It has single, fragrant flowers with white to pinkish-white petals, and numerous long purple stamens. The fruit shape is oval-shaped and it has a dark green color (Condurso et al., 2015; Chedraoui et al., 2017) (Figure 1).
Although this plant is native to the Mediterranean, it grows well in Italy, North Africa, Greece, Central Asia, and Iran (Zarei et al., 2021). Caper prefers a rainy spring and a hot, dry summer with intense sunlight, with temperatures exceeding 40 °C and an average annual rainfall of 350 mm (Barbera and Di Lorenzo, 1984). This plant grows both wild and cultivated, and prefers rocky soils in semi-arid regions, limestone slopes, and crevices in old walls. Additionally, caper is tolerant to both salt and drought stresses. Due to its ability to grow in harsh environments, this plant is recommended to prevent land degradation, control soil erosion, and maintain and promote agriculture in areas exposed to severe climate change (Sakcali et al., 2008). C. spinosa is one of the most common aromatic plants in Mediterranean cuisine. The flower buds of this plant are edible. The flowers, which are harvested in the spring before they open, are usually processed in brine, pickled in vinegar, or preserved in grain salt and used as a seasoning in salads, pasta, meat, sauces, and condiments to add a spicy and salty flavor and aroma to food (Cincotta et al., 2022). The fruit, leaves, and the younger branches of the caper plant are edible and consumed salted or pickled in vinegar, or as fresh or cooked vegetables (Moghaddasi, 2011). Different parts of this plant, including the roots, bark, leaves, buds, and fruits, have traditionally been employed to alleviate conditions such as joint diseases, hemorrhoids, rheumatism, rheumatoid arthritis, gout, fever, cough, asthma, and inflammation (Chedraoui et al., 2017). Furthermore, caper extract exhibits significant properties including antihypertensive, hepatoprotective, antidiabetic, anti-obesity, bronchodilator, antiallergic and antihistamine, antibacterial, antioxidant, and anticancer effects (Nabavi et al., 2016; Chedraoui et al., 2017; Merlino et al., 2024). Caper seeds are rich in antioxidant molecules and a source of omega-6, utilized in both the food and pharmaceutical industries (Ara et al., 2013; Tlili et al., 2015). On the other hand, C. spinosa contains bioactive lipids, glucosinolates (glucocaprin), and flavonoids (rutin); its seed oil is also rich in unsaturated lipids (Argentieri et al., 2012; Annaz et al., 2022). The most important phytochemical compounds identified, includes quercetin derivatives, kaempferol, isorhamnetin myristicin, eriodictyol, circimaritin, and gallocatechin (Bakr and El Bishbishy 2016). Moreover, it has the alkaloids caparicin A, caparicin B, and caparicin C, which are used in medical treatments (Marir, 2024).
Karyotype, as an important genetic feature, represents the phenotypic appearance of somatic chromosomes, including chromosome number and length (Ning et al., 2018; Vimala et al., 2021; Abbasi-Karin et al., 2022; Rasekh et al., 2023; Yari et al., 2024; Morovati et al., 2024), is used in systematic and evolutionary studies of plants (Peruzzi et al., 2017; Wang et al., 2020; Yari et al., 2024). The simplest technical feature related to the genome of a species is the chromosome number, which is the most fundamental feature. For this reason, since 1882 (Garbari et al., 2012), chromosome number data have been collected for many plant organisms worldwide, representing about one-third of the plant currently known in this respect (Stace, 2000). The Capparaceae family consists of about 40-45 genera and 700-900 species, whose members show significant diversity in terms of appearance, fruit, and floral features (Kamel et al., 2015). The most important genera of this family include Capparis, Cadaba, Boscia, and Maerua (Ali and Amar, 2020). The genus Capparis has about 250 species, the chromosome numbers for the few known species of this genus are (2n = 18, 30, 38, 40, and 84) (Rock, 2016). Cadaba indica and Cadaba triphylla, which are both species in the genus Cadaba, have chromosome numbers that are both 14 and 34, respectively reported by Subramanian and Pondmudi (1987). The species Crataeva nurvala belongs to the genus Crataeva has 26 chromosomes (Gupta and Gill, 1981). Another species of this genus, Crataeva religiosa, also has 26 chromosomes (Subramanian and Pondmudi, 1987). The species Maerua arenaria sensu Baillon (Subramanian and Pondmudi, 1987), (Khatoon and Ali, 1993) M. arenaria (DC.) Hook. f. & Thoms. and M. crassifolia Forssk. (Khatoon and Ali, 1993), belonging to the genus Maerua each have 40, 20, and 20 chromosome numbers, respectively. The species Niebuhria linearis DC. of the genus Niebuhria has 102 chromosomes (Sharma, 1968). Capparis, the largest genus in the Capparaceae family, has 250 species with various chromosome numbers, including C. brevispina DC. (2n = 36) (Subramanian and Pondmudi, 1987), C. decidua Pax (2n = 40) (Khatoon and Ali, 1993), (Subramanian and Pondmudi, 1987) C. divaricata (2n = 160), C. diversifolia Wight & Arn. (2n = 98) (Subramanian and Pondmudi, 1987), (Subramanian and Pondmudi, 1987) C. grandis L. f. (2n = 42), C. leucophylla DC. (2n = 10, 20) (Sandhu, 1989), C. rotundifolia (2n = 42) (Subramanian and Pondmudi, 1987), C. sandwichiana var. Zoharyi, O. Deg. & I. Deg. (2n = 40) (Carr, 1978), C. sepiaria (2n = 40) (Sharma, 1968; Subramanian and Pondmudi, 1987), C. zeylanica (2n = 40, 44) (Singhal and Gill, 1984; Subramanian and Pondmudi, 1987), C. spinosa (2n = 24, 38) (Magulaev, 1979; Al-Turki et al., 2000), C. spinosa subsp. Rupestris (2n = 38) (Runemark 1996), and C. spinosa var. herbacea (Willd.) (2n = 42) (Wang et al., 2022). Given the valuable medicinal and nutritional value of caper, this study aimed to investigate intraspecific diversity among Iranian populations in terms of karyotypic characteristics and genome size.
Genome size refers to the amount of genomic DNA present in the gametes of a species, which is generally constant in an organism and is represented as a C-value (Swift, 1950; Greilhuber et al., 2005; Pellicer et al., 2018; Kocjan et al., 2022). The C-value estimation is essential for sequencing and genomic analysis, as well as for plant species identification and classification (Gregory, 2005; Bourge et al., 2018; Sliwinska, 2018). Genome sizes vary considerably among the flowering plants overall, as well as within smaller taxonomic groups such as families or even genera. Monoploid genome size is refers to the amount of DNA of one chromosome set, 1 Cx-value, with chromosome base number x) and holoploid genome size to the amount of DNA of the whole chromosome complement, 1 C-value, with chromosome number n, regardless of the degree of polyploidy, aneuploidies, etc.) as described by Greilhuber et al. (2005). Flow cytometry (FCM) has been used to estimate the plant nuclear DNA content since the 1980s. It is commonly used in plant breeding (especially in polyploid and hybrid breeding) (e.g. Doležel and Bartoš, 2005; Doležel et al., 2007; Tavan et al., 2015; Bourge et al., 2018; Javadian et al., 2018; Hamidi et al., 2018; Tarkesh Esfahani et al., 2020) and seed production (Sliwinska, 2018). Recently, studies of karyomorphology and genome size, using flow cytometry technique have been conducted in a diverse array of plant communities, such as: Thymus species (Mahdavi and Karimzadeh, 2010; Tavan et al., 2015), Satureja (Shariat et al., 2013; Zare Teymoori et al., 2021), Tulipa (Abedi et al., 2015, Papaver bracteatum (Tarkesh Esfahani et al., 2016), Artemisia khorassanica (Hamidi et al., 2018), Medicago monantha (Zarabizadeh et al., 2022), Epilobium spp. (Abbasi-Karin et al., 2022), Ferula assa-foetida (Firoozi et al., 2022), berry (Mohammadpour et al., 2022), Allium spp. (Sayadi et al., 2022), Papaver somniferum (Rasekh and Karimzadeh, 2023), Cymbopogon olivieri (Yari et al., 2024), Coriandrum sativum (Khakshour et al., 2024), Sapindus mukorossi (Gao et al., 2024), Cyphomandra clade (Mesquita et al., 2024), Nigella and Garidella species (Aydın et al., 2024), and Datura spp. (Morovati et al., 2024) have been used to identify intra- and inter-specific diversity.
Materials and methods
Plant materials
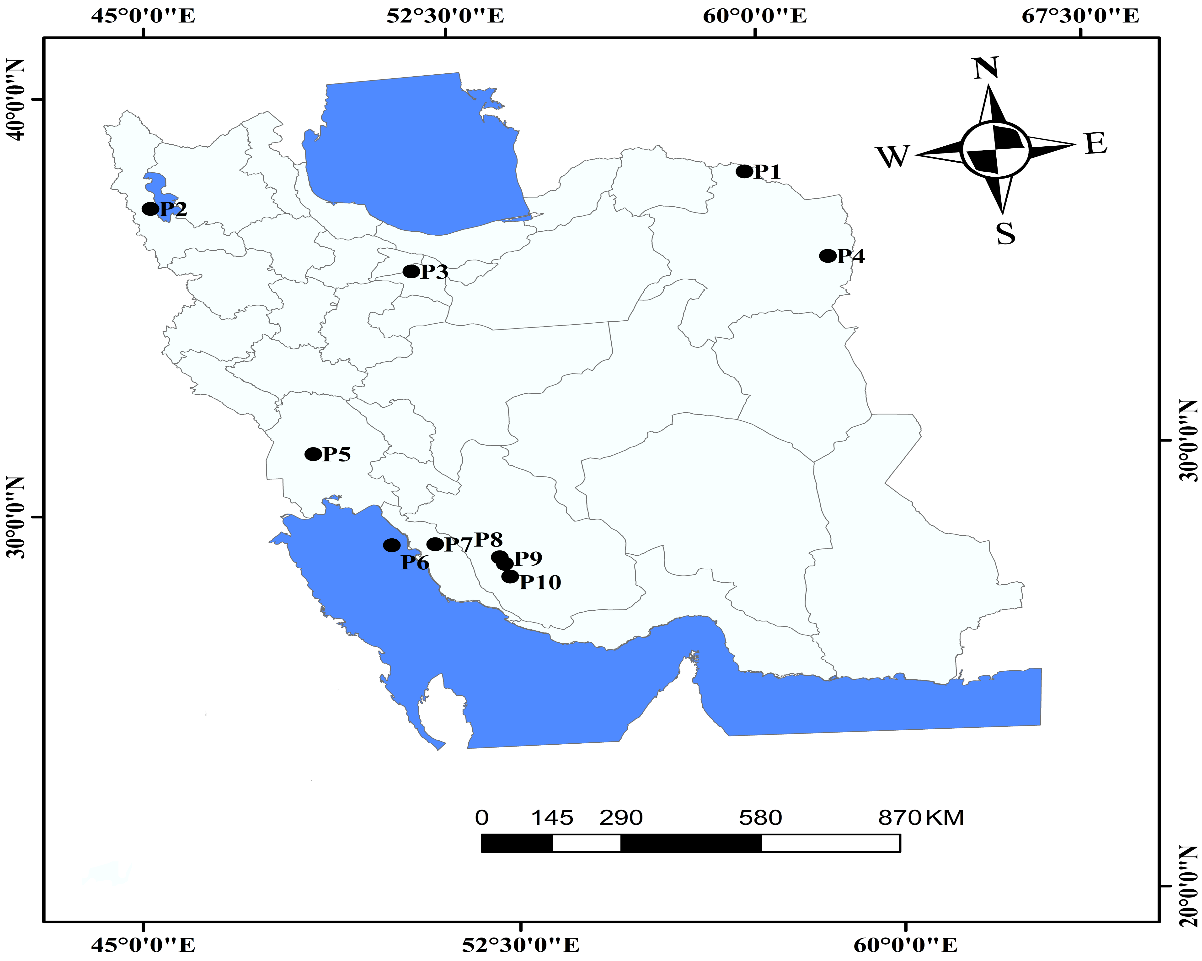
Seeds from 10 endemic Iranian caper (Capparis spinosa L.) populations were collected from various regions of Iran during the growing season within their natural habitats. Population codes, geographical coordinates (latitude, longitude), altitude (m), mean annual temperature (°C), and mean annual rainfall (mm) are presented in Table 1 and illustrated in Figure 2.
| Populations codes |
Local collection locations | Latitude (N) |
Longitude (E) |
Altitude (m) |
Mean Temp. (˚C) |
Mean rainfall (mm) |
|---|---|---|---|---|---|---|
| P1 | Dargaz, Khorasan-e Razavi | 37°26’33.25” | 59° 6’26.06” | 408 | 12.75 | 266.70 |
| P2 | Balanej, Azarbayjan-e Gharbi | 37°24’6.72” | 45° 9’54.19” | 1303 | 14.20 | 341.00 |
| P3 | Tehran, Tehran | 35°44’38.00” | 51° 9’54.71” | 1286 | 18.68 | 250.98 |
| P4 | Torbat-e-Jam, Khorasan-e Razavi | 35°15’8.38” | 60°35’42.42” | 909 | 26.00 | 254.00 |
| P5 | Ahvaz, Khozestan | 31°28’21.02” | 48°43’21.48” | 17 | 26.65 | 191.20 |
| P6 | Kharg Island, Bushehr | 29°14’16.05” | 50°18’58.48” | 1 | 26.18 | 265.60 |
| P7 | Borazjan, Bushehr | 29°13’12.64” | 51°14’34.86” | 104 | 27.63 | 283.10 |
| P8 | Firuzabad, Fars | 28°50’23.45” | 52°35’30.92” | 1333 | 20.87 | 379.70 |
| P9 | Fathabad-e Deh-e Arab, Fars | 28°40’42.01” | 52°41’18.26” | 1148 | 21.20 | 377.00 |
| P10 | Dasht-e Lar, Fars | 28°22’11.55” | 52°46’38.95” | 924 | 25.70 | 302.20 |
Chromosome analysis
Seeds mucilage was first removed by washing with water. The seed coats were then mechanically scarified to break dormancy (Olmez et al., 2006; Agah et al., 2020; Radmanesh et al., 2023). For this purpose, seeds were disinfected by immersing in 5% (v/v) sodium hypochlorite for 5 min, followed by 70% (v/v) ethanol for 1 min (Aguilar-Rito et al., 2023; Qi et al., 2023). Subsequently, healthy seeds were placed on a layer of Whatman filter paper within 9 cm diameter glass petri dishes (Honarmand et al., 2016). To induce germination, seeds were moistened with distilled water at room temperature (RT). Petri dishes were then placed in a growth room under controlled conditions: 16/8 h light/dark at 25 °C (Honarmand et al., 2016). Approximately, 0.5-mm length roots were incubated in a 0.002 M 8-hydroxyquinoline solution for 3 h in the dark at RT (Mehravi et al., 2022a, b; Anjum et al., 2023). Roots were fixed in Carnoy’s fixative (glacial acetic acid:ethanol, 1:3 v/v) for a minimum of 24 h at 4 °C (Karimzadeh et al., 2011; Firoozi et al., 2022; Khakshour et al., 2024; Yari et al., 2024). Following fixation, Carnoy’s fixative was removed by washing with distilled water for 5 min. Subsequently, root meristems were hydrolyzed in 1 M HCl for 10 min at 60 °C. Root samples were stained with 4% (w/v) hematoxylin solution for 3 h at RT in the dark (Mohammadpour et al., 2022). Slides were prepared, using the squash method in 45% (v/v) acetic acid. Photomicrographs were taken with a DP12 digital camera (Olympus Optical Co., Tokyo, Japan) mounted on a BX50 Olympus microscope (Olympus Optical Co., Tokyo, Japan). In cytological studies of plants with small chromosomes (almost one micrometer), accurately measuring the lengths of the long and short arms are often challenging due to the difficulty in identifying the centromere (Morales Valverde, 1986; Mahdavi and Karimzadeh, 2010; Abbasi-Karin et al., 2022; Rasekh and Karimzadeh, 2023, Yari et al., 2024; Morovati et al., 2024). Hence, in the current study, the chromosome length (CL) was measured, using MicroMeasure software version 3.3.
Flow cytometric genome size estimation
To estimate genome size, seeds were first germinated in petri dishes. After two weeks, the seedlings were transferred to pots containing a mixture of soil, sand, perlite, and cocopeat in the research greenhouse of the College of Agriculture at Tarbiat Modares University, where suitable growth conditions were maintained. During growth, NPK fertilizer was applied after five months when the grown plants having developed leaves suitable for flow cytometric analysis. Then, 1 cm² of young developed leaves from C. spinosa and radish (Raphanus sativus cv. Saxa; 2C DNA = 1.11 pg) as an internal reference standard (Doležel et al., 1992) were chopped simultaneously with a sharp blade in a glass petri dish containing 1 ml of Woody Plant Buffer (WPB; Loureiro et al., 2007). No peaks were identified in the analysis. Hence, instead General Plant Buffer (GPB; 0.5 mM Spermine·4HCl, 30 mM Sodium citrate·3H₂O, 20 mM MOPS, 20 mM NaCl, 80 mM KCl, 1% PVP-10, and 0.5% v/v Triton X-100, pH 7.0) (Loureiro et al., 2007) was used. The resulting nuclear suspension was passed through a 30 μm green nylon filter (Partec, Munster, Germany) to remove large tissue fragments and debris. This was followed by the addition of 50 μg ml⁻¹ of RNase (for RNA removal) (Sigma-Aldrich Corporation, MO, USA) and 50 μg ml⁻¹ of propidium iodide (PI, Fluka) fluorescent dye (for nuclear DNA staining) to the samples (Loureiro et al., 2007). The nuclear suspension was then analyzed using a BD FACSCanto™ flow cytometer (Biosciences, Bedford, MA, USA) with BD FACSDiva™ software. The output data were transferred to FloMax ver. 2.4.1 software for gating the output histograms. Relative fluorescence intensity measurements of stained nuclei were performed on a linear scale, with at least 5,000 nuclei analyzed for each sample. The absolute DNA content of a sample was calculated based on the average G1 peak values. The following formula was used to determine the genomic DNA content (in pg) of an unreplicated gamete (2Cx DNA) based on the mean G1 peak values in caper (Doležel et al., 2007; Loureiro et al., 2007; Firoozi et al., 2022; Sayadi et al., 2022; Mehravi et al., 2022a; Mohammadpour et al., 2022).
Sample 2Cx DNA (pg) = (Sample G1 peak mean/Standard G1 peak mean) × Standard 2C DNA (pg)
Moreover, the size of the monoploid genome (2Cx DNA) in base pair terms is based on the converting formula proposed by Doležel et al. (2003), where 1 pg of DNA is equivalent to 978 Mbp.
Statistical analyses
The normality test was first applied to the residuals data of chromosome length (CL) and genome size data, the data were then analyzed according to a completely randomized design (CRD) with five and three replications, respectively, using Minitab 17 software (Cardoso et al., 2023). Chromosome length data were not normalized; instead, they were transformed in the reverse way (Osborne, 2010), resulting in normalized data. Analysis of variance (ANOVA) and subsequent comparison of means, using the least significant difference (LSD) method (Hinkelmann, 2012) were performed with the general linear model (GLM) procedure in SAS 9.1 software (SAS Institute Inc., 2009). Furthermore, multivariate statistical analysis (MANOVA) of mean CL, genome size, and geographical parameters (Karimzadeh et al., 2011) was conducted in Minitab 17 software (Yeshitila et al., 2023).
Results
Karyotype analysis
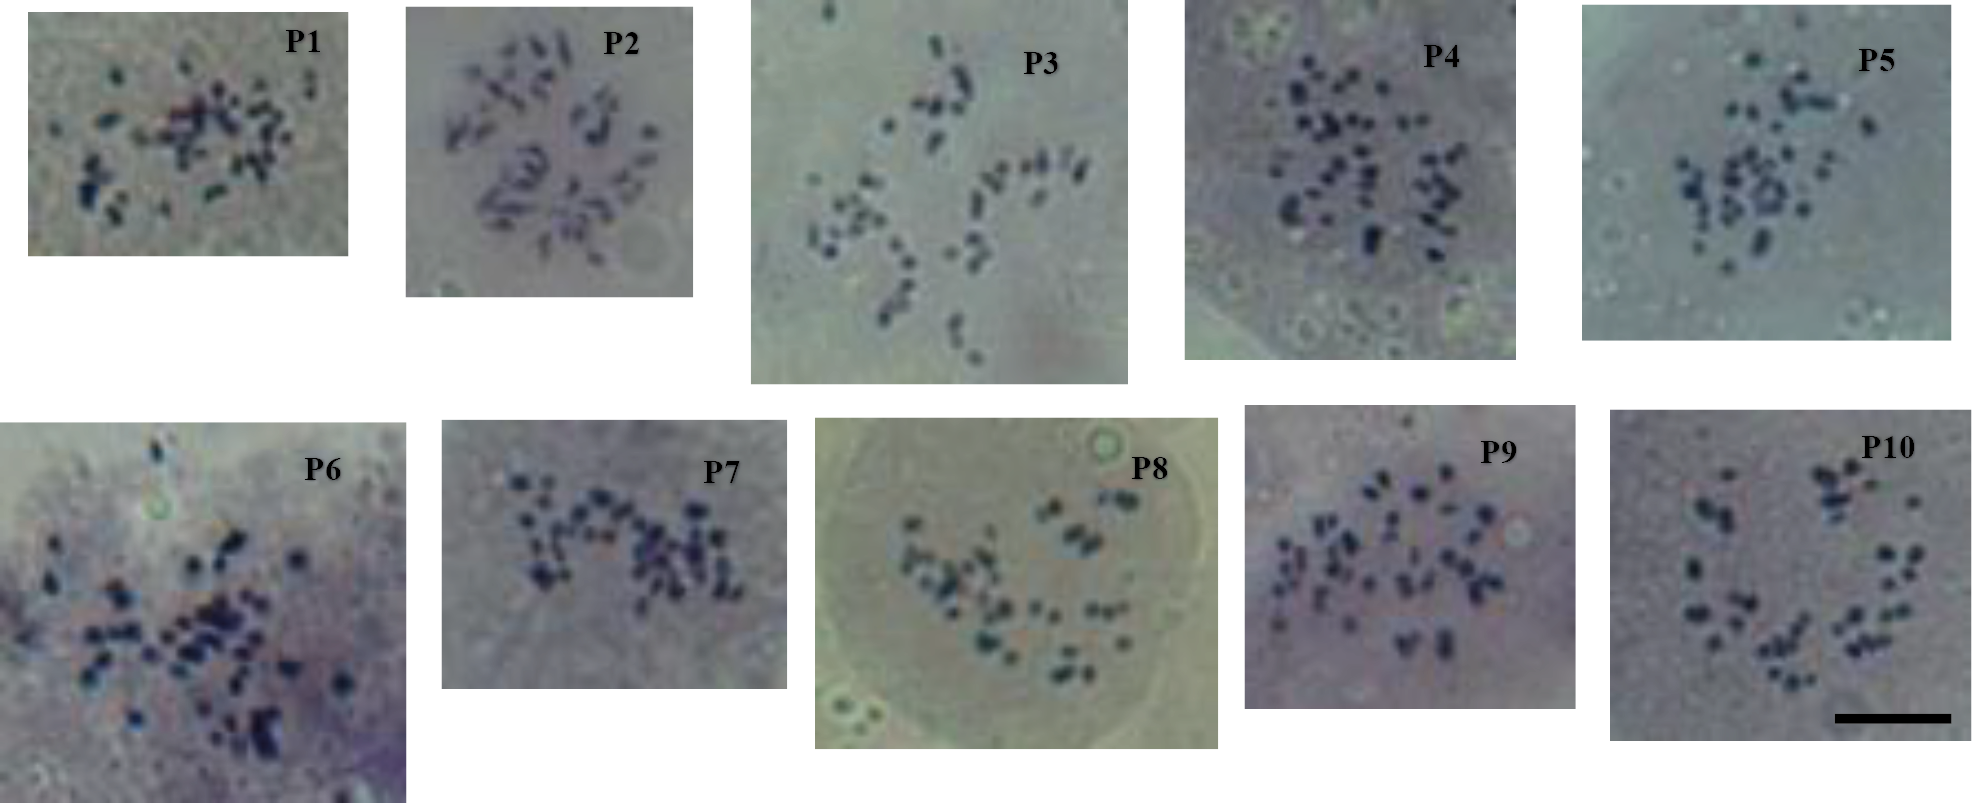
The karyotypic study results indicated that all 10 populations of the caper (Capparis spinosa) medicinal plant were diploid (2x) in terms of ploidy level. The results of ANOVA indicate a significant difference (P < 0.01) in chromosome length (CL) among the studied populations, reflecting intraspecific diversity (Table 2). Interestingly, within such a ploidy level, two chromosome numbers were identified. Hence, nine populations had 2n = 2x = 30 chromosomes, while one population (P9) had 2n = 2x = 34 chromosomes (Fig. 3, Table 3). This study is being reported for the first time in Iran. The mean chromosome length (CL) in the nine populations (P1-P8, P10) with 30 chromosomes was 1.05 μm, ranging from 0.97 μm (P9) to 1.12 μm (P2). The P9 population, which had 34 chromosomes, also measured 0.97 μm, while the mean CL for all 10 populations was 1.05 μm.
| SOV | df | MS CL |
df | MS 2Cx DNA |
|||||||||||||||
|---|---|---|---|---|---|---|---|---|---|---|---|---|---|---|---|---|---|---|---|
| Population | 9 | 0.2819** | 9 | 0.0015ns | |||||||||||||||
| Error | 750 | 0.562 | 20 | 0.0009 | |||||||||||||||
| CV% | – | 23.4 | – | 4.71 | |||||||||||||||
| ns, ** Non-significant at P < 0.05, significant difference at P < 0.01. | |||||||||||||||||||
| Pop. | Local collection locations | 2n | CL (μm ± Se) | Monoploid 2Cx DNA (pg) |
Monoploid 2Cx DNA) (Mbp) |
|---|---|---|---|---|---|
| P1 | Dargaz | 30 | 1.106 ± 0.033ab | 0.659 ± 0.005abc | 644.50 |
| P2 | Balanej | 30 | 1.122 ± 0.029a | 0.677 ± 0.002a | 662.10 |
| P3 | Tehran | 30 | 1.073 ± 0.027abc | 0.639 ± 0.028abc | 624.94 |
| P4 | Torbat-e-Jam | 30 | 1.117 ± 0.032a | 0.652 ± 0.018abc | 637.66 |
| P5 | Ahvaz | 30 | 0.988 ± 0.030c | 0.660 ± 0.008abc | 645.48 |
| P6 | Kharg | 30 | 1.009 ± 0.030bc | 0.620 ± 0.022bc | 606.36 |
| P7 | Borazjan | 30 | 1.067 ± 0.028abc | 0.668 ± 0.015ab | 653.30 |
| P8 | Firuzabad | 30 | 1.037 ± 0.029abc | 0.627 ± 0.009abc | 613.20 |
| P9 | Fathabad-e Deh-e Arab | 34 | 0.974 ± 0.025c | 0.633 ± 0.029abc | 619.08 |
| P10 | Dasht-e Lar | 30 | 0.975 ± 0.030c | 0.608 ± 0.015c | 594.62 |
| Means | Total P1-P8, P10 P9 |
– | 1.047 1.055 0.974 |
0.643 0.646 0.633 |
628.86 631.78 619.08 |
| LSD | – | – | LSD1% = 0.108 | LSD5% = 0.052 | – |
Means with the same symbol letters are not significantly different at either (P < 0.01) for CL column or (P < 0.05) for 2Cx DNA column, using LSD.
Nuclear genome size estimation
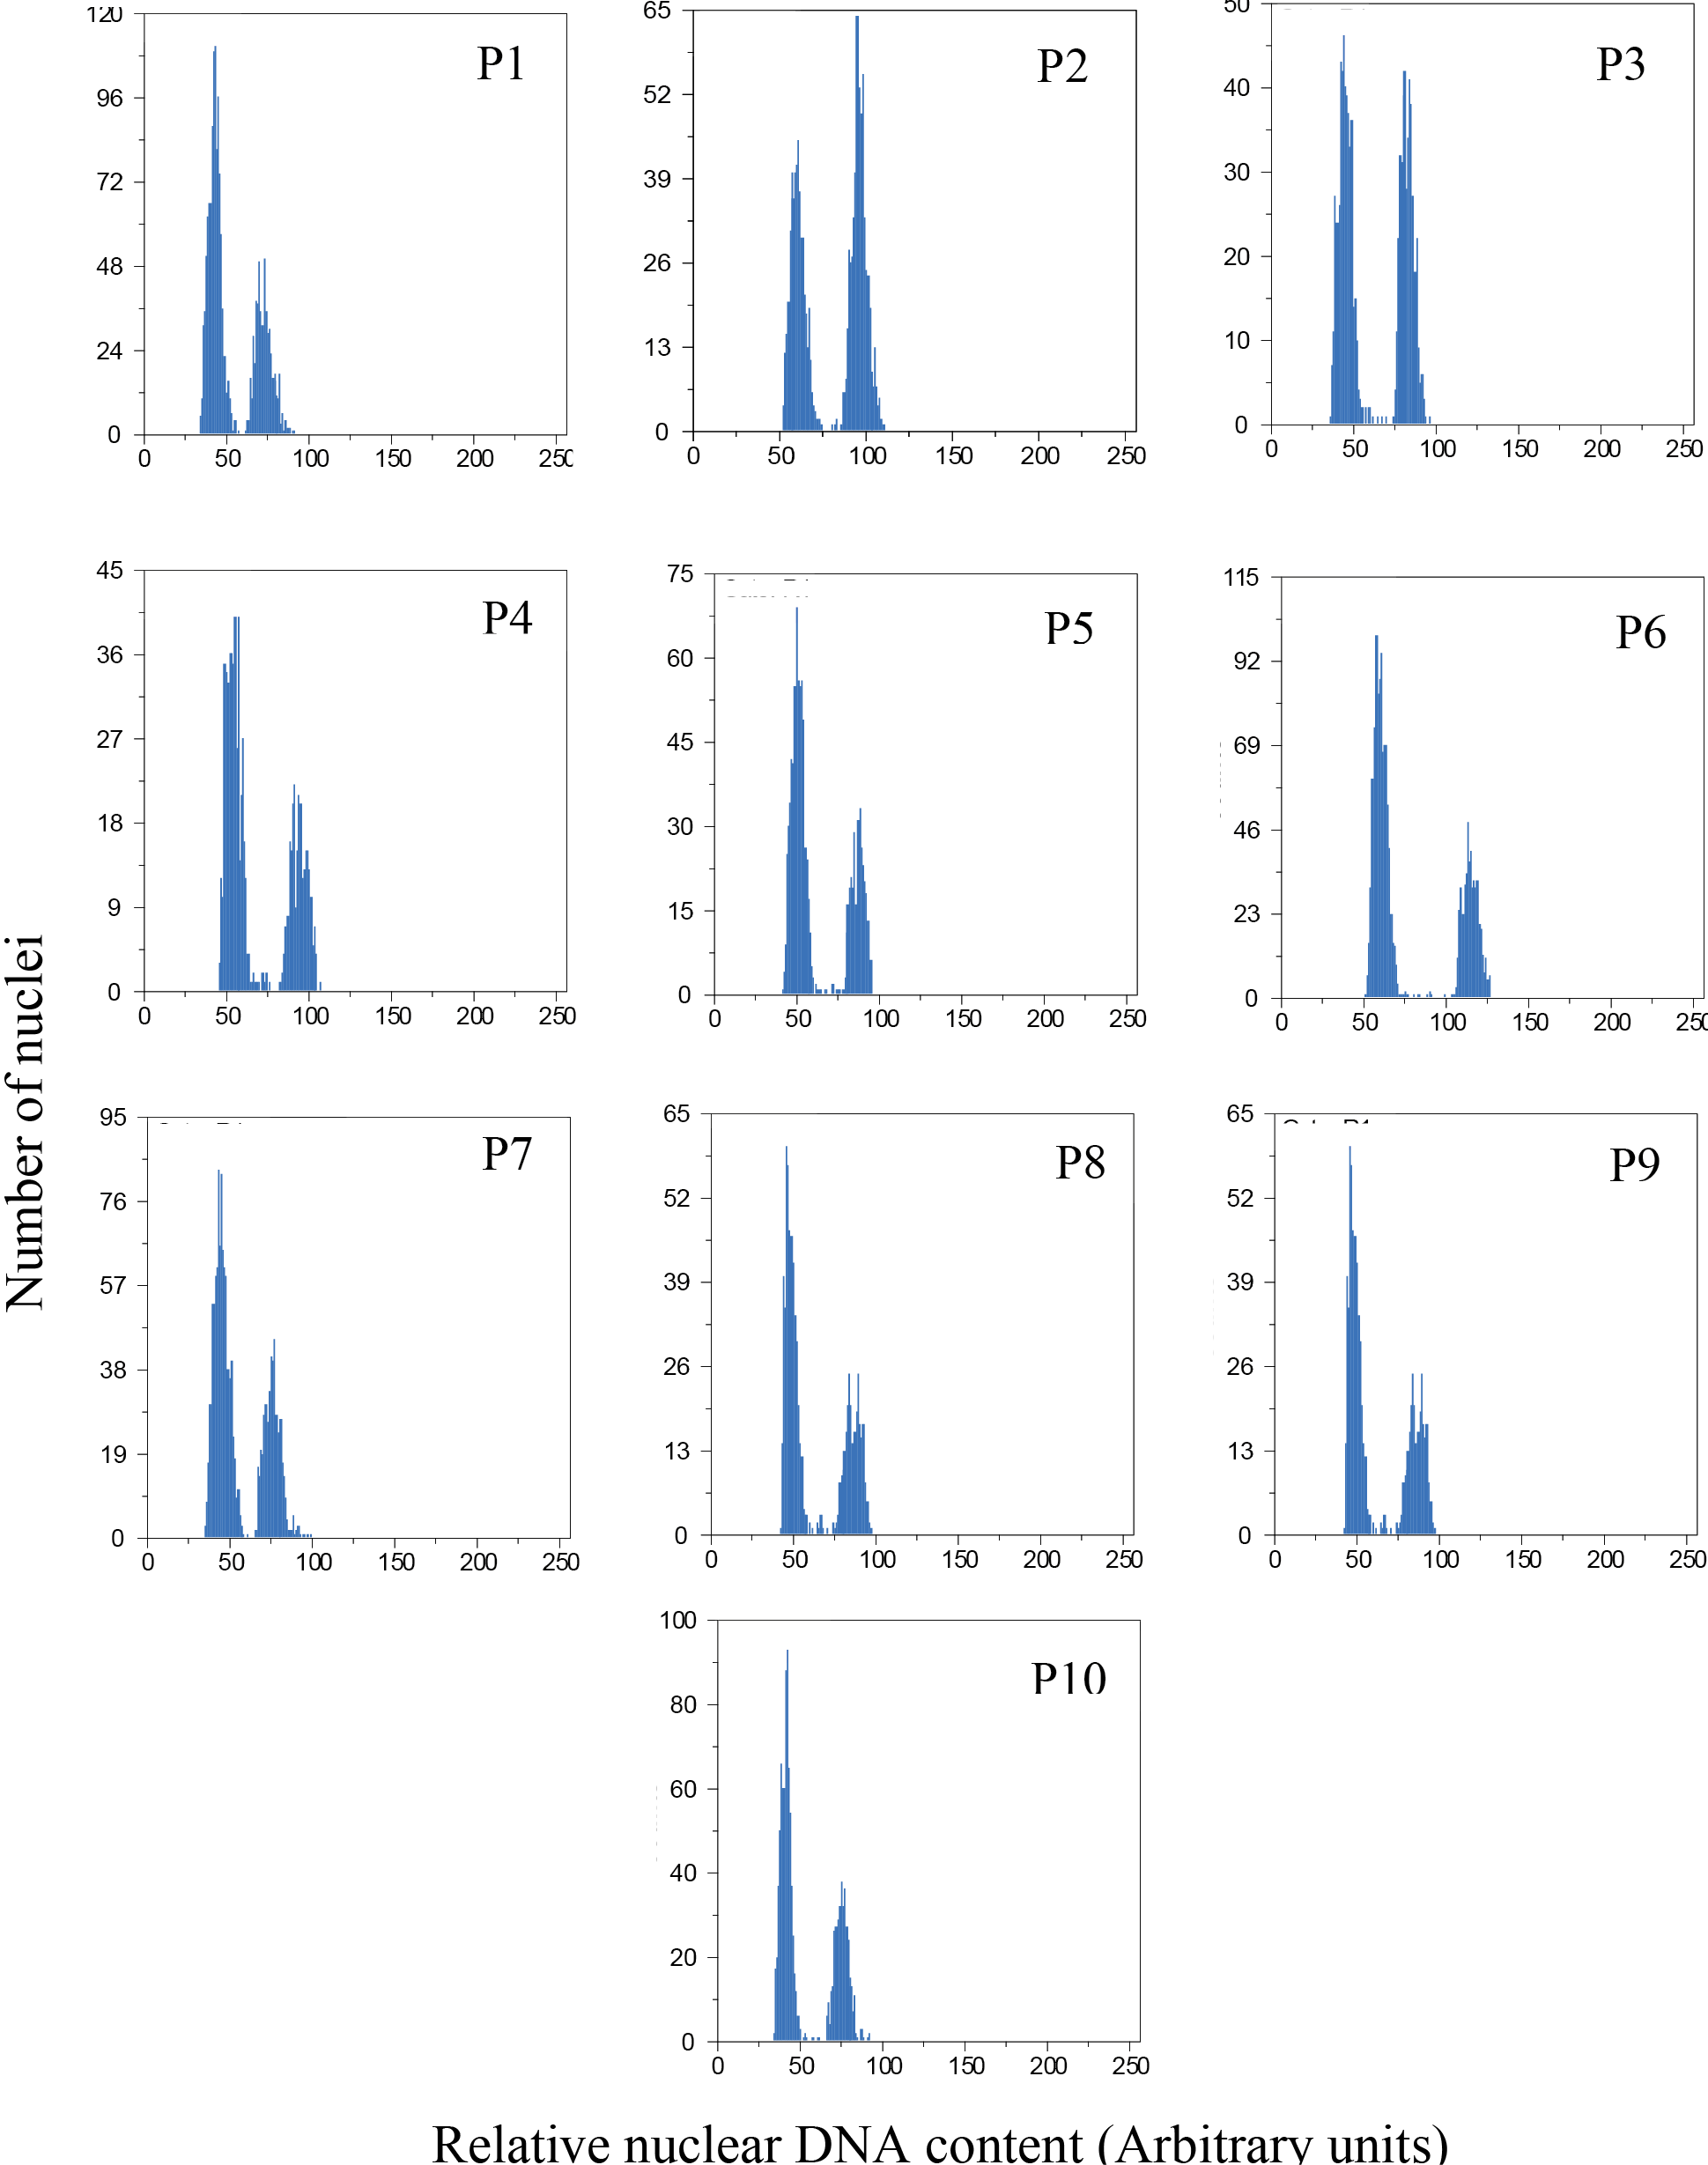
The analysis of variance of monoploid genome size (2Cx DNA) revealed no significant differences (P < 0.05) among the studied populations (Table 2). The flow cytometric nuclear monoploid DNA amount (2Cx DNA) of the studied populations is shown in Figure 4. The mean genome size in the nine populations (P1-P8, P10) with 30 chromosomes was 0.646 pg, ranging from 0.608 pg (P10) to 0.677 pg (P2; Table 3). It was 0.633 pg in the P9 population with 34 chromosomes. Overall, the mean 2Cx DNA for all 10 populations was 0.643 pg or 628.85 Mbp (Table 3). However, to explore potential differences, mean comparisons were performed, using the LSD method at P < 0.05, indicating a significant difference between populations P2, P6, and P10 (Table 3). Additionally, histogram analysis complemented the karyotypic examination, confirming the diploid nature of the studied populations.
Multivariate statistical analysis
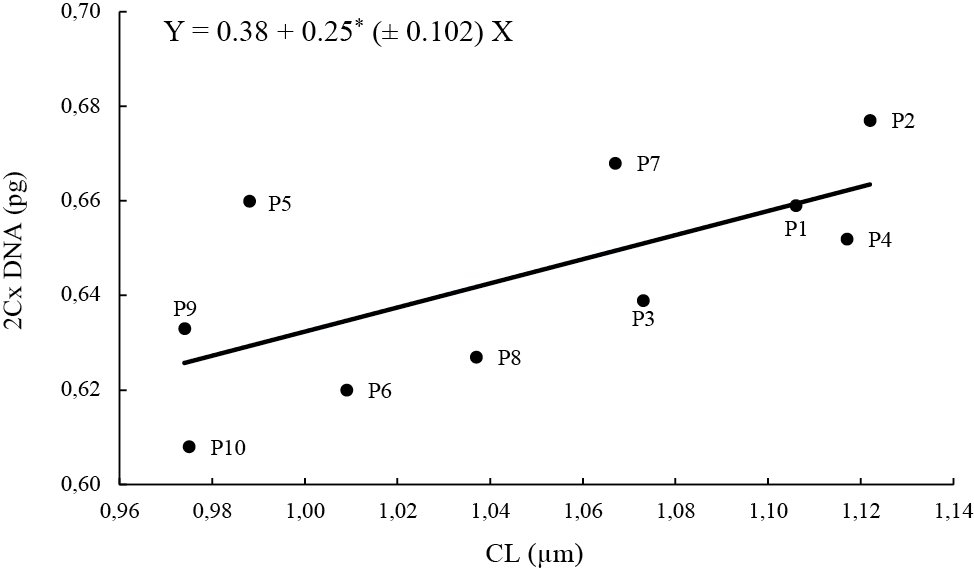
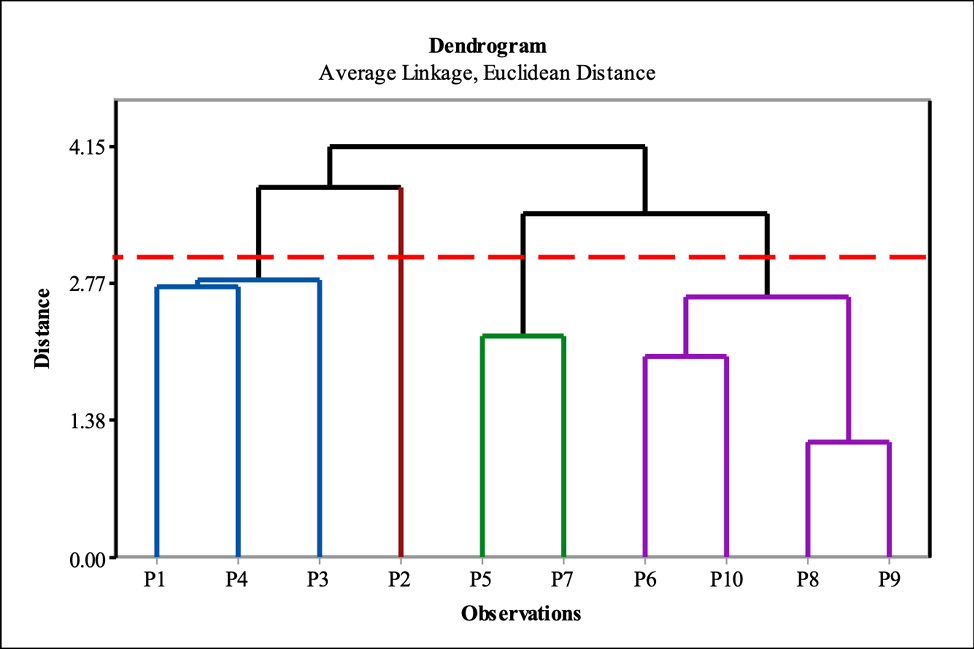
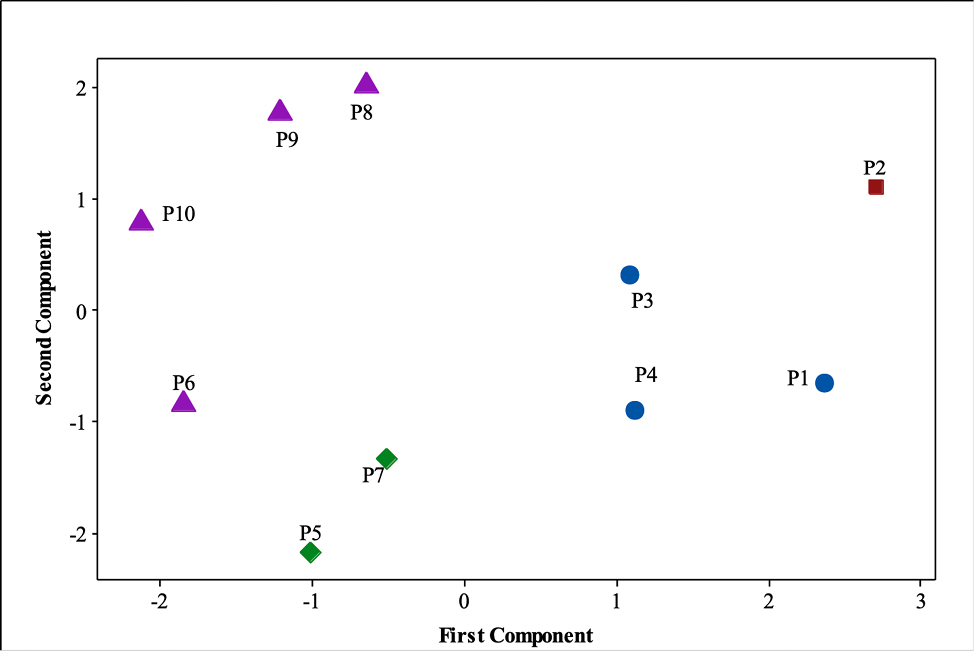
The correlation between mean monoploid genome size (2Cx DNA) and either chromosome length (CL), or geographical parameters (latitude, longitude, altitude, mean temperature, and mean rainfall) in the populations of the medicinal plant caper is presented in Table 4. The correlation coefficient between 2Cx DNA and CL was positive and significant (P < 0.05; r = 0.66*). However, no significant differences were found for the geographical parameters. Given the significant correlation between monoploid genome size and CL, linear regression analysis (b = 0.25*) was conducted (Figure 5). Additionally, cluster analysis was performed to identify distinct groups of individuals based on their genetic similarity. This analysis was based on mean original data for 2Cx DNA, chromosome length (CL), and the geographical parameters. To determine the distance between populations, Euclidean distance was calculated, and cluster merging was performed, using the unweighted pair group method with arithmetic mean (UPGMA) method. Moreover, to evaluate the efficiency of the classification method, the cophenetic coefficient was calculated, using NTSYS 2.02e software. Various classification methods were tested with this software. Ultimately, the method that determined the Euclidean distance and merged the average cluster, which had a higher cophenetic coefficient value (r = 0.92), was selected to present the results (Table 5). It should be noted that the higher the cophenetic coefficient for a method, the better it is for cluster analysis (Batagelj, 1988; Gong et al., 1995). Subsequently, cluster analysis was performed, using Minitab 17.0 software by standardizing the parameters. The results of the cluster analysis are presented in the form of a dendrogram (Figure 6). According to which, the populations of caper medicinal plant were divided into four groups. The first group included three populations of P1, P3, and P4, the second group included P2 population, the third group comprised two populations of P5 and P7, and the fourth group included four populations of P6, P8, P9, and P10 (Figure 7). Furthermore, to determine the total variation in populations and the contribution of parameters to this variation, principal component analysis (PCA) was performed on the 2Cx DNA, CL, and geographic parameters. The analysis revealed that the first four principal components accounted for 93% of the cumulative variation. The first two coordinates were displayed in a 2-dimensional graphic based on the desired parameters in four categories (Figure 6). The results showed that CL (0.53), 2Cx DNA (0.41), latitude (0.55), and mean annual temperature (-0.45) had a stronger correlation with the first coordinate, which accounted for 42% of the variation in the calculated data. In the second component, altitude (0.61), average annual precipitation (0.65), and average annual temperature (-0.31) played a vital role in explaining 20% of the total variation. In the third component, 2Cx DNA (0.38) and longitude (-0.91) had the highest contributions. In the fourth component, 2Cx DNA (-0.51), average annual rainfall (0.53), and average annual temperature (-0.40) played the most significant roles. Together, these two components accounted for 23% of the total variance (Table 6).
| Trait | CL (μm) | Latitude (N) | Longitude (E) | Altitude (m) | Mean Temp. (˚C) | Mean rainfall (mm) |
|---|---|---|---|---|---|---|
| 2Cx DNA (pg) | 0.66* | 0.62 ns | -0.13 ns | -0.16ns | -0.32 ns | -0.23 ns |
| Linkage Method |
Euclidean Distance | Squared Euclidean Distance | ||||
|---|---|---|---|---|---|---|
| UPGMA | Single | Complete | UPGMA | Single | Complete | |
| Cophenetic Coefficient |
0.92 | 0.90 | 0.91 | 0.83 | 0.83 | 0.82 |
| Characteristics | Components | |||
|---|---|---|---|---|
| First | Second | Third | Fourth | |
| Eigenvalue | 2.93 | 1.94 | 1.10 | 0.49 |
| Relative variance | 0.42 | 0.28 | 0.16 | 0.07 |
| Cumulative variance | 0.42 | 0.70 | 0.86 | 0.93 |
| CL (μm) | 0.53 | -0.08 | -0.11 | -0.33 |
| 2Cx DNA (pg) | 0.41 | -0.28 | 0.38 | -0.51 |
| Latitude (N) | 0.55 | -0.11 | -0.05 | 0.36 |
| Longitude (E) | 0.09 | -0.10 | -0.91 | -0.21 |
| Altitude (m) | 0.18 | 0.61 | -0.09 | 0.11 |
| Mean temp. (°C) | -0.45 | -0.31 | -0.06 | -0.40 |
| Mean rainfall (mm) | -0.03 | 0.65 | 0.06 | -0.53 |
Discussion
The results of this study provide, for the first time, accurate snapshots of the chromosome number of endemic Iranian populations of the caper (Capparis spinosa) medicinal plant. Little information is available about the chromosome number of this plant. In the studied populations, information on chromosome and monoploid genome size (2Cx DNA) was completely inadequate. As a result, this study provides basic cytogenetic, genetic, and genomic information for these populations, which is useful for constructing genetic and physical maps and for whole genome sequencing in the future. The findings of the present study showed a diploid (2x) ploidy level, as well as two different chromosome numbers of 30 and 34. In previous studies, the chromosome numbers reported as 24 (Magulaev, 1979), 38 (Al-Turki et al., 2000), and 42 (Wang et al., 2022). Variation in somatic chromosome number has been reported in the root tips of many flowering plant species (angiosperms) (e.g. Kula, 1999; Winterfeld et al., 2015, 2020; Mehravi et al., 2022a). In the present report, the average chromosome length was determined to be 1.055 μm in populations (P1-P8, P10) with 30 chromosomes and 0.974 μm in a P9 population with 34 chromosomes.
Flow cytometry has been successfully employed to estimate nuclear genomic DNA content (Doležel and Bartoš, 2005; Doležel et al., 2007; Bourge et al., 2018) and to accurately determine ploidy levels in a diverse array of plant species (Mahdavi and Karimzadeh, 2010; Tavan et al., 2015; Abedi et al., 2015; Tarkesh Esfahani et al., 2016, 2020; Javadian et al., 2017; Hamidi et al., 2018; Mehravi et al., 2022a, b; Firoozi et al., 2022; Mohammadpour et al., 2022; Zarabizadeh et al., 2022; Rasekh and Karimzadeh, 2023; Khakshour et al., 2024; Morovati et al., 2024; Yari et al., 2024). In the current report, the genome size of caper (Capparis spinosa) populations with 30 chromosomes (P1-P8, P10) was determined to be 0.646 pg (631.78 Mbp) and that of P9 population with 34 chromosomes was 0.633 pg (619.08 Mbp). Following a previous study on Thymus species (Lamiaceae) reported by Mahdavi and Karimzadeh (2010), in the present study, we calculated the average genome size per chromosome (pg/chr) by dividing the genome size by the chromosome number. Therefore, the average genome size per chromosome (pg/chr) for populations P1-P8 and P10 (30 chromosomes) and P9 (34 chromosomes) was 0.021 pg/chr and 0.019 pg/chr, respectively, or 20.54 and 18.58 Mbp/chr, respectively. Hence, such a slight smaller genome size of a 34-chr P9 population can be verified by its slight smaller chromosomes (0.974 μm; Table 3). In other words, such a reduction in DNA content in the 34-chr P9 population is fully consistent with the reduction in chromosome length compared to the 30-chr populations (P1-P8, P10). Our results can be compared to a study on caper (Capparis spinosa var. herbacea) in China, which reported a chromosome number of 42 (2n = 2x), a genome size of 549.06 Mbp, and an average of 13.07 Mbp/chr (Wang et al., 2022). Thus, the genome size of the caper population studied in China, with 42 chromosomes, was approximately 57% and 42% smaller than that of 30- and 34-chr caper populations studied in the current report, respectively. Consequently, it can be concluded that the chromosomes of the Iranian endemic caper populations exhibit approximately twice the genome size compared to the caper plant reported in China. This suggests that the average chromosome length of the endemic Iranian caper plant is likely to be longer than that of the Chinese plants.
Cytogenetic studies can be used to better understand the relationships between different species and populations of a species, and to guide the evolutionary trends of plants (Stebbins, 1971). The first step towards understanding the genetic characteristics of a plant is to determine the status of its chromosomes. Chromosomal information allows for the comparison of species and their populations (Singh 2016). Populations of each species exhibit their own genomic adaptations to the environment in which they grow. As adaptive differences increase, new varieties and even new species may emerge in plant habitats (Weigel and Nordborg, 2015). Therefore, chromosomes are suitable factors on which to determine the evolutionary process of plants (Levin, 2002). Chromosomal differences are different from morphological, physiological, and ecological differences (Caceres et al., 1998). Because these differences reflect differences in the products of gene action that change due to environmental factors, while chromosomal differences are more or less due to the genetic content of individuals (Beckmann et al., 2007). Differences in chromosome size can indicate differences in the gene products or proteins that an individual produces, or they can indicate duplication of genes that can affect the rate of synthesis of various proteins (Kondrashov et al., 2002). Differences in karyotype morphology indicate differences in gene arrangement, which can significantly affect how genes segregate and recombine during Mendelian inheritance. Finally, differences in chromosome number can indicate differences in gene arrangement, gene duplication, or both (Stebbins 1950, 1971; Goldblatt et al., 1979; Levin, 2002; Patwardhan et al., 2022). The present study revealed significant variation in chromosome length (CL), providing evidence for intraspecific chromosomal diversity (Table 2). Chromosomal number variation among populations indicates that chromosomal structural changes may provide a valuable tool for differentiating closely related populations that exhibit minimal morphological divergence (Mayrose et al., 2021). Chromosomal differences, such as variations in chromosome number and length, can be utilized in breeding programs to generate hybrid populations. Parental combinations exhibiting differences in chromosome number/length, particularly those affecting chromosome pairing, can facilitate successful hybridization (Hamidi et al., 2018; Akbarzadeh et al., 2021). On the other hand, in the present report, the P2 population exhibited the highest average genome size (0.677 pg) and the longest average chromosome length (1.122 μm) among the studied Iranian caper populations. It is noteworthy that this population was placed in a separate group in the principal component analysis and cluster analysis compared to the other populations, as illustrated in Figs. 1 and 2. An increase in nuclear DNA content is typically associated with an increase in total chromosome volume and subsequently cell size, which can lead to larger seed size (Karimzadeh et al., 2011). Considering that the fruits of this medicinal caper plant are edible and its seeds contain valuable oil for medicinal and industrial uses (Matthäus and Özcan, 2005; Ara et al., 2013). Thus, the P2 population can potentially be a valuable resource for polyploidy induction or hybridization programs aimed at producing larger seeds with enhanced oil content. Furthermore, genome size can serve as an effective marker for identifying hybrids (Ellul et al., 2002).
In the present report, the positive and significant correlation between chromosome length (CL) and 2Cx DNA content suggests a strong association between changes in nuclear DNA content and structural alterations in chromosomes. This finding is consistent with previous reports of such correlations in Vicia (Naranjo et al., 1998), Tulipa (Abedi et al., 2015), Hypericum (Mehravi et al., 2022a), and Pimpinella (Mehravi et al., 2022b). Cluster analysis based on cytological data and geographical conditions revealed four distinct clusters of populations. These results suggest that populations within a cluster exhibit the lowest metric distances and the highest degree of homology in terms of chromosome length, genome size, and geographical parameters. This information can be valuable for selecting parental lines in breeding programs aimed at maximizing genetic diversity. To assess the overall variation within the population and the relative contribution of different karyotypic parameters, principal component analysis (PCA) was also performed. The first two principal components explained 70% of the cumulative variation, and were subsequently visualized in a two-dimensional plot (Fig. 6). Furthermore, PCA analysis applied to different caper populations demonstrated the strong discriminatory power of karyological parameters, genome size, and geographical conditions in distinguishing between these populations. As previously reported, PCA is a valuable tool for establishing karyological relationships (Peruzzi and Altinordu, 2014). While karyological data provide valuable insights into evolutionary relationships, they are not sufficient on their own to establish robust phylogenetic relationships between species. It is crucial to integrate karyological data with independent sources of systematic information, such as morphological, molecular, and ecological data (Siljak-Yakovlev and Peruzzi, 2012; Peruzzi and Eroǧlu, 2013; Harpke et al., 2015). Consequently, geographical data were incorporated into the cluster analysis and PCA to enhance the phylogenetic inference.
Conclusion
This study examined the genetic diversity of the medicinal plant Capparis spinosa across ten distinct populations in Iran, utilizing chromosome analysis, ploidy level assessment, and genome size determination via flow cytometry. The findings revealed that all populations were diploid, with two distinct chromosome counts observed: 2n = 30 and 2n = 34. This represents the first documented instances of these chromosome numbers in C. spinosa. Genome size assessment indicated that while there were no significant differences in genome size among the populations, notable variations in chromosome length were detected. Clustering and principal component analysis demonstrated significant genetic diversity across the populations, categorizing them into four separate groups. These results contribute essential baseline data regarding the karyotype and genome size of C. spinosa in Iran. Such information may be instrumental for future endeavors in genetic mapping, genome sequencing, and breeding programs for this valuable medicinal species. The observed genetic diversity among populations underscores the potential for developing new cultivars with desirable traits.
Acknowledgment
Authors gratefully acknowledge the academic financial support provided by the Tarbiat Modares University, Tehran, Iran
Author contribtions
PR, and GK conceived and designed this study. PR conducted the experiments. PR and GK analyzed the data. PR wrote the manuscript. GK revised the manuscript.
Data avilabity statement
The original contributions presented in the study are included in the article/supplementary material, further inquiries can be directed to the corresponding author/s
Funding
This research was supported by the University of Tarbiat Modares University, Iran.
References
Abbasi-Karin Sh, Karimzadeh G, and Mohammadi-Bazargani M. 2022. Interspecific chromosomal and genome size variations in in vitro propagated willow herb (Epilobium spp.) medicinal plant. Cytologia 87(2): 129-135. https://doi.org/10.1508/cytologia.87.129.
Abedi R, Babaei A, and Karimzadeh G. 2015. Karyological and flow cytometric studies of Tulipa (Liliaceae) species from Iran. Plant Syst. Evol. 301: 1473-1484. https://doi.org/10.1007/s00606-014-1164-z.
Agah F. Esmaeili M. A. Farzam M. and Abbasi R. 2020. Effect of dormancy breaking treatments and seed bed medium on seed germination and morphology of Capparis spinosa L. Seedlings. Iran. J. Seed Sci. Technol. 9(3): 45-57. https://doi.org/10.22034/ijsst.2019.125542.1262.
Aguilar-Rito M. G. Arzate-Fernández A. M. García-Núñez, H. G. and Norman-Mondragón T. H. 2023. Establishment of an efficient protocol for in vitro disinfection of seeds of seven Agave spp. species. Rev. Mex. Fitopatol. Mex. J. Phytopathol. 42. https://doi.org/10.18781/r.mex.fit.2310-1.
Ahmadi-Roshan M, Karimzadeh G, Babaei A, and Jafari H. 2016. Karyological studies of Fritillaria (liliaceae) species from Iran. Cytologia (Tokyo). 81: 133-141. https://doi.org/10.1508/cytologia.81.133.
Akbarzadeh M,Van Laere K, Leus L, De Riek J, Van Huylenbroeck J, Werbrouck SP, and Dhooghe E. 2021. Can knowledge of genetic distances, genome sizes and chromosome numbers support breeding programs in hardy geraniums? Genes (Basel). 12. https://doi.org/10.3390/genes12050730.
Ali MES, and Amar MH. 2020. A systematic revision of Capparaceae and Cleomaceae in Egypt: an evaluation of the generic delimitations of Capparis and Cleome using ecological and genetic diversity. J. Genet. Eng. Biotechnol. 18: 58. https://doi.org/10.1186/s43141-020-00069-z.
Al-Turki TA, Filfilan SA, and Mehmood SF. 2000. A cytological study of flowering plants from Saudi Arabia. Willdenowia 30: 339-358. https://doi.org/10.3372/wi.30.30211.
Anjum N, Dash CK, and Sultana SS. 2023. Karyological diversity among six medicinally important species of Acanthaceae with three new chromosome counts. Nucl., 1-9. https://doi.org/10.1007/s13237-023-00443-5.
Annaz H, Sane, Y, Bitchagno GTM, Ben Bakrim W, Drissi B, Mahdi I, El Bouhssini M, and Sobeh M. 2022. Caper (Capparis spinosa L.): An updated review on its phytochemistry, nutritional value, traditional uses, and therapeutic potential. Front. Pharmacol. 13: 1-22. https://doi.org/10.3389/fphar.2022.878749.
Ara KM, Karami M, and Raofie F. 2014. Application of response surface methodology for the optimization of supercritical carbon dioxide extraction and ultrasound-assisted extraction of Capparis spinosa. Elsevier. https://doi.org/10.1016/j.supflu.2013.10.016.
Argentieri M, Macchia F, Papadia P, Fanizzi F P, and Avato P 2012. Bioactive compounds from Capparis spinosa subsp. rupestris. Ind. Crops Prod. 36(1): 65-69. doi.org/10.1016/j.indcrop.2011.08.007.
Aydın ZU, Eroğlu HE, Şenova MK, Martin E, Tuna M, and Dönmez AA. 2024. Chromosome characterization and genome size in Nigella and Garidella species (Ranunculaceae) with their taxonomic implications. Cytologia 89: 117-125. https://doi.org/10.1508/cytologia.89.117.
Bakr RO, and El Bishbishy MH. 2016. Profile of bioactive compounds of Capparis spinosa var. aegyptiaca growing in Egypt. Rev. Bras. Farmacogn. 26: 514-520. https://doi.org/10.1016/J.BJP.2016.04.001.
Barbera G, and Di Lorenzo R. 1984. The caper culture in Italy. Acta Horticulturae: 167-172. https://doi.org/10.17660/actahortic.1984.144.21.
Beckmann J, Estivill X, and Antonarakis S. 2007. Copy number variants and genetic traits: closer to the resolution of phenotypic to genotypic variability. Nat. Rev. Genet. 8: 639-646. https://doi.org/10.1038/nrg2149.
Bourge, M., Brown, S. C., and Siljak-Yakovlev, S. (2018). Flow cytometry as tool in plant sciences, with emphasis on genome size and ploidy level assessment. Genet. Appl. 2, 1-12. https://hal.science/hal-03937019v1.
Caceres M, De Pace C, Mugnozza GS, Kotsonis P, Ceccarelli M, and Cionini PG. 1998. Genome size variations within Dasypyrum villosum: correlations with chromosomal traits, environmental factors and plant phenotypic characteristics and behaviour in reproduction. Theor. Appl. Genet. 96: 559-567. https://doi.org/10.1007/s001220050774.
Cardoso FC, Berri RA, Lucca G, Borges EN, and Mattos VLD. 2023. Normality tests: a study of residuals obtained on time series tendency modeling. Exacta. https://doi.org/10.5585/2023.22928.
Carr GD. 1978. Chromosome numbers of Hawaiian flowering plants and the significance of cytology in selected taxa. Am. J. Bot. 65: 236-242. https://doi.org/10.1002/j.1537-2197.1978.tb06061.x.
Carra A, Sajeva M, Abbate L, Siragusa M, Sottile F, and Carimi F. 2012. In vitro plant regeneration of caper (Capparis spinosa L.) from floral explants and genetic stability of regenerants. Plant Cell Tiss. Org. Cult. 109: 373-381. https://doi.org/10.1007/s11240-011-0102-9.
Carta A, Bedini G, and Peruzzi L. 2018. Unscrambling phylogenetic effects and ecological determinants of chromosome number in major angiosperm clades. Sci. Rep. 8: 14258. https://doi.org/10.1038/s41598-018-32515-x.
Cedillo-Cortezano M, Martinez-Cuevas LR, López JAM, Barrera López IL, Escutia-Perez S, and Petricevich VL. 2024. Use of medicinal plants in the process of wound healing: a literature review. Pharmaceuticals, 17(3): 303. https://doi.org/10.3390/ph17030303.
Chedraoui S, Abi-Rizk A, El-Beyrouthy M, Chalak L, Ouaini N, and Rajjou L. 2017. Capparis spinosa L. in A systematic review: A xerophilous species of multi values and promising potentialities for agrosystems under the threat of global warming. Front. Plant Sci. 8. https://doi.org/10.3389/fpls.2017.01845.
Cincotta F, Merlino M, Verzera A, Gugliandolo E, and Condurso C. 2022. Innovative process for dried caper (Capparis spinosa L.) powder production. Foods 11. https://doi.org/10.3390/foods11233765.
Condurso C, Mazzaglia A, Tripodi G, Cincotta F, Dima G, Maria Lanza C, and Verzera A. 2016. Sensory analysis and head-space aroma volatiles for the characterization of capers from different geographic origin. J. Essent. Oil Res., 28(3): 185-192. https://doi.org/10.1080/10412905.2015.1113205.
Doležel J, and Bartoš J. 2005. Plant DNA flow cytometry and estimation of nuclear genome size. Ann. Bot. 95: 99-110. https://doi.org/10.1093/aob/mci005.
Doležel J, Bartos ., Voglmayr H, and Greilhuber J. 2003. Nuclear DNA content and genome size of trout and human. Cytometry. A 51: 127-128; author reply 129. https://doi.org/10.1002/cyto.a.10013.
Doležel J, Greilhuber J, and Suda J. 2007. Estimation of nuclear DNA content in plants using flow cytometry. Nat. Protoc. 2: 2233-2244. https://doi.org/10.1038/nprot.2007.310.
Doležel J, Sgorbati S, and Lucretti S. 1992. Comparison of three DNA fluorochromes for flow cytometric estimation of nuclear DNA content in plants. Physiol. Plant. 85: 625-631. https://doi.org/10.1111/j.1399-3054.1992.tb04764.x.
Ellul P, Boscaiu M, Vicente O, Moreno V, and Rosselló JA. 2002. Intra- and inter-specific variation in DNA content in Cistus (Cistaceae). Ann. Bot. 90: 345-351. https://doi.org/10.1093/aob/mcf194.
Firoozi N, Karimzadeh G, Sabet MS, and Sayadi V. 2022. Intraspecific karyomorphological and genome size variations of in vitro embryo derived Iranian endemic Asafoetida (Ferula assa-foetida L., Apiaceae). Caryologia 75: 111-121. https://doi.org/10.36253/caryologia-1721.
Gao Y, Zhao G, Xu Y, Hao Y, Zhao T, Jia L, and Chen Z. 2024. Karyotype analysis and genome size estimation of Sapindus mukorossi Gaertn. an economical important tree species in China. Bot. Lett. 171(12): 116-124. https://doi.org/10.1080/23818107.2023.2244179.
Garbari F, Bedini G, and Peruzzi L. 2012. Chromosome numbers of the Italian flora. From the Caryologia foundation to present. Caryologia 65: 62-71. https://doi.org/10.1080/00087114.2012.678090.
Goldblatt P. and Johnson ED. 1979. Index to plant chromosome numbers. Missouri Botanical Garden. Inc. Ann Arbour, Michigan. Available at: http://www.tropicos.org/Project/IPCN.
Gregory TR. 2005. Genome size evolution in animals. In the evolution of the genome. Academic Press. Pp. 3-87. https://doi.org/10.1016/B978-012301463-4/50003-6.
Greilhuber J, Doležel J, Lysák MA, Bennett MD. 2005. The origin, evolution and proposed stabilization of the terms ‘genome size’ and ‘C-value’ to describe nuclear DNA contents. Annals of Botany, 95(1): 255-260. https://doi.org/10.1093/aob/mci019.
Guerra M. 2012. Cytotaxonomy: The end of childhood. Plant Biosyst. 146: 703-710. https://doi.org/10.1080/11263504.2012.717973.
Gupta RC, and Gill BS. 1981. In chromosome number reports LXXI. Taxon 30: 514. http://www.jstor.org/stable/1220167.
Hamidi F, Karimzadeh G, Rashidi Monfared S, and Salehi M. 2018. Assessment of Iranian endemic Artemisia khorassanica: Karyological, genome size, and gene expressions involved in artemisinin production. Turk. J. Biol. 42: 322-333. https://doi.org/10.3906/biy-1802-86.
Harpke D, Carta A, Tomović G, Randelović V, Randelović N, Blattner FR, and Peruzzi L. 2015. Phylogeny, karyotype evolution and taxonomy of Crocus series Verni (Iridaceae). Plant Syst. Evol. 301: 309-325. https://doi.org/10.1007/s00606-014-1074-0.
Hinkelmann K. 2012. Design and Analysis of Experiments. John Wiley & Sons. https://doi.org/10.1002/9781118147634
Honarmand SJ, Nosratti I, Nazari K, and Heidari H. 2016. Factors affecting the seed germination and seedling emergence of muskweed (Myagrum perfoliatum). Weed Biol. Manag. 16: 186-193. https://doi.org/10.1111/wbm.12110.
Jang TS. and Weiss-Schneeweiss H. 2018. Chromosome numbers and polyploidy events in Korean non-commelinids monocots: A contribution to plant systematics. Korean J. Plant Taxon. 48: 260-277. https://doi.org/10.11110/kjpt.2018.48.4.260.
Javadian N, Karimzadeh G, Sharifi M, Moieni A, and Behmanesh M. 2017. In vitro polyploidy induction: changes in morphology, podophyllotoxin biosynthesis, and expression of the related genes in Linum album (Linaceae). Planta 245: 1165-1178. https://doi.org/10.1007/s00425-017-2671-2.
Kamel W, Abd El-Ghani MM, and El-Bous M. 2009. Taxonomic study of Capparaceae from Egypt: revisited. African J. Pl. Sci. Biotech, 3: 27-35.
Karimzadeh G, Danesh-Gilevaei M., and Aghaalikhani M. 2011. Karyotypic and nuclear DNA variations in Lathyrus sativus (Fabaceae). Caryologia 64: 42-54. https://doi.org/10.1080/00087114.2011.10589763.
Khakshour A, Karimzadeh G, Sabet MS, and Sayadi V. 2024. Karyomorphological and genome size variation in Iranian endemic populations of coriander (Coriandrum sativum L.). Cytologia 89: 21-27. https://doi.org/10.1508/cytologia.89.21.
Khatoon S, and Ali SI. 1993. Chromosome atlas of the angiosperms of Pakistan. Karachi Univ. Karachi vii, 232 p., ISBN 1104765435.
Kocjan D, Dolenc Koce J, Etl F, and Dermastia M. 2022. Genome size of life forms of Araceae-A new piece in the C-value puzzle. Plants (Basel, Switzerland) 11. https://doi.org/10.3390/plants11030334/
Kondrashov FA, Rogozin IB, Wolf YI, and Koonin EV. 2002. Selection in the evolution of gene duplications. Genome Biol. 3: 1-9. https://doi.org/10.1186/gb-2002-3-2-research0008.
Kula A. 1999. Cytogenetic studies in the cultivated form of Bromus carinatus (Poaceae). W. Szafer Institute of Botany, Polish Academy of Sciences. 101-106.
Levin DA. 2002. The role of chromosomal change in plant evolution. Oxford University Press, USA.
Loureiro J, Rodriguez E, Doležel J, and Santos C. 2007. Two new nuclear isolation buffers for plant DNA flow cytometry: A test with 37 species. Ann. Bot. 100: 875-888. https://doi.org/10.1093/aob/mcm152.
Magulaev AJ. 1979. The chromosome numbers of flowering plants in the northern Caucasus. part 3. Flora north Caucasus Quest. Its Hist. 3: 101-106.
Mahdavi S, and Karimzadeh G. 2010. Karyological and nuclear dna content variation in some Iranian endemic Thymus species (Lamiaceae). J. Agric. Sci. Technol. 12: 447-458.
Mahmoudi S, and Mirzaghaderi G. 2023. Tools for Drawing Informative Idiograms Methods in Molecular Biology, (Springer). 515-527. https://doi.org/10.1007/978-1-0716-3226-0_31.
Marir EMA. 2024. Propagation of medicinal capers (Capparis spinosa L.) and production of some medicinal secondary metabolic compounds using plant tissue culture technology. Euphrates J. Agric. Sci. 16.
Matthäus B, and Özcan M. 2005. Glucosinolates and fatty acid, sterol, and tocopherol composition of seed oils from Capparis spinosa var. spinosa and Capparis ovata Desf. var. canescens (Coss.) Heywood. J. Agric. Food Chem. 53: 7136-7141. https://doi.org/10.1021/jf051019u.
Mayrose I, and Lysak MA. 2021. The evolution of chromosome numbers: mechanistic models and experimental approaches. Genome Biol. Evol. 13. https://doi.org/10.1093/gbe/evaa220.
Mehravi S, Karimzadeh G, Kordenaeej A, and Hanifei M. 2022a. Mixed-ploidy and dysploidy in Hypericum perforatum: A karyomorphological and genome size study. Plants 11(22): 3068. https://doi.org/10.3390/plants11223068.
Mehravi S, Ranjbar GA, Najafi-Zarrini H, Mirzaghaderi G, Hanifei M, Severn-Ellis AA, Edwards D, and Batley J. 2022b. Karyology and genome size analyses of Iranian endemic Pimpinella (Apiaceae) species. Front. Plant Sci. 13: 1-14. https://doi.org/10.3389/fpls.2022.898881.
Merlino M, Condurso C, Cincotta F, Nalbone L, Ziino G, and Verzera A. 2024. Essential oil emulsion from caper (Capparis spinosa L.) leaves: exploration of its antibacterial and antioxidant properties for possible application as a natural food preservative. Antioxidants 13(6) : 718. https://doi.org/10.3390/antiox13060718.
Mesquita AT, Braz GT, Shimizu GH, Machado RM, Romero-da Cruz MV, and Forni-Martins ER. 2024. Karyotype diversity and genome size in the Cyphomandra clade of Solanum L. (Solanaceae). Bot. J. Linn. Soc. https://doi.org/10.1093/botlinnean/boae047.
Moghaddasi MS. 2011. Caper (Capparis spp.) importance and medicinal usage. Adv. Environ. Biol. 5(5): 872-879.
Mohammadpour S, Karimzadeh G, and Ghaffari SM. 2022. Karyomorphology, genome size, and variation of antioxidant in twelve berry species from Iran. Caryologia 75: 133-148. https://doi.org/10.36253/CARYOLOGIA-1633.
Morales Valverde R. 1986. Taxonomia De Los Generos Thymus (Excluida De La Seccion Serpyllum) Y Thymbra En La Peninsula Iberica). CSIC – Real Jardin Botanico (RJB), Ruizia. Monografias del Jardin Botanico 3: 324 p. http://hdl.handle.net/10261/66682.
Morovati Z, Karimzadeh G, Naghavi MR, and Rashidi Monfared S. 2024. Chromosome, ploidy analysis, and flow cytometric genome size estimation of Datura stramonium and D. innoxia medicinal plant. Caryologia, 77(3): 53-61. https://doi.org/10.36253/caryologia-2768.
Nabavi SF, Maggi F, Daglia M, Habtemariam S, Rastrelli L, and Nabavi SM. 2016. Pharmacological effects of Capparis spinosa L. Phyther. Res. 30(11): 1733-1744. https://doi.org/10.1002/ptr.5684.
Naranjo CA, Ferrari MR, Palermo AM, and Poggio L. 1998. Karyotype, DNA content and meiotic behaviour in five South American species of Vicia (Fabaceae). Ann. Bot. 82: 757-764. https://doi.org/10.1006/anbo.1998.0744.
Ning H, Ao S, Fan Y, Fu J, and Xu C. 2018. Correlation analysis between the karyotypes and phenotypic traits of Chinese Cymbidium cultivars. Hortic. Environ. Biotechnol. 59: 93-103. https://doi.org/10.1007/s13580-018-0010-6.
Olmez Z, Gokturk A, and Gulcu S. 2006. Effects of cold stratification on germination rate and percentage of caper (Capparis ovata Desf.) seeds. J. Environ. Biol. 27(4): 667-670.
Osborne JW. 2010. Improving your data transformations: Applying the Box-Cox transformation. Pract. Assessment, Res. Eval. 15. https://doi.org/10.7275/qbpc-gk17.
Patwardhan D, Varshini SA, and Galoth L. 2022. Study of Chromosome. In Genetics Fundamentals Notes. Singapore: Springer Nature Singapore. pp 239-298. https://doi.org/10.1007/978-981-16-7041-1_5.
Pellicer J, Hidalgo O, Dodsworth S, and Leitch IJ. 2018. Genome size diversity and its impact on the evolution of land plants. Genes (Basel). 9(2): 88. https://doi.org/10.3390/genes9020088.
Peruzzi L and Altinordu,F. 2014. A proposal for a multivariate quantitative approach to infer karyological relationships among taxa. Comp. Cytogenet. 8: 337-349. https://doi.org/10.3897/CompCytogen.v8i4.8564.
Peruzzi L and Eroǧlu HE. 2013. Karyotype asymmetry: Again, how to measure and what to measure? Comp. Cytogenet. 7: 1-9. https://doi.org/10.3897/CompCytogen.v7i1.4431.
Peruzzi L, Carta A, and Altinordu F. 2017. Chromosome diversity and evolution in Allium (Allioideae, Amaryllidaceae). Plant Biosyst. 151: 212-220. https://doi.org/10.1080/11263504.2016.1149123.
Peruzzi L, Góralski G, Joachimiak AJ, and Bedini G. 2012. Does actually mean chromosome number increase with latitude in vascular plants? An answer from the comparison of Italian, Slovak and Polish floras. Comp. Cytogenet. 6: 371. https://doi.org/10.3897/CompCytogen.v6i4.3955.
Qi J, Liang W, Yunlin Z, Guiyan Y, Tianci T, Yingzi M, Zhenggang X. 2023. Methods for rapid seed germination of Broussonetia papyrifera. Pak. J. Bot. 55: 941-948. https://doi.org/10.30848/PJB2023-3(2).
Radmanesh P, Karimzadeh G, Kashkoli AB, and Heidarzadeh A. 2023. Study on phytochemical traits and improving seed germination methods of Iranian endemic populations of caper (Capparis spinosa L.) medicinal plant. Iran. J. Seed Sci. Res. 10: 41-52. (In Persian with English Abstract). https://doi.org/10.22124/jms.2023.23352.1729.
Rasekh SZ and Karimzadeh G. 2023. Chromosomal and genome size variations in opium poppy (Papaver somniferum L.) from Afghanistan. Caryologia, 76(4): 15-22. https://doi.org/10.36253/caryologia-1955.
Rock BN. 2016. The woods and flora of the Florida Keys : “Pinnatae” /. woods flora Florida Keys “Pinnatae” https://doi.org/10.5962/bhl.title.123255.
Runemark H. 1996. Mediterranean chromosome number reports 6 (590-678). Flora Mediterr. 6, 223-243.
Sakcali MS, Bahadir H, and Ozturk M. 2008. Eco-physiology of Capparis spinosa L.: A plant suitable for combating desertification. Pak. J. Bot, 40(4): 1481-1486. https://www.academia.edu/download/31556522/PJB40(4)1481.pdf.
Sandhu PS. 1989. SOCGI plant chromosome number reports 8. J. Cytol. Genet. 24, 179-183.
Sayadi V, Karimzadeh G, Naghavi MR, and Rashidi Monfared S. 2022. Interspecific genome size variation of Iranian endemic Allium species (Amaryllidaceae). Cytologia (Tokyo). 87: 335-338. https://doi.org/10.1508/cytologia.87.335.
Shahrajabian MH, Sun W, and Cheng Q. 2021. Plant of the millennium, caper (Capparis spinosa L.), chemical composition and medicinal uses. Bull. Natl. Res. Cent. 45. https://doi.org/10.1186/s42269-021-00592-0.
Shariat A, Karimzadeh G, and Assareh MH. 2013. Karyology of Iranian endemic Satureja (Lamiaceae) species. Cytologia (Tokyo). 78: 305-312. https://doi.org/10.1508/cytologia.78.305.
Sharma A. (1968). Chromosome number reports of plants. In Annual Report, Cytogenetics Laboratory, Department of Botany, University of Calcutta. Res. Bull. 2: 38-48.
Siljak-YakovlevS and Peruzzi L. 2012. Cytogenetic characterization of endemics: Past and future. Plant Biosyst. 146, 694-702. https://doi.org/10.1080/11263504.2012.716796.
Singh RJ. 2016. Plant Cytogenetics (3rd ed.). CRC Press. 548 p. https://doi.org/10.1201/9781315374611.
Singhal VK and Gill BS. 1984. SOCGI plant chromosome number reports II. J. Cytol. Genet 19: 115-117.
Sliwinska E. 2018. Flow cytometry-a modern method for exploring genome size and nuclear DNA synthesis in horticultural and medicinal plant species. Folia Hortic. 30: 103-128. https://doi.org/10.2478/fhort-2018-0011.
Stace CA. 2000. Cytology and cytogenetics as a fundamental taxonomic resource for the 20th and 21st centuries. Taxon 49: 451-477. doi.org/10.2307/1224344.
Stebbins GL. 1950. Variation and Evolution in Plants. Columbia University Press, USA.
Stebbins GL. 1971. Chromosomal Evolution in Higher Plants. Edward Arnold Ltd, UK.
Subramanian D. and Pondmudi R. 1987. Cytotaxonomical Studies of South Indian Scrophulariaceae. Cytologia (Tokyo). 52: 529-541. https://doi.org/10.1508/cytologia.52.529.
Sundarrajan P and Bhagtaney L. 2023. Traditional Medicinal Plants as Bioresources in Health Security. Apple Academic Press. https://doi.org/10.1201/9781003352983-3.
Swift HH. 1950. The constancy of desoxyribose nucleic acid in plant nuclei. Proceedings of the National Academy of Sciences, Washington 36: 643-654. https://doi.org/10.1073/pnas.36.11.643.
Tarkesh Esfahani S, Karimzadeh G, and Naghavi MR. 2016. 2C DNA value of Persian poppy (Papaver bracteatum Lindl.) medicinal plant as revealed by flow cytometry analysis; a quick effective criteria for distinguishing unidentified Papaver species. International Journal of Advanced Biotechnology and Research, 7(2): 573-578. http://www.bipublication.com.
Tarkesh Esfahani S, Karimzadeh G, and Naghavi MR. 2020. In vitro polyploidy induction in persian poppy (Papaver bracteatum Lindl.). Caryologia 73: 133-144. https://doi.org/10.13128/caryologia-169.
Tavan M, Mirjalili MH, and Karimzadeh G. 2015. In vitro polyploidy induction: changes in morphological, anatomical and phytochemical characteristics of Thymus persicus (Lamiaceae). Plant Cell Tiss. Org. Cult.122: 573-583. https://doi.org/10.1007/s11240-015-0789-0.
Tkach N and Röser M. 2024. Genome sizes of grasses (Poaceae), chromosomal evolution, paleogenomics and the ancestral grass karyotype (AGK). https://doi.org/10.21203/rs.3.rs-3914153/v1.
Tlili N, Mejri H, Anouer F, Saadaoui E, Khaldi A, and Nasri N. 2015. Phenolic profile and antioxidant activity of Capparis spinosa seeds harvested from different wild habitats. Industrial Crops and Products, 76: 930-935. https://doi.org/10.1016/j.indcrop.2015.07.040.
Vimala Y, Lavania S, and Lavania UC. 2021. Chromosome change and karyotype differentiation-implications in speciation and plant systematics. Nucl. 64: 33-54. https://doi.org/10.1007/s13237-020-00343-y.
Wang LJ, Gao MD, Sheng MY, and Yin J. 2020. Cluster analysis of karyotype similarity coefficients in Epimedium (Berberidaceae): Insights in the systematics and evolution. PhytoKeys 161: 11-26. https://doi.org/10.3897/PHYTOKEYS.161.51046.
Wang L, Fan L, Zhao Z, Zhang Z, Jiang L, Chai M, and Tian C. 2022. The Capparis spinosa var. herbacea genome provides the first genomic instrument for a diversity and evolution study of the Capparaceae family. Gigascience 11: 1-14. https://doi.org/10.1093/gigascience/giac106.
Weigel D and Nordborg M. 2015. Population genomics for understanding adaptation in wild plant species. Annu. Rev. Genet. 49(1): 315-338. https://doi.org/10.1146/annurev-genet-120213-092110.
Winterfeld G, Ley A, Hoffmann MH, Paule J, and Röser M. 2020. Dysploidy and polyploidy trigger strong variation of chromosome numbers in the prayer-plant family (Marantaceae). Plant Syst. Evol. 306: 1-17. https://doi.org/10.1007/s00606-020-01663-x.
Winterfeld G, Schneider J, Becher H, Dickie J, and Röser M. 2015. Karyosystematics of the Australasian stipoid grass Austrostipa and related genera: chromosome sizes, ploidy, chromosome base numbers and phylogeny. Aust. Syst. Bot. 28: 145-159. https://doi.org/10.1071/sb14029.
Xiaofeng G and Richman MB. 1995. On the application of cluster analysis to growing season precipitation data in North America east of the Rockies. J. Clim. 8: 897-931. https://doi.org/10.1175/1520-0442(1995)008<0897:otaoca>2.0.co;2.
Yari A, Karimzadeh G, Rashidi Monfared ., and Sayadi S. 2024. Mixed-ploidy in Iranian endemic Cymbopogon olivieri (Boiss.) Bor: A chromosomal and holoploid genome size study. Cytologia, 89 (2): 127-131. https://doi.org/10.1508/cytologia.89.127.
Yeshitila M, Gedebo A, Tesfaye B, Demissie H, and Olango TM. 2023. Multivariate analysis for yield and yield-related traits of amaranth genotypes from Ethiopia. Heliyon. 9: 100184. https://doi.org/10.1016/j.heliyon.2023.e18207.
Zarabizadeh H, Karimzadeh G, Rashidi Monfared S, and Tarkesh Esfahani S. 2022. Karyomorphology, ploidy analysis, and flow cytometric genome size estimation of Medicago monantha populations. Turk. J. Botany 46: 50-61. https://doi.org/10.3906/bot-2105-22.
Zare Teymoori S, Karimzadeh G, and Shariat A. 2021. Chromosomal and genome size diversity in savory (Satureja spp.) medicinal plant. Iranian Journal of Rangelands and Forests Plant Breeding and Genetic Research, 29(2): 236-250. https://doi.org/10.22092/ijrfpbgr.2021.354486.1383. (In Persian with English abstract).
Zarei M, Seyedi N, Maghsoudi S, Nejad MS, and Sheibani H. 2021. Green synthesis of Agnanoparticles on the modified graphene oxide using Capparis spinosa fruit extract for catalytic reduction of organic dyes. Inorg. Chem. Commun. 123. https://doi.org/10.1016/j.inoche.2020.108327.