Received: April 12, 2025; Accepted: October 14, 2025; Published: December 24, 2025
Cytotoxicity and genotoxicity of manganese in meristematic cells of Glycine max L. root
Department of Biology, College of Science, King Khalid University, Abha 61413, Saudi Arabia
Email: sasdeky@kku.edu.sa
Abstract. A crucial method for evaluating the potential harm to the genome caused by contaminants at levels exceeding the optimal threshold is the chromosomal plant assay. This paper reports on a study that examined the effects of varying concentrations of manganese (Mn) on the mitotic index (MI), cell kinetics index (CKI), and abnormality index (AI) in Glycine max L. root tip cells. Percentage of mitotic index, abnormality index, cell kinetics index, in root meristems of Glycine max L. at control and varying concentrations of Mn were evaluated. The findings showed that Mn doses that were utilized for seed treatment caused distinct differences in chromosomal activity of Glycine max L. root tip cells, with a decreased mitotic index and cell kinetics, and an increased abnormality index. Treatment was conducted at room temperature for 24 hours, 48 hours, and 72 hours at four different concentrations of Mn: CN (Control), 5μM, 10μM, 15μM, and 20μM. The control group was treated with distilled water. The findings demonstrated that Mn has cytotoxic and genotoxic effects on Glycine max L. root tip cells.
Keywords: Manganese (Mn), Glycine max L, mitotic index, abnormality index, cell kinetics.
Contents
Analysis of cytotoxicity and genotoxicity
Effect of Mn on MI in Glycine max root tips
Effect of Mn on Abnormality Index, in Glycine max root tips
Effect of Mn on cell kinetics index in Glycine max root tips
Introduction
In many parts of the world, heavy metal contamination has an adverse effect on the biosphere, which is hazardous for environment. Metal contamination can come from a variety of sources, including mining, industry, agricultural chemicals, fuel, combustion byproducts, etc. (Siddiqui 2013; Siddiqui 2025a; Lee et al. 2024). Additionally, industrialization created industrial effluents that contained various pollutants, such as organic, inorganic, and radioactive trace elements, microbes, which might potentially contaminate soil (Siddiqui 2012; Siddiqui 2015; Chukwu et al. 2025). Heavy metals like Mn, Pb, Cd, Hg, and Ni are the most problematic worldwide pollutants. Industries release heavy metals and other pollutants into the environment, which are harmful to humans, animals, and plants. Although they are trace elements, these heavy metals are crucial to many physiological processes in living beings (Siddiqui et al. 2007; Siddiqui et al. 2009; Siddiqui et al. 2021; Hafeez et al. 2023; Espinola et al. 2025; Elik and Gül 2025). There is a significant qualitative difference between natural environmental changes seen in the past and those seen in the present, especially when considering the current overextended anthropogenic activity (Siddiqui 2018; Siddiqui and Suliman 2021). These days, neither humans nor other superior organisms have developed genetic defenses against anthropogenic pollutants, such as chemicals released by industry, some of which are xenobiotics – things that have never existed in nature (Üstündağ et al. 2023; Siddiqui 2025 b; Vieira et al. 2025).
Although Mn is a chemical element that is necessary for proper nutrition, it can also be hazardous under some circumstances. Scientists are still trying to comprehend the various effects of its toxicity and deficiency on living things. However, Mn is unquestionably extremely hazardous at high concentrations, leading to several diseases dependent on the production of reactive oxygen species (ROS) (Ertürk et al. 2021; Vijaya Kumar et al. 2025; Rao et al. 2025; Xia et al. 2025). Additionally, Mn may build up inside cell, leading to cytotoxicity and eventual cell death. Following alterations in gene expression and enzyme activity, Mn causes intracellular changes such as lipid peroxidation, chromosomal disintegration, and DNA helix breakage (Siddiqui and Al rumman 2020 a and b; Perfileva and Krutovsky 2024; Aseef and Venkatkumar 2025). The pathophysiology and toxicity of various diseases, including atherosclerosis, diabetes, chronic inflammatory diseases, neurological disorders, and cardiovascular diseases, have been linked to long-term oxidative stress in humans (Dorman 2023). Lactate dehydrogenase and lipid peroxidation, two cytotoxic measures, show that Mn causes oxidative stress in a time and concentration-dependent way (Jomova et al. 2025; Sobańska et al. 2021). Our study used cytogenetic analysis in Glycine max L. as a plant indicator for the degree of heavy metal pollution in crops to identify the mutagenic effects of Mn.
Methodology
Procurement of chemicals
Mn is supplied by Sigma-Aldrich (MERCK). Local distributor Bayouni sells Sigma-Aldrich (MERK) products in Saudi Arabia. Glycine max L (Fabaceae) seeds with 2n = 40 chromosomes, cultivar JS 335, were collected from Indian Ministry of Agriculture.
Plant material and treatment
For cytological examination, a homogeneous batch of Glycine max L (Fabaceae) seeds with 2n = 40 chromosomes, cultivar JS 335, were collected. Glycine max seeds were immersed in water overnight. The seeds were then treated with various concentrations of Mn (CN, 5μM, 10μM, 15μM, and 20μM) for 2 hours with CN serving as control with only distilled water. For root tip germination, the seeds were placed in a Petri dish lined with filter paper, covered, and incubated at 22-25 °C for 2-3 days. The root tips were properly cleaned with distilled water, then fixed in Carnoy’s fixative (1 glacial acetic acid: 3 ethanol) for 24 hours and stored in 90% alcohol.
Glycine max L. test
For germination, 30 Glycine max seeds were put in Petri Plates with 3 mL of each of the test solutions of Mn. The seeds were subjected to treatments in a germination chamber (Quimis) with regulated temperatures of 23±3 ºC every 96 hours. The size of the roots were measured using a digital calliper (Digmess), and the number of seeds that germinated were manually counted. The roots were subsequently gathered and preserved in Carnoy fixative. The microscope slides were prepared by Siddiqui et al. (2022 a), and they were stained for 1 hour and 30 minutes using Schiff’s reagent based on Feulgen method. Ten slides containing Glycine max. root meristems were made for each treatment, and 500 cells were counted from each slide, for a total of 5000 cells per treatment. The slides were examined using an optical microscope that had a 400x magnification.
Analysis of cytotoxicity and genotoxicity
For cytotoxicity analysis, MI and CKI were evaluated. The indices were calculated using the formulas described below:
Formula for calculating cell kinetics index (CKI)
For genotoxicity analysis, chromosomal abnormality index was evaluated. AI was calculated using the formulas described below:
Statistical analysis
A one-way ANOVA test was used to examine the significance of differences between variables using the GPIS 1.13 program (GRAPHPAD, California, USA). All results were presented as mean ± SE.
Result
Effect of Mn on MI in Glycine max root tips
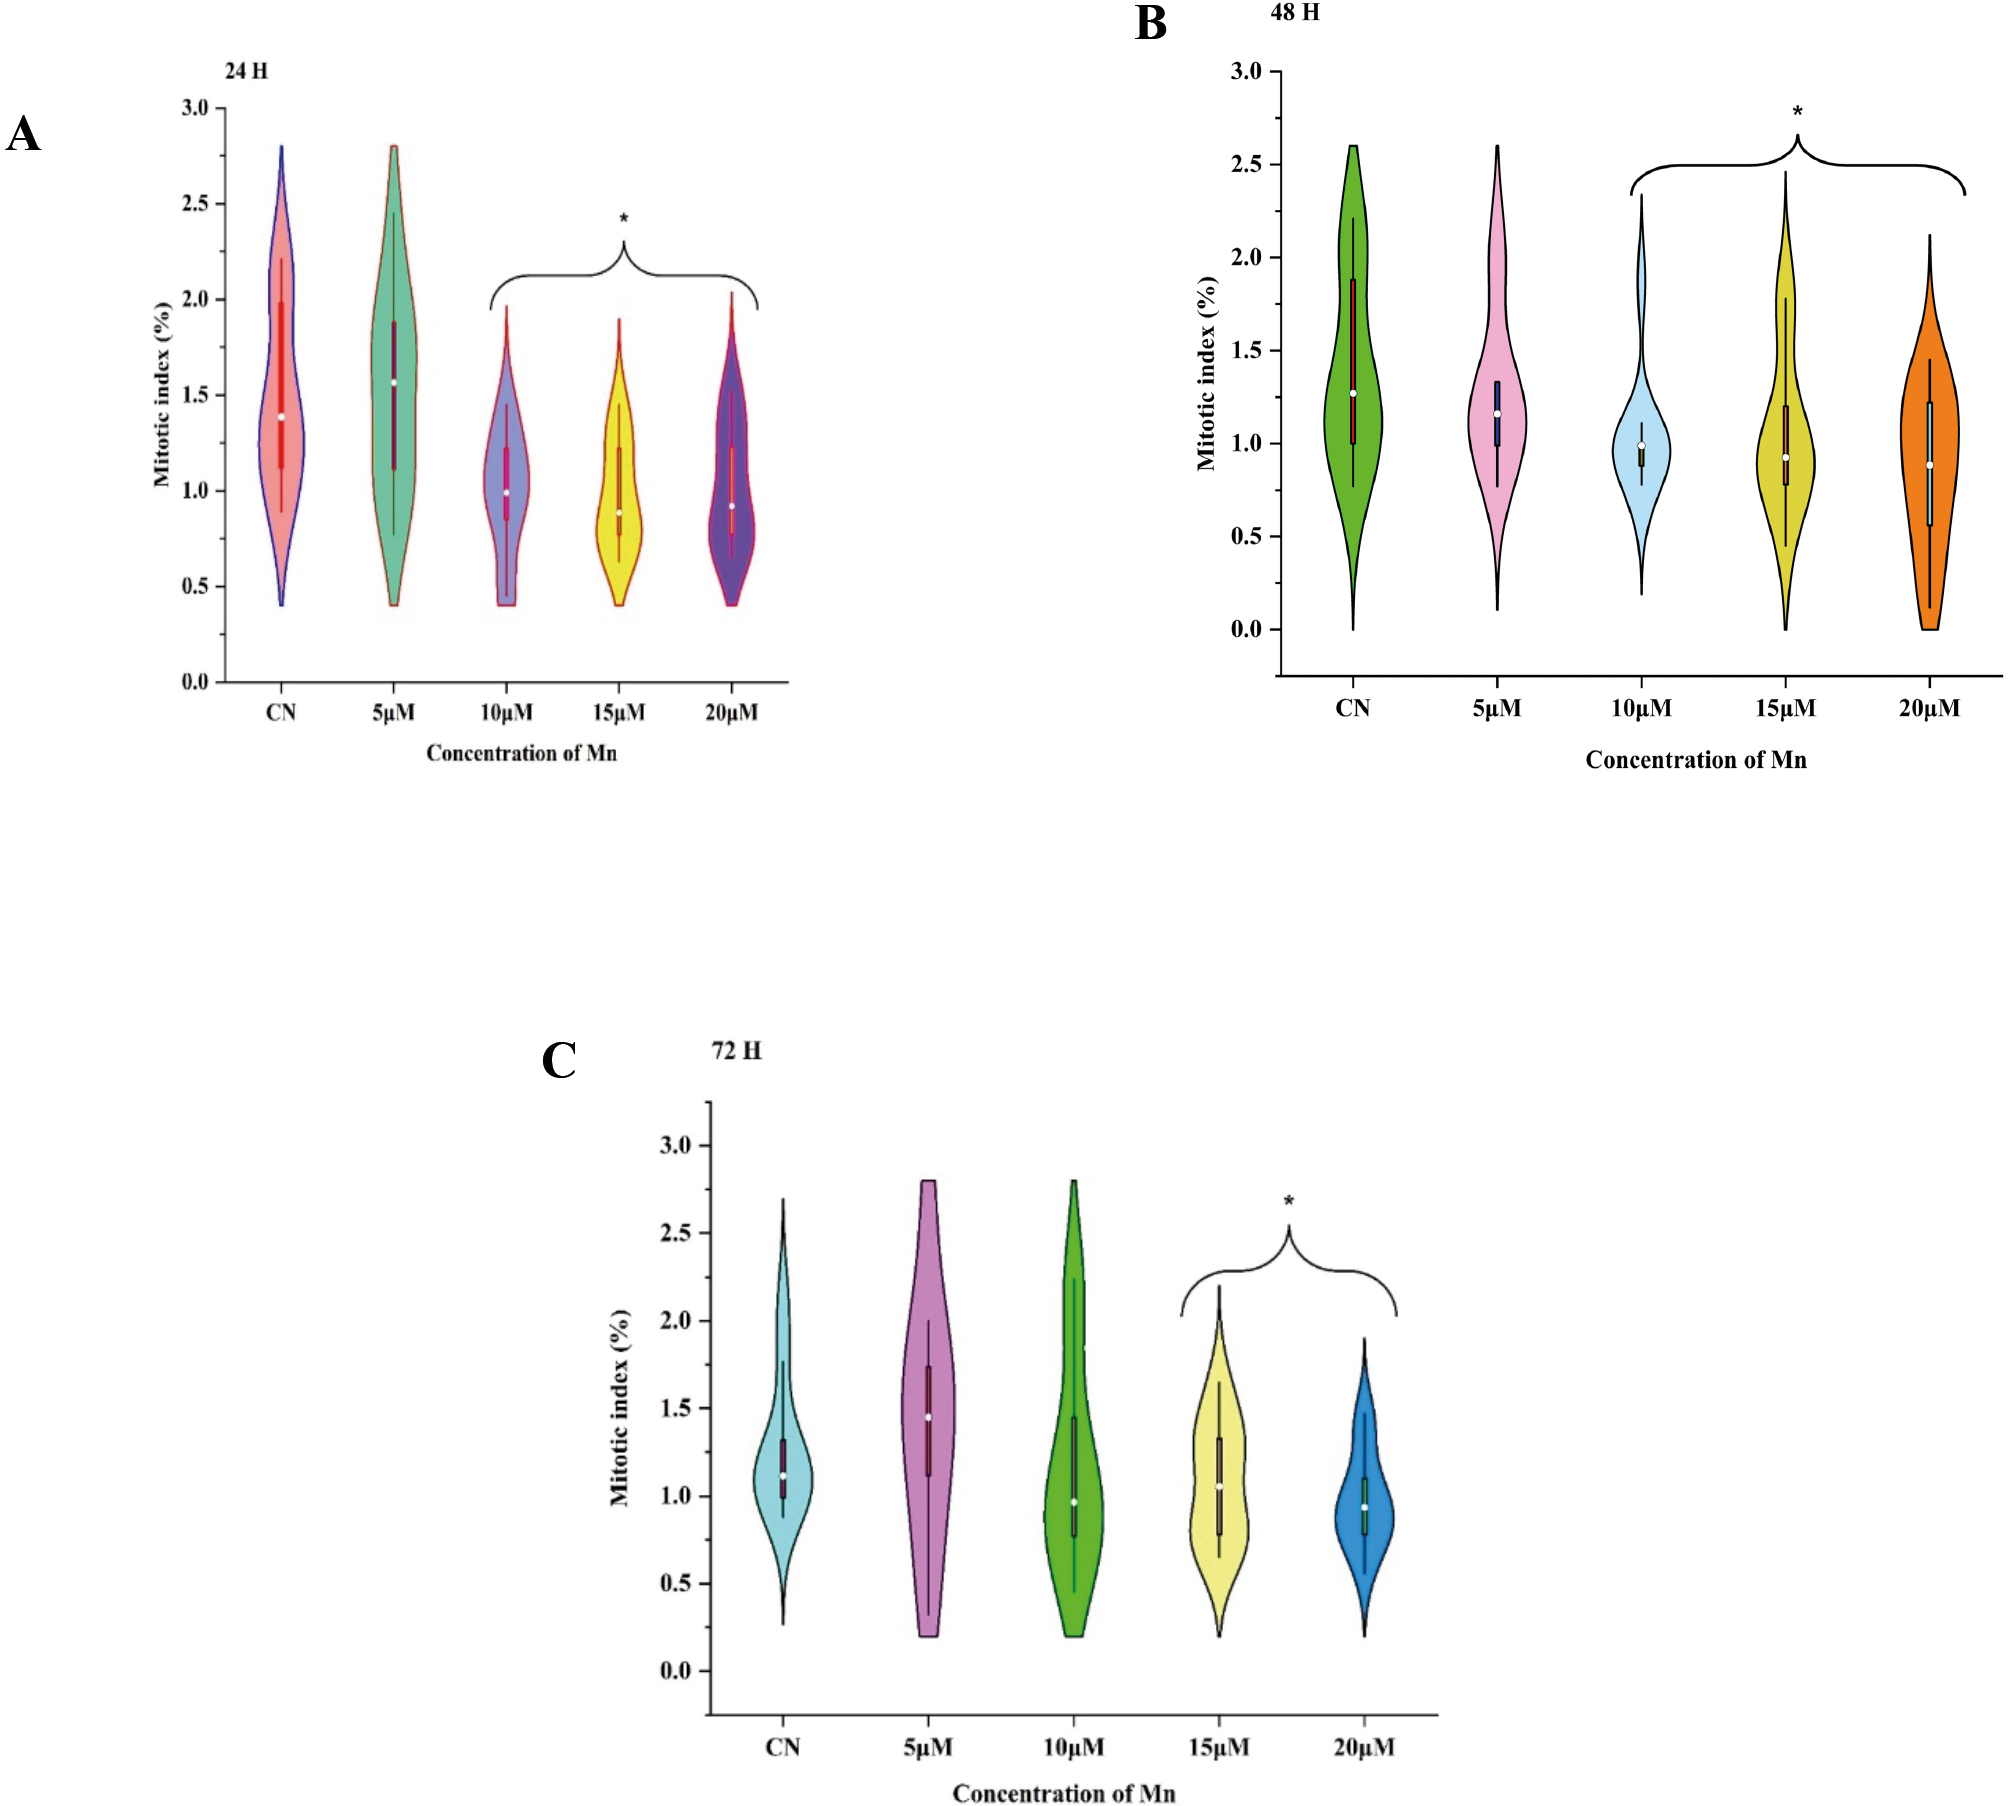
The control samples had the highest MI values, which reached 1.52% after 24 h (Figure 1 A), 1.35% after 48 h (Figure1 B), and 72 h (Figure 1 C). After Mn treatment for 24 h, MI decreased significantly (p<0.05) dose-dependently from 10 μM (1.01±0.10), 15 μM (0.98±0.10), and 20 μM (0.97±0.09) concentrations, with no significant difference (p>0.05) observed at 5 μM (1.48±0.15) concentration. After 48 h, MI decreased significantly (p<0.05) dose-dependently from 10 μM (1.02±0.10), 15 μM (1.05±0.13), and 20μM (0.87±0.13) concentrations, with no significant difference (p>0.05) observed at 5μM (1.28±0.13). Similarly, on Mn treatment for 72 h, MI decreased significantly (p<0.05) dose-dependently from 10 μM (1.17±0.22), 15 μM (1.07±0.11), and 20 μM (0.70±0.08) concentrations, with no significant difference (p>0.05) observed at 5 μM (1.25±0.22) as compared to control.
Effect of Mn on Abnormality Index, in Glycine max root tips
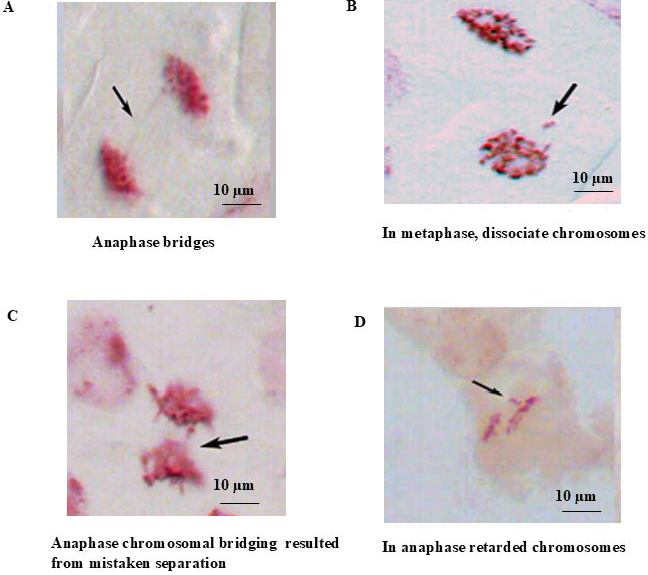
In our study, we found that AI, such as anaphase bridges, dissociated chromosomes in metaphase and anaphase, chromosomal bridging, were caused by incorrect separation and retarded chromosomes in anaphase (Figure 3). These were the most common abnormalities after treating root meristematic cells of Glycine max with Mn.
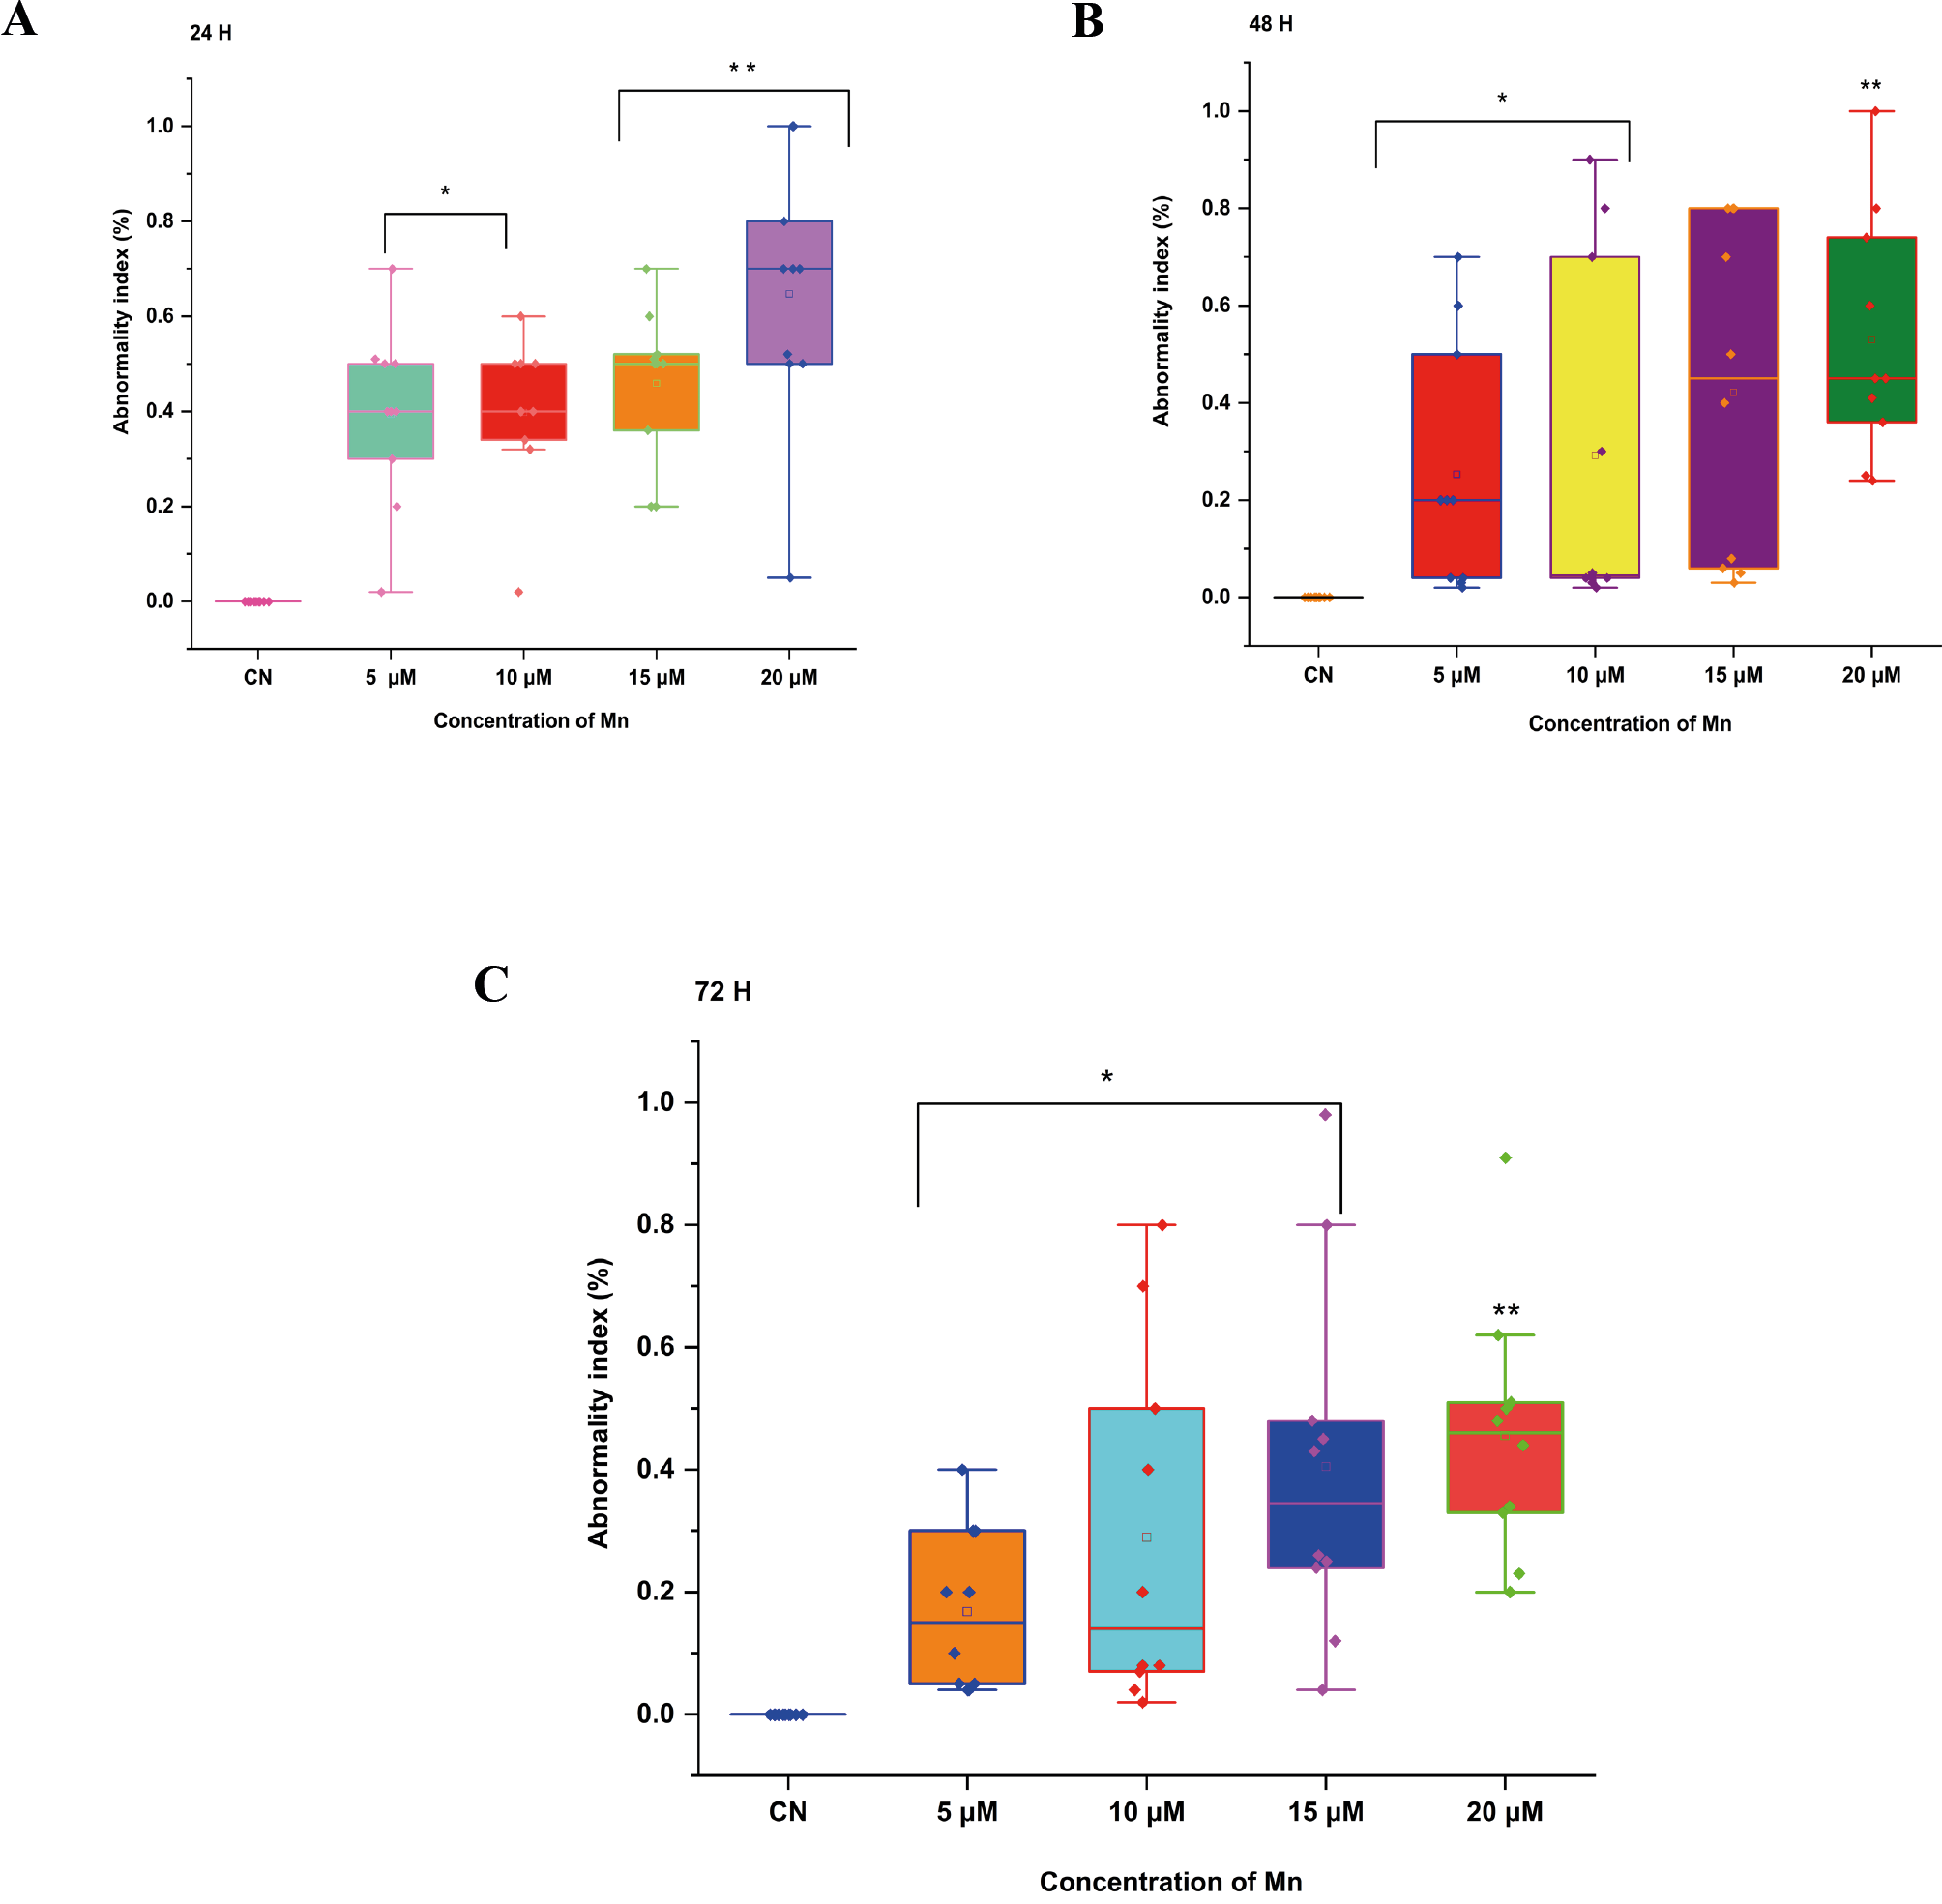
The control samples showed AI values of (0.0±0.0) at 24 h, 48 h, and 72 h. Following a 24 h Mn treatment, AI increased significantly (p<0.05) dose-dependently at 5 μM (0.39±0.059), 10 μM (0.40±0.049), 15 μM (0.46±0.050), and very significantly (p<0.01) at 20 μM (0.65±0.087) (Figure 2A). The AI increases significantly (p<0.05) from 5 μM (0.25±0.08), 10 μM (0.29±0.07), and very significantly (p<0.05) at 15 μM (0.42±0.06), and at 20 μM (0.53±0.07) dose-dependently following 48 h of Mn treatment (Figure 2B). AI increased significantly (P<0.05) dose-dependently from 5μM, which is (0.17±0.042), 10 μM (0.290.092), and 15 μM (0.410.093), and very significantly (p<0.01) at 20 μM (0.46±0.065) following 72 h of Mn treatment as compared to control (Figure 2C).
Effect of Mn on cell kinetics index in Glycine max root tips
Table 1 shows that Mn decreases CKI of Glycine max root tip cells in interphase, prophase, metaphase, anaphase, and telophase at 24 h, 48 h, and 72 h from 5 μM to 20 μM (Table 1). At 24 h of exposure to Mn, prophase (1.43±0.24), metaphase (0.83±0.06) and telophase (0.60±0.08) increased very significantly (p<0.01) in 5 μM. However, at 10 μM (0.15±0.02), there was a significant decrease (p<0.05) in telophase and at 15 μM (0.10±0.01 and 20 μM (0.13±0.01), there was a very significant decrease in telophase. Non-significant (p>0.05) decreases were reported in interphase and anaphase from 5 μM to 20 μM as compared to control.
| Conc. | FI | FP | FM | FA | FT | ||||||||||||||
|---|---|---|---|---|---|---|---|---|---|---|---|---|---|---|---|---|---|---|---|
| 24 h | |||||||||||||||||||
| CN | 10.19 ± 0.56 | 0.71±0.08 | 0.20 ± 0.03 | 0.28±0.06 | 0.33±0.03 | ||||||||||||||
| 5 μM | 10.30 ± 0.63 | 1.43±0.24** | 0.83 ± 0.06** | 0.45±0.07 | 0.60±0.08** | ||||||||||||||
| 10 μM | 9.10 ± 0.73 | 0.49±0.14 | 0.25 ± 0.07 | 0.16±0.02 | 0.15±.020* | ||||||||||||||
| 15 μM | 5.50 ± 0.17 | 0.55±0.17 | 0.15 ± 0.02 | 0.12±0.02 | 0.10±0.01** | ||||||||||||||
| 20 μM | 3.70 ± 0.12 | 0.37±0.13 | 0.15 ± 0.02 | 0.12±0.01 | 0.13±0.01** | ||||||||||||||
| 48 h | |||||||||||||||||||
| CN | 10.20±0.56 | 0.73±0.07 | 0.17±0.03 | 0.28±0.06 | 0.31±0.05 | ||||||||||||||
| 5 μM | 10.29±0.63 | 1.06±0.16 | 0.56±0.08** | 0.32±0.06 | 0.35±0.04 | ||||||||||||||
| 10 μM | 9.13±0.65 | 0.42±0.128 | 0.15±0.018 | 0.11±0.01* | 0.14±0.02** | ||||||||||||||
| 15 μM | 8.32±0.53 | 0.39±0.12 | 0.15±0.010 | 0.13±0.01* | 0.12±0.11** | ||||||||||||||
| 20 μM | 8.32±0.53 | 0.38±0.12 | 0.16±0.017 | 0.12±0.01* | 0.12±0.01** | ||||||||||||||
| 72 h | |||||||||||||||||||
| CN | 10.28±0.08 | 0.85±0.07 | 0.79±0.05 | 0.49±0.08 | 0.74± 0.05 | ||||||||||||||
| 5 μM | 9.49±0.71** | 0.37±0.74 | 0.45±0.06 | 0.21±0.03 | 0.24±0.04** | ||||||||||||||
| 10 μM | 8.24±0.04** | 0.69±0.26 | 0.141±0.02 | 0.31±0.13 | 0.31±0.14** | ||||||||||||||
| 15 μM | 8.78±0.43** | 0.79±0.26 | 0.15±0.03 | 0.41±0.13 | 0.41±0.14** | ||||||||||||||
| 20 μM | 7.80±0.84** | 0.39±0.13 | 1.23±0.12 | 0.11±0.01* | 0.11±0.03** | ||||||||||||||
| Where CN = control, FI (Frequency of interphase), FP (Frequency of prophase), FM (Frequency of metaphase), FA (Frequency of anaphase), and FT (Frequency of telophase). | |||||||||||||||||||
After 48 h, in prophase, metaphase, anaphase, and telophase, very significant (p<0.01) increase was reported at 5 μM. In the case of interphase and prophase, non-significant (p> 0.05) decreases were reported from 5 μM to 20 μM. But in the case of anaphase and telophase, there was a significant decrease (p<0.05) at 10 μM to 20 μM as compared to control. After 72 h of exposure to Mn, interphase and telophase were very significantly (p<0.01) decreased from 5 μM to 20 μM. However, at anaphase at 20 μM, significant (p<0.05) decrease was reported. But in the case of prophase and metaphase, there was a non-significant decrease (p> 0.05) from 5 μM to 20 μM as compared to control.
Pearson correlation coefficients between MI, AI, and CKI on Mn treatments with different time intervals
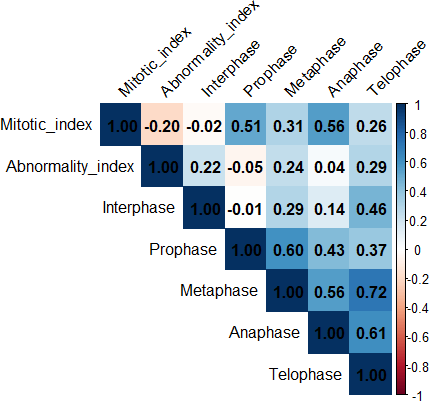
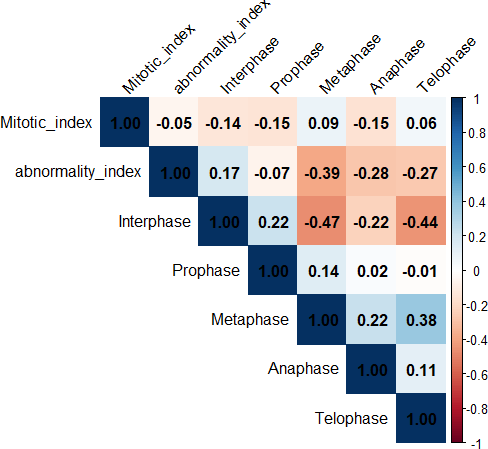
The heat map of Pearson correlation coefficients displays the correlation among measured MI, AI, and CKI in Figure 4 (24 h), Figure 5 (48 h) and Figure 6 (72 h). The blue and red squares signify positive and negative correlations, respectively. Negative correlations were reported between MI and AI (-0.020) after treatment of Mn for 24 h. A negative correlation was noticed in MI and interphase of CKI (-0.02). On the other hand, a strong positive correlation was noticed between MI and CKI (prophase (0.51), metaphase (0.31), anaphase (0.56), and telophase (0.26) (Figure 4). However, positive correlations were noticed between AI and different phases of CKI, interphase (0.22), metaphase (0.24), anaphase (0.04), and telophase (0.29) and a negative correlation in prophase (-0.05), after treatment of Mn for 24 h.
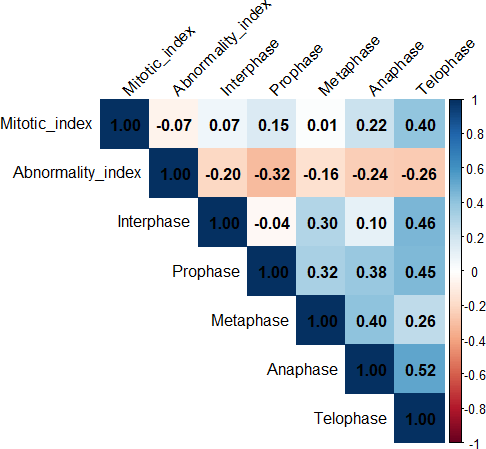
Negative correlations were reported between MI and AI (-0.07) after treatment of Mn for 48 h. On the other hand, a positive correlation was noticed between MI and phases of CKI (Interphase (0.07), prophase (0.15), metaphase (0.01), anaphase (0.22) and telophase (0.40) (Figure 5). However, negative correlations were reported between AI and different phases of CKI: interphase (-0.20), prophase (-0.32), metaphase (-0.16), anaphase (-0.24), and telophase (-0.26) after treatment of Mn for 48 h (Figure 5). These two parameters are negatively correlated with each other.
A negative correlation was reported between MI and AI (-0.05) after treatment of Mn for 72 h. On the other hand, negative and positive correlations were noticed between MI and phases of CKI: interphase (-0.14), prophase (-0.15), metaphase (0.09), anaphase (-0.15) and telophase (0.06) (Figure 6). A positive correlation was reported between AI and interphase (0.17) of CKI, and negative correlations were noticed in prophase (-0.07), metaphase (-0.39), anaphase (-0.28), and telophase (-0.27) after treatment of Mn for 72 h (Figure 6).
Discussion
On the basis of above data, it is obvious that Mn, a heavy metal, can cause cytotoxic and genotoxic effects on root tip cells of Glycine max. Findings indicate that when treatment dosages increase, the frequency of MI, CKI decreases and AI rises. It is practically obvious from this decrease in MI and increase in AI that Mn has a clastogenic impact on chromosomes at DNA level. However, excessive and negligent use of these heavy metals and agrochemicals often leads to their selective accumulation on agricultural fields topsoil layers (Mauser et al. 2025; Shahwar and Ansari 2022; Aslam and Aslam et al. 2021; Sarkar et al. 2022), which eventually reduces soil fertility. The rapid emergence of pathogen resistance to these agrochemicals lowers the effectiveness of pesticides and causes more harmful side effects. One of these consequences is the problem of eliminating insects that are beneficial to environment from the ecosystem (Fairoj et al. 2024; Yu et al. 2025).
MI is a crucial indicator for determining heavy metal’s potential for genotoxicity. Exposure to pesticides, heavy metals, and other chemical pollutants was linked to a decrease in MI in many plant species (Siddiqui and Al-Rumman, 2022a, b, and c; Siddiqui 2025 b). Chromatin abnormalities brought on by metal-DNA interaction or cell cycle delays result in decreased MI (Siddiqui 2023; Siddiqui 2024 a). Spindle-related chromosomal abnormality during cell division is also a result of primary mechanism of action of pesticides and heavy metals in mitosis (Firbas and Amon 2014). In this work, Mn demonstrated cytotoxicity by lowering MI dose-dependently. This implies that Mn causes mito-depression in Glycine max. Numerous investigations have demonstrated that differences in mitotic cycle’s duration may be the cause of decline in cell activity. A longer S phase has been associated by certain researchers with mitotic inhibition (Siddiqui 2024 ; Periakaruppan et al. 2023; Qian 2024). According to Das et al. (2023), heavy metals can enter DNA through nuclear pores or when the nuclear membrane splits into cells undergoing mitosis.
Aneugenic, tubergenic, and clastogenic effects are caused by the prevalence of these abnormalities (Siddiqui 2024 b; Siddiqui et al. 2012; Bonciu et al. 2018; Bonciu et al. 2022). They are caused by spindle apparatus disorders, abnormal metaphase, telophase, anaphase, and bridges, as well as chromosomal breakage (fragments, micronuclei) (Hossain et al.2022; Faizan M, et al. 2022). The rising occurrence of AI has resulted from suppression of DNA synthesis during S-phase (Tumer et al., 2022). In the current study, different types of AI, such as anaphase bridges, dissociated chromosomes in metaphase and anaphase, chromosomal bridging was caused by incorrect separation and retarded chromosomes in anaphase were reported in Glycine max after treatment with Mn. Based on the results of proportions of distribution of mitotic phases, Mn reduced the percentage of interphase, prophase, metaphase, anaphase, and telophase in all concentrations dose-dependently.
The results align with those of (Liman et al. 2022; Munir et al. 2021; Yu et al. 2025). The percentage of telophase stage was reduced as compared to control. These results imply that a decrease in cell development during mitosis or the stoppage of one or more mitotic stages may be the cause of decline in telophase stages and, thereafter, MI (Ping et al. 2012; Siddiqui 2018 a and b). The results suggest that a reduction in cell development and the arrest of one or more mitotic phases may be the source of a drop in the proportion of prophase, metaphase, anaphase, and telophase at all doses, and therefore MI (Siddiqui 2014; Siddiqui 2016; Sarac et al. 2019).
Conclusion
The cytotoxic and genotoxic properties of Mn, which is commonly added to our agricultural fields due to environmental pollution, can cause mutations in Glycine max. The above studies suggest that natural resources pollution, industrial effluents, and agricultural practices for comforts should be curtailed, as incidence of heavy metal increases soil pollution, resulting in grave cytogenetic effects in plants and higher organisms. Thus, mutagenesis data obtained from plant tests are critical for genetic studies aimed at maintaining a stable ecosystem.
Funding
The authors extend their appreciation to the Deanship of Research and Graduate Studies at King Khalid University for funding this work through the Large Group Project under grant number (RGP2/89/46).
References
Aseef A, Venkatkumar S. 2025. Staggering cytotoxic effects of manganese oxide nanoparticles from Bacillus thuringiensis. Microb. Pathog. 198:107184.
Aslam M, Aslam A, Sheraz M, Ali B, Ulhassan Z, Najeeb U, Zhou W, Gill RA. 2021. Lead toxicity in cereals: mechanistic insight into toxicity, mode of action, and management. Front. Plant Sci. 11:587785.
Bonciu E, Firbas P, Fontanetti CS, Wusheng J, Karaismailoğlu MC, Liu D, Menicucci F, Pesnya DS, Popescu A, Romanovsky AV, Schiff S, Ślusarczyk J, de Souza CP, Srivastava A, Sutan A, Papini A. 2018. An evaluation for the standardization of the Allium cepa test as cytotoxicity and genotoxicity assay. Caryologia. 71(3): 191-209
Bonciu E, Paraschivu M, Șuțan NA, Olaru AL. 2022. Cytotoxicity of sunset yellow and brilliant blue food dyes in a plant test system. Caryologia. 75(2):143-9.
Chukwu EC, Gulser C. 2025. Morphological, physiological, and anatomical effects of heavy metals on soil and plant health and possible remediation technologies. Soil Sec. 100178.
Das D, Bisht K, Chauhan A, Gautam S, Jaiswal JP, Salvi P, Lohani P. 2023. Morpho-physiological and Biochemical responses in wheat foliar sprayed with zinc-chitosan-salicylic acid nanoparticles during drought stress. Plant Nano Biol. 4:100034.
Dorman DC. 2023. The role of oxidative stress in manganese neurotoxicity: a literature review focused on contributions made by Professor Michael Aschner. Biomolecules. 13(8), p.1176.
Elik Ü, Gül Z. 2025. Accumulation potential of lead and cadmium metals in maize (Zea mays L.) and effects on physiological-morphological characteristics. Life. 15(2):310.
Ertürk FA, Sunar S. 2021. Determination of cytogenetic and epigenetic effects of manganese and copper on Zea mays L. ISPEC J. Agric. Sci. 5(3):529-43.
Espinola EC, Cabreros MM, Redillas MC. 2025. Morpho-Physiological Adaptations of Rice Cultivars Under Heavy Metal Stress: A Systematic Review and Meta-Analysis. Life. 15(2):189.
Fairoj SA, Ghosh UK, Islam MM, Jahan K, Siddiqui S, Alshaharani MO, Siddiqua A, Yassin HM.2024. Amelioration strategy of saline stress in wheat with salicylic acid: a review. Caryologia. 77(3):11-25.
Faizan M, Bhat JA, El-Serehy HA, Moustakas M, Ahmad P. 2022. Magnesium oxide nanoparticles (MgO-NPs) alleviate arsenic toxicity in soybean by modulating photosynthetic function, nutrient uptake and antioxidant potential. Metals. 12(12):2030.
Firbas P, Amon T. 2014. Chromosome damage studies in the onion plant Allium cepa L. Caryologia. 67(1): 25-35
Hafeez A, Rasheed R, Ashraf MA, Qureshi FF, Hussain I, Iqbal M. 2023 Effect of heavy metals on growth, physiological and biochemical responses of plants. In Plants and their interaction to environmental pollution. (pp. 139-159). Elsevier.
Hossain J, Azam MG, Gaber A, Aftab T, Hossain A. 2022. Cytotoxicity of metal/metalloids’ pollution in plants. In Metals Metalloids, Soil Plant Water Systems. 371-394. Academic Press.
Jomova K, Alomar SY, Valko R, Nepovimova E, Kuca K, Valko M. 2025. The role of redox-active iron, copper, manganese, and redox-inactive zinc in toxicity, oxidative stress, and human diseases. EXCLI Journal. 24:880-954.
Lee SY, Lee YY, Cho KS. 2024. Inoculation effect of heavy metal-tolerant and plant growth-promoting rhizobacteria for rhizoremediation. Int. J. Environ. Sci. Technol. (2):1419-34.
Liman R, Ali MM, Istifli ES, Ciğerci İH, Bonciu E. 2022. Genotoxic and cytotoxic effects of pethoxamid herbicide on Allium cepa cells and its molecular docking studies to unravel genotoxicity mechanism. Environ. Sci. Pollut. Res. 29: 63127–63140.
Mauser KM, Wolfram J, Spaak JW, Honert C, Brühl CA. 2025. Current-use pesticides in vegetation, topsoil and water reveal contaminated landscapes of the Upper Rhine Valley, Germany. Commun. Earth Environ. 6(1):166.
Munir N, Jahangeer M, Bouyahya A, El Omari N, Ghchime R, Balahbib A, Aboulaghras S, Mahmood Z, Akram M, Ali Shah SM, Mikolaychik IN. 2021. Heavy metal contamination of natural foods is a serious health issue: A review. Sustainability. 14(1):161.
Perfileva AI, Krutovsky KV. 2024. Manganese nanoparticles: synthesis, mechanisms of influence on plant resistance to stress, and prospects for application in agricultural chemistry. J. Agric. Food Chem. 72(14):7564-85.
Periakaruppan R, Vanathi P, Priyanka G, Vidhya D. 2023. Toxicity in plants by metal oxide nanoparticles. In Nanometal Oxides in Horticulture and Agronomy; Academic Press: Cambridge, MA, USA, 2023; pp. 241–273.
Ping KY, Darah I, Yusuf UK, Yeng C, Sasidharan S. 2012. Genotoxicity of Euphorbia hirta: an Allium cepa assay. Molecules. 17(7):7782–7791.
Qian YA, Haipeng LI, Yinghao LI, Helian LI. 2024. Wheat morphological and biochemical responses to copper oxide nanoparticles in two soils. Pedosphere. 34(4):814-25.
Rao MJ, Duan M, Zhou C, Jiao J, Cheng P, Yang L, Wei W, Shen Q, Ji P, Yang Y, Conteh O. 2025. Antioxidant defense system in plants: Reactive oxygen species production, signaling, and scavenging during abiotic stress-induced oxidative damage. Horticulturae. 11(5):477.
Sarac I, Bonciu E, Butnariu M, Petrescu I, Madosa E. 2019. Evaluation of the cytotoxic and genotoxic potential of some heavy metals by use of Allium test. Caryologia. 72(2):37-43.
Sarkar AK, Saha R, Halder R. 2022. Chromosomes damage by sewage water studies in the Allium cepa L. and Zea mays L. Caryologia. 75(1):55-63.
Shahwar D, Khan Z, Ansari MY. 2022. Cadmium induced genotoxicity and antioxidative defense system in lentil (Lens culinaris Medik.) genotype. Caryologia. 75(3):47-64.
Siddiqui S, Al Amri SAM, Al Ghamdy HA, Alqahtani WSS, Alquyr SM, Yassin HM. 2021. Impact of Bisphenol A on seed germination, radicle length and cytogenetic alterations in Pisum sativum L. Caryologia. 74(2): 103–109.
Siddiqui S, Alamri S, Al-Rumman S, Moustafa M. 2018. Allelopathic and cytotoxic effects of medicinal plants on vegetable crop pea (Pisum sativum). Cytologia.83(3):277-82.
Siddiqui S, Al-Rumman S. 2020a. Clethodim induced pollen sterility and meiotic abnormalities in vegetable crop Pisum sativum L. Caryologia. 73: 37–44.
Siddiqui S, Al-Rumman S. 2020b. Cytological changes induced by clethodim in Pisum sativum plant. Bangladesh J. Bot. 49(2):367–374.
Siddiqui S, Al-Rumman S. 2022a. Methomyl, imbraclaobrid and clethodim induced cytomixis and syncytes behaviors in PMCs of Pisum sativum L: Causes and outcomes. Saudi J Biol Sci. 29(9):103390.
Siddiqui S, Al-Rumman S. 2022b. Exposure of Pisum sativum L. seeds to methomyl and imidacloprid cause genotoxic effects in pollen-mother cells. Biology. 11: 1549.
Siddiqui S, Al-Rumman S. 2022c. Methomyl has clastogenic and aneugenic effects and alters the mitotic kinetics in Pisum sativum L. Caryologia. 75(3): 91–99.
Siddiqui S, Meghvansi MK, Hasan Z. 2007. Cytogenetic changes induced by sodium azide (NaN3) on Trigonella foenum-graecum L. seeds. S. Afr. J. Bot. 73(4):632–5.
Siddiqui S, Meghvansi MK, Khan SS. 2012. Glyphosate, alachor and maleic hydrazide have genotoxic effect on Trigonella foenum-graecum L. Bull. Environ. Contam. Toxicol. 88(5):659-65.
Siddiqui S, Meghvansi MK, Wani MA, Jabee F. 2009. Evaluating cadmium toxicity in the root meristem of Pisum sativum L. Acta Physiol. Plant. 31:531-6.
Siddiqui S, Sulaiman AA. 2021. Influence of nanoparticles on food: An analytical assessment. Journal of King Saud University-Science, 33;(6):101530.
Siddiqui S. 2012. Lead-induced genotoxicity in Vigna mungo var. HD-94. J. Saudi Soc. Agric. Sci. 11(2):107–12.
Siddiqui S. 2013. Exposure of Cu and Mn to Cicer arietinum L. Var. BGD-72 seeds induces morphological and biochemical changes in the plant. South Asian J. Exp. Biol. 3 (1): 31‐36.
Siddiqui S. 2015. DNA damage in Cicer plant grown on soil polluted with heavy metals. J. King Saud Univ. Sci. 27(3):217–23.
Siddiqui S. 2018. Cytotoxicity induced by aluminum sulfate in cells of root meristem of Pisum sativum cv. arikil. Bangl. J. Bot. 1:47:219.
Siddiqui S. 2023. Phenthoate toxicity evaluation in root meristem of Pisum sativum L. Caryologia. 76(1):57–66.
Siddiqui S. 2024 a. DNA Damage, cell death, and alteration of cell proliferation insights caused by copper oxide nanoparticles using a plant-based model. Biology. 13(10): 805.
Siddiqui S. 2025a. Global patterns and drivers of species and genera richness of Fabaceae. Front. Plant Sci. 16:1581814.
Siddiqui S. 2025 b. Unlocking the environmental potential of biochar: production, applications, and limitations. Frontiers in Sustainable Food Systems. 9:1569941.
Siddiqui S. 2024b. Effects of cypermethrin on morphological, physiological, and biochemical attributes of Cicer arietinum (Fabales: Fabaceae). Front. Sustain. Food Syst. 8: 1446308.
Siddiqui S. 2014. Genotoxic effect of four medicinal plant extracts on Pisum sativum cv. Arikil. Bangl. J. Bot. 43(1): 107-111.
Siddiqui S. 2016. Inhibitory effects of leaf extracts on morphology of Pisum sativum cv. Arikil. Bangl. J. Bot. 45(1): pp.243-246.
Sobańska Z, Roszak J, Kowalczyk K, Stępnik M. 2021. Applications and biological activity of nanoparticles of manganese and manganese oxides in in vitro and in vivo models. Nanomaterials. 11(5):1084.
Tümer C, Çavuşoğlu K. and Yalcin E. 2022. Screening the toxicity profile and genotoxicity mechanism of excess manganese confirmed by spectral shift. Scientific Reports, 12(1):.20986.
Üstündağ Ü, Macar O, Kalefetoğlu Macar T, Yalçın E, Çavuşoğlu K. 2023. Effect of Melissa officinalis L. leaf extract on manganese-induced cyto-genotoxicity on Allium cepa L. Sci. Rep. 13(1):22110.
Vieira IT, Nascimento AL, Sampaio RA, Pegoraro RF. 2025. Vermicompost from sewage sludge: effects on heavy metal presence in soil and bioaccumulation in castor bean. Int. J. Environ. Sci. Technol. 1-4.
Vijaya Kumar M, Prasad Raju H. 2025. Heavy Metals in the Environment: Sources, Fate, and Health Implications. In-Groundwater Resource Management Planning Strategies: A Geospatial Approach: Volume 1 2025 Jun 17 (pp. 135-153). Cham: Springer Nature Switzerland.
Xia Z, Xue C, Liu R, Hui Q, Hu B, Rennenberg H. 2025. Lead accumulation and concomitant reactive oxygen species (ROS) scavenging in Robinia pseudoacacia are dependent on nitrogen nutrition. Plant Physiol. Biochem. 219:109388.
Yu JA, Chen Z, Gao W, He S, Xiao D, Fan W, Huo M, Nugroho WA. 2025. Global trends and prospects in research on heavy metal pollution at contaminated sites. J. Environ. Manag. 1;383:125402.