Received: October 4, 2025; Accepted: December 28, 2025; Published: Month 11, 2026
Genome size and cytogenetic features of the critically endangered Glehnia littoralis F. Schmidt ex Miq. (Apiaceae): Implications for conservation and future genomic research
Jiangsu Key Laboratory for Conservation and Utilization of Plant Resources, Institute of Botany, Jiangsu Province and Chinese Academy of Sciences (Nanjing Botanical Garden Mem. Sun Yat-Sen), Nanjing 210014, Jiangsu, China
*Corresponding author. E-mail: cfsong79@cnbg.net
#These authors contributed equally to this work
Abstract. Glehnia littoralis, a critically endangered coastal plant endemic to sandy beach habitats, plays a unique role in the ecology of fragile coastal ecosystems. Its genome was characterized using an integrated approach combining flow cytometry, high-throughput sequencing, k-mer analysis, Smudgeplot, and cytogenetic validation. Flow cytometry estimated the genome size at ~2,913 Mb, while k-mer analysis under a diploid model (p = 2) revealed low heterozygosity (1.15%) and a high repeat content (80.87%), reflecting a relatively homogeneous yet highly repetitive genome shaped by historical whole-genome duplication events and transposon expansion. Smudgeplot patterns and cytogenetic analysis further confirmed the diploid status (2n = 22, x = 11) with a karyotype of 2n = 2x = 18m + 4sm (type 2A). These findings not only illuminate the evolutionary history and genomic architecture of this rare Apiaceae species but also offer critical insights into its adaptation to extreme coastal environments, providing valuable information for conservation strategies aimed at preserving this highly vulnerable, ecologically significant plant.
Keywords: Glehnia littoralis, genome size, flow cytometry, K-mer analysis, Ploidy.
Contents
2.2. Chromosome karyotype analysis
2.4. K-mer analysis and heterozygosity estimation
3.1. Genome size and ploidy identification analysis of G. littoralis by flow cytometry
3.2. Quality assessment of G. littoralis sequencing
3.3. Genome size estimation based on K-mer analysis
1. Introduction
Glehnia F. Schmidt ex Miq. is a monotypic genus in the family Apiaceae, notable for its unique ecological and evolutionary significance. A single species, Glehnia littoralis F. Schmidt ex Miq., is currently comprised (Shan & She, 1979). Traditionally, the genus has been placed in the subfamily Apioideae, tribe Peucedaneae Dumort., subtribe Angelicinae Drude. There are eight genera in the subtribe Angeliceae in China, namely Angelica L., Archangelica Hoffm., Czernaevia Turcz., Ostericum Hoffm., Coelopleurum Ledeb., Conioselinum Fisch. ex Hoffm., Levisticum Hill (cultivated), and Glehnia. However, recent molecular phylogenetic studies have reassigned it to the tribe Selineae Spreng., where it is closely related to genera such as Angelica L., Archangelica Wolf., Melanosciadium de Boiss. and Cnidium Cusson (Wen et al. 2021).
G. littoralis is distributed along the coastal sandy beaches of the North Pacific, including East Asia and North America. In China, it mainly grows along the coasts of the Yellow Sea and Bohai Sea, including the Liaodong Peninsula, Qinhuangdao in Hebei, Shandong Peninsula, the Zhoushan Archipelago in Zhejiang, Lianjiang, Mawei, and Changle in Fujian, Taiwan, as well as in Russia, Korea, Japan, and North America. G. littoralis was once recorded in Jiangsu (Ganyu and Lianyungang), Guangdong (Shenzhen), and Hainan (Wanning and Wenchang), China (Shan & She, 1979). However, based on the author’s previous investigations, these populations are now extinct, primarily due to super typhoons and human-induced disturbances.
As a key species in the East Asia–North America coastal ecosystem, G. littoralis was recognized for its important ecological functions. Its well-developed root system was considered effective in stabilizing sand and preventing coastal erosion. G. littoralis was also widely utilized as a medicinal and edible herb; its roots, known as “Bei Sha Shen” in traditional Chinese medicine, were commonly used as an antitussive and expectorant. The species experienced a sharp decline in the wild, primarily due to its narrow ecological niche, destruction of dune vegetation, habitat loss, and excessive harvesting (Yang et al., 2011; Zhang et al., 2022). It was subsequently classified as a Class II National Key Protected Plant in China and assessed as Critically Endangered (CR) according to national conservation criteria (Fu, 1992; Ministry of Environmental Protection & Chinese Academy of Sciences, 2013; National Key Protected Wild Plants List, 2021).
From the perspective of genetic resource conservation, the endangered status of G. littoralis not only threatened the survival of its populations but also posed the risk of permanently losing its unique genetic information, resulting in irreversible biodiversity loss. As a typical halophyte, G. littoralis exhibited strong salt and drought tolerance, yet its underlying molecular mechanisms had not been systematically elucidated.
Although the genomes of several Apiaceae species such as Daucus carota L., Apium graveolens L., Angelica sinensis (Oliv.) Diels, Coriandrum sativum L., and Oenanthe javanica (Blume) DC. had been sequenced, genomic information for the genus Glehnia remained completely lacking ( Li et al. 2020; Song et al. 2020; Liu et al. 2021; Han et al. 2022; Wang et al. 2023). This limited our understanding of its environmental adaptation and evolutionary mechanisms, the biosynthetic pathways of characteristic secondary metabolites (e.g., coumarins and polyacetylenes), and the causes of its endangered status. Therefore, conducting genome sequencing research on G. littoralis was expected to provide critical data support for conservation genetics, comparative genomics, and functional gene discovery.
In this study, karyotype analysis, flow cytometry and genome survey sequencing were carried out to investigate the basic genomic characteristics of G. littoralis. Similar approaches have been applied in other angiosperm groups, providing valuable comparative insights (Loureiro et al., 2023; David et al., 2024; Radmanesh and Karimzadeh, 2025). As a result, the chromosome number and karyotype were determined, and the genome size, heterozygosity level, and proportion of repetitive sequences were estimated. These findings provided essential data for understanding the genome structure and complexity of G. littoralis.
2. Materials and methods
2.1. Plant materials
Samples of G. littoralis used in this study were collected from Yusha Bay Park, Hui’an County, Quanzhou City, Fujian Province (27°52′19″N, 118°47′46″E).
2.2. Chromosome karyotype analysis
Seedlings of G. littoralis were excavated and transplanted to the experimental nursery of Institute of Botany, Jiangsu province and Chinese Academy of Sciences. Actively growing root tips approximately 1 cm in length were excised and pretreated at room temperature for 3.5 hours in a 1:1 (v/v) mixture of 0.1% (w/v) colchicine and 0.002 mol·L⁻¹ 8-hydroxyquinoline. The pretreated root tips were then rinsed three times with distilled water and fixed in Carnoy’s solution [absolute ethanol: glacial acetic acid = 3:1 (v/v)] at 4 °C for 6 hours. After fixation, the samples were rinsed again three times with distilled water and macerated in a 1:1 (v/v) mixture of 1 mol·L⁻¹ hydrochloric acid and 45% glacial acetic acid in a 37 °C water bath for 45 minutes. Following maceration, the root tips were washed three more times with distilled water, stained with modified carbol fuchsin for 4 hours, and squashed using the conventional squash method (Zhu, 1982).
Chromosomes were observed under a Nikon ECLIPSE Ci-S biological microscope (Nikon Corporation, Japan) and photographed using a Nikon Ds-Fi2 digital imaging system (Nikon Corporation, Japan). For each specimen, at least two root tips were used, and 5 to 10 well-scattered metaphase cells with clearly visible chromosomes were selected for observation, counting, and imaging. Chromosome classification and karyotype analysis were conducted following the standards of Levan et al. (Levan et al., 1964) and Stebbins (Stebbins, 1971) and the asymmetry index was calculated according to the method of Zarco (Zarco, 1986).
2.3. Flow cytometry analysis
Three replicates of fresh, tender leaves (approximately 0.2 g each) from plants were weighed and placed in Petri dishes (Mumbrú et al., 2025). A volume of 500 μL nuclear lysis buffer was added around each sample (Sysmex Partec, Germany). The leaves were then finely and quickly chopped using a sharp razor blade in a vertical motion to fully release intact nuclei, with an extraction time of 60 seconds. The resulting suspension was filtered through a 50 μm mesh into a sample tube. Subsequently, 2000 μL of fluorescent staining solution containing RNase was added to the sample tube, and the mixture was incubated in the dark for 15 minutes. The stained nuclei suspension was then analyzed using a flow cytometer.
An internal reference method was used for genome size estimation via flow cytometry. Prior to measurement, the CyFlow Cube6 flow cytometer (Sysmex Partec GmbH, Germany) was pre-warmed for 30 minutes (Zhang et al., 2025). During the assay, nuclear suspensions of tomato (Solanum lycopersicum L.), used as the internal standard, and G. littoralis were analyzed separately to preliminarily determine their respective fluorescence intensity ranges (Sun et al., 2021). A 488 nm blue laser was used for excitation, and fluorescence was collected via the FL2 channel. Since propidium iodide (PI) binds stoichiometrically to double-stranded DNA, the fluorescence intensity is directly proportional to the DNA content of the nuclei. For each test sample, at least 10,000 particles were collected at low flow rate during analysis (Doležel et al., 2007; Gong et al., 2011).
The known genome size of the internal standard tomato is 827 Mb. The genome size of the sample was calculated using the following formula: Genome size (Mb) = (Fluorescence intensity of sample / Fluorescence intensity of standard) × 827 (Doležel et al., 2005).
2.4. K-mer analysis and heterozygosity estimation
Genomic DNA was extracted from fresh, tender leaves using a modified CTAB protocol. DNA quality was initially assessed by agarose gel electrophoresis to ensure high integrity. DNA concentration and purity were subsequently determined using a NanoDrop Lite spectrophotometer (Thermo Fisher Scientific, Waltham, USA). High-quality DNA samples were fragmented randomly using a Covaris ultrasonic disruptor. Standard library construction procedures were followed, including end repair, A-tailing, adapter ligation, purification, and PCR amplification. The constructed libraries were first quantified using the Qubit 3.0 Fluorometer. After gradient dilution, insert size distribution was analyzed using the Agilent 2100 Bioanalyzer. Quantitative PCR was used to accurately determine the effective concentration of the libraries, ensuring they met the quality standards required for Illumina sequencing platforms.
Upon passing quality control, the libraries were sequenced using the DNBSEQ-T7 platform. Raw sequencing data underwent quality control filtering to remove adapter contamination, low-quality reads, and PCR duplicates, resulting in clean data suitable for further analysis (Cock et al., 2010).
High-quality Illumina short-read sequencing data were used for whole-genome characterization of G. littoralis via K-mer frequency analysis. Based on K-mer analysis principles, the heterozygosity rate was estimated from the ratio of the heterozygous to homozygous peak heights. The proportion of repetitive sequences was inferred from the area difference between the ideal Poisson distribution and the actual data curve beyond the main peak (Marcais et al., 2011; Liu et al., 2013).
For this analysis, the optimal K-mer size was set to k=19. K-mer counting and depth distribution were performed using Jellyfish (version 2.2.10), and genome size and heterozygosity were estimated using GenomeScope (version 2.0) (Vurture et al., 2017). GenomeScope fitting was performed under ploidy assumptions of p = 2 (diploid) and p = 4 (tetraploid), with an appropriate maximum coverage cutoff applied to minimize the influence of sequencing errors and extremely high-frequency k-mers. The following parameters were recorded: haploid genome size, heterozygosity, proportions of unique and repetitive sequences, model fit (R²), and confidence intervals. The final genome size estimation was based on K-mer depth distribution and the following formula: Genome size = (Total number of K-mers) / (Peak K-mer depth).
To infer genome ploidy, we applied Smudgeplot analysis. The resulting joint k-mer spectrum was analyzed in Smudgeplot, which visualizes the distribution of heterozygous k-mer pairs (e.g., AA, AB, AAB, AABB) to infer the most likely ploidy level of the genome (Ranallo-Benavidez, 2020).
3. Results
3.1. Genome size and ploidy identification analysis of G. littoralis by flow cytometry
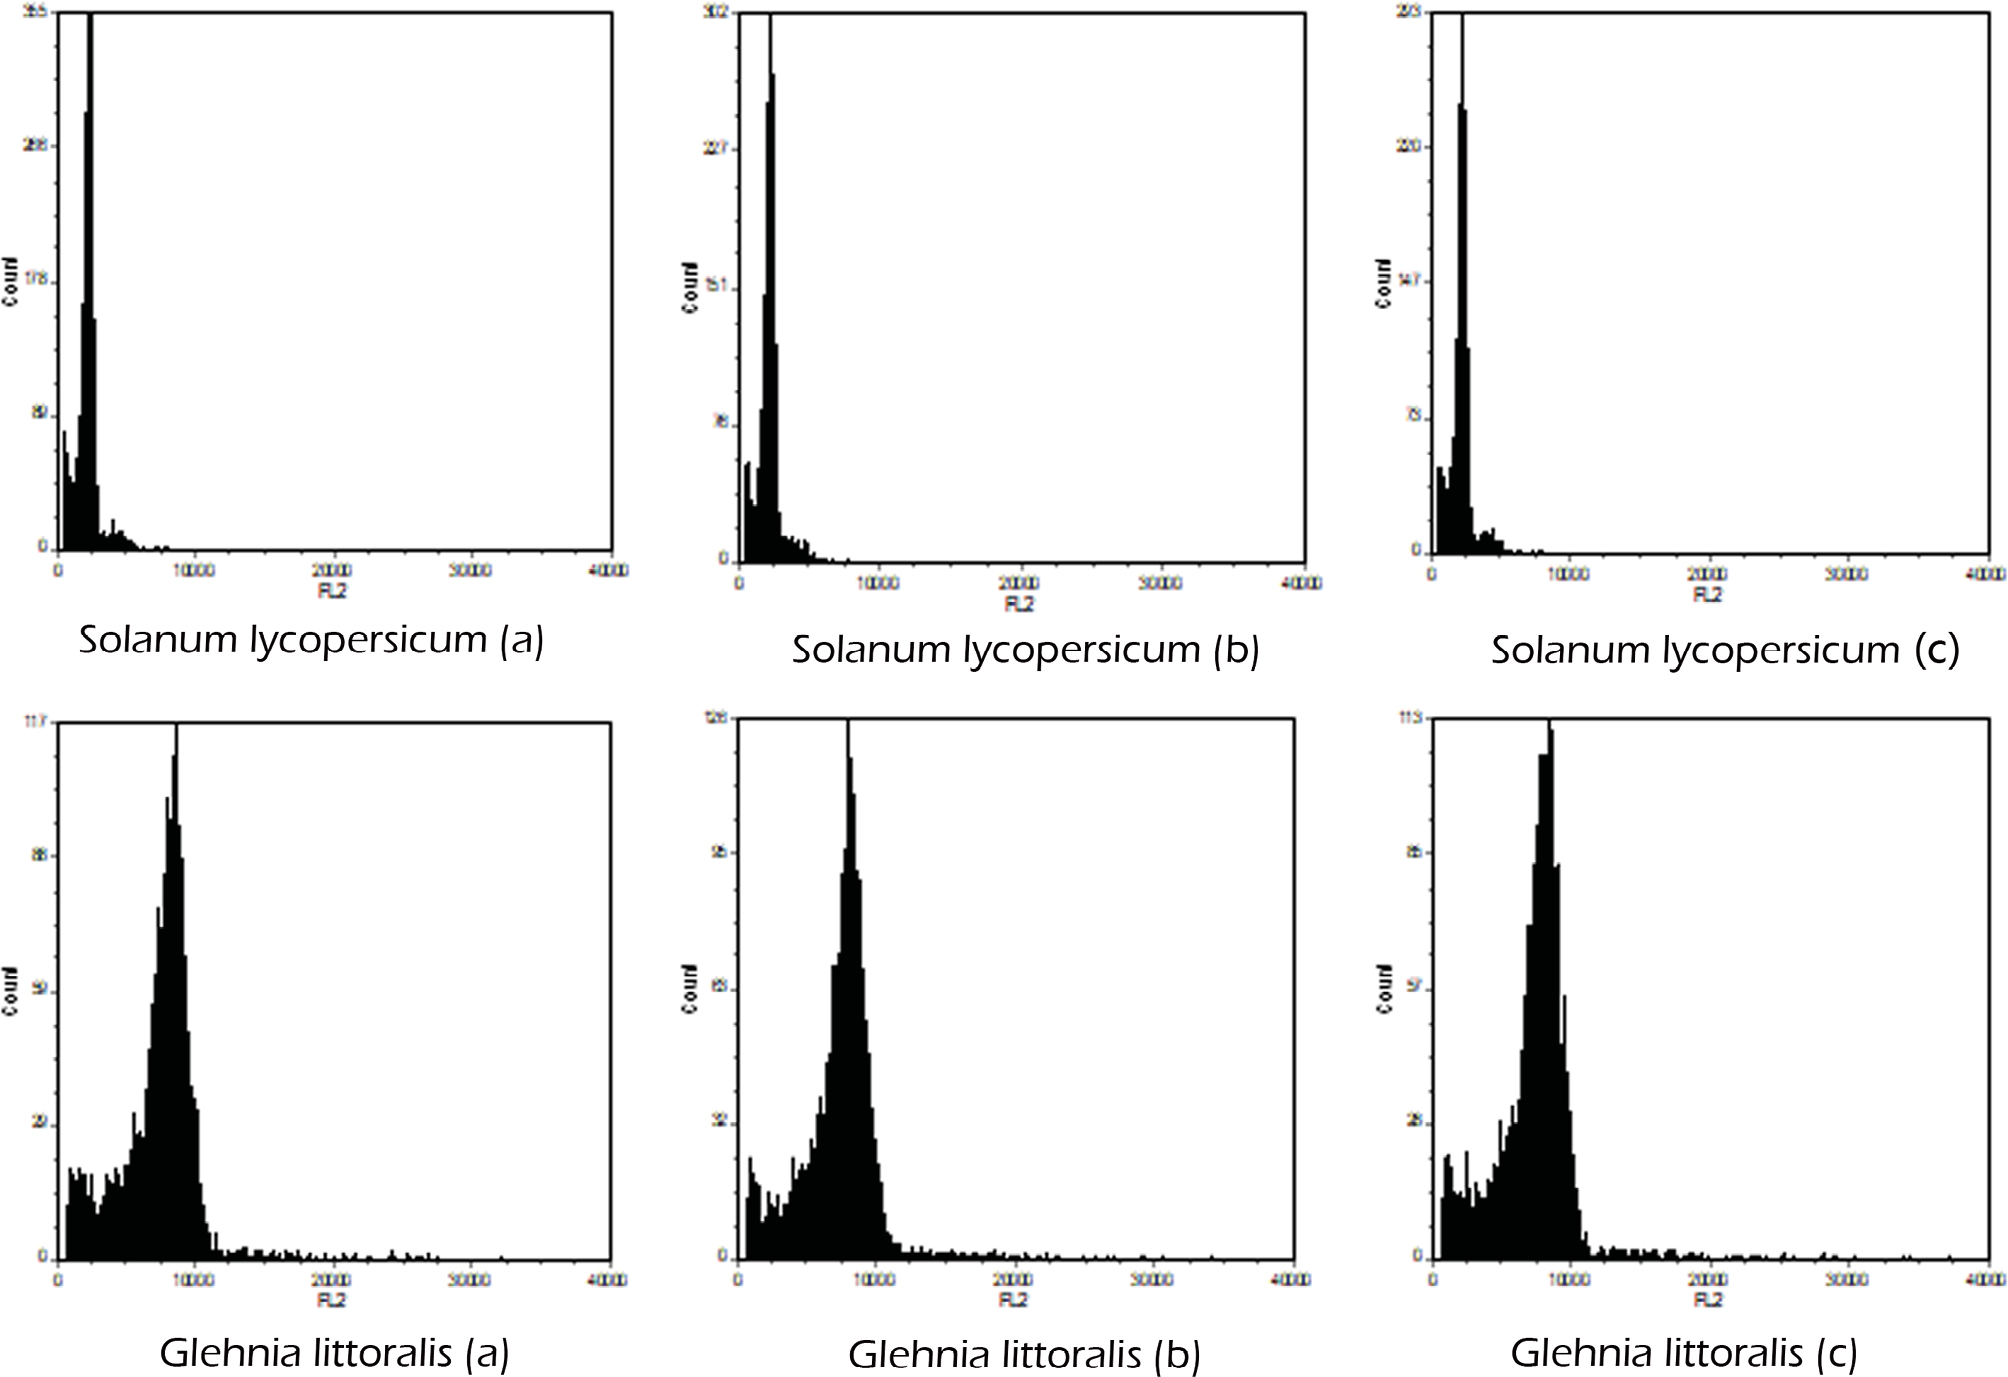
Based on the known genome size of tomato, flow cytometry analysis was performed using the internal standard method. Nuclei suspensions prepared from a mixture of tomato and G. littoralis tissues were stained with propidium iodide (PI), and fluorescence intensity was measured through the FL2 channel. Six parallel measurements were performed. The recorded fluorescence intensity values for tomato were 2442.94, 2437.22, and 2289.72, while those for G. littoralis were 8458.73, 8411.83, and 8376.04. Based on these measurements and using tomato as the reference, the estimated genome size of G. littoralis was calculated to be 2913.44 Mb (Fig. 1).
3.2. Quality assessment of G. littoralis sequencing
Statistical analysis of the high-throughput sequencing data revealed that the raw dataset contained approximately 1.398 billion reads, totaling about 2096.55 Gb of bases, with a GC content of 37.35%. The quality scores Q20 and Q30 reached 98.66% and 95.81%, respectively. After quality filtering, the clean data showed a slight reduction, with a total base count of 2084.95 Gb and a marginal decrease in GC content to 37.27%. Notably, the Q20 and Q30 values remained nearly unchanged at 98.66% and 95.80%, respectively (Tab. 1). Overall, the sequencing data exhibited high quality, and the filtering process had minimal impact on data volume.
| Type | Num_seqs | Sum_len | GC_content(%) | Q20(%) | Q30(%) |
|---|---|---|---|---|---|
| Raw data | 1,397,696,990 | 209,654,548,500 | 37.35 | 98.66 | 95.81 |
| Clean data | 1,397,677,882 | 208,494,796,176 | 37.27 | 98.66 | 95.80 |
To assess potential contamination in the sequencing data, the first 50,000 reads were extracted and subjected to nucleotide homology analysis using the NT database (version: 202107). Sequence alignment was performed with the BLASTN tool (version: 2.11.0+) using the parameters: -evalue 1e-5 -max_target_seqs 1. The results showed that 11,162 out of the 50,000 reads matched entries in the database. Taxonomic classification revealed that the majority of matched reads (5,271) aligned to Daucus carota subsp. sativus, and the remaining top hits were also members of Apiaceae or Araliaceae (Tab. 2). Based on these annotations, no significant evidence of exogenous contamination was detected in the analyzed sample (Liu et al., 2013).
| Species | Family | Reads | Percentage (%) |
|---|---|---|---|
| Daucus carota subsp. sativus | Apiaceae | 5271 | 10.54 |
| Daucus carota | Apiaceae | 1772 | 3.54 |
| Ligusticum thomsonii | Apiaceae | 521 | 1.04 |
| Glehnia littoralis | Apiaceae | 497 | 0.99 |
| Hydrocotyle vulgaris | Araliaceae | 302 | 0.60 |
| Hedera helix | Araliaceae | 191 | 0.38 |
| Angelica dahurica | Apiaceae | 173 | 0.35 |
| Ligusticopsis scapiformis | Apiaceae | 133 | 0.27 |
| Zizia aurea | Apiaceae | 108 | 0.22 |
3.3. Genome size estimation based on K-mer analysis
To provide a comprehensive evaluation and avoid biases from model assumptions, we fitted both a diploid model (p = 2) and a tetraploid model (p = 4) to the data (Tab. 3, Fig. 4). Based on the k-mer analysis under different ploidy assumptions, the diploid model (p = 2) and the tetraploid model (p = 4) yielded markedly different estimates (Tab. 3). The diploid model predicted a genome size of approximately 2,465 Mb with a very low heterozygosity of 1.15% and a repeat content of 80.87%. In contrast, the tetraploid model produced a much smaller genome size estimate of ~1,231 Mb, together with a higher heterozygosity (8.6%) and a repeat content of 82.5%.
| P | K-mer | K-mer number | K-mer depth | Genome size(Mb) | Heterozygous ratio(%) | Duplication ratio(%) |
|---|---|---|---|---|---|---|
| 2 | 19 | 140,160,192,996 | 57.2 | 2465.15 | 1.15 | 80.87 |
| 4 | 19 | 140,160,192,996 | 114.4 | 1230,71 | 8.6 | 82.5 |
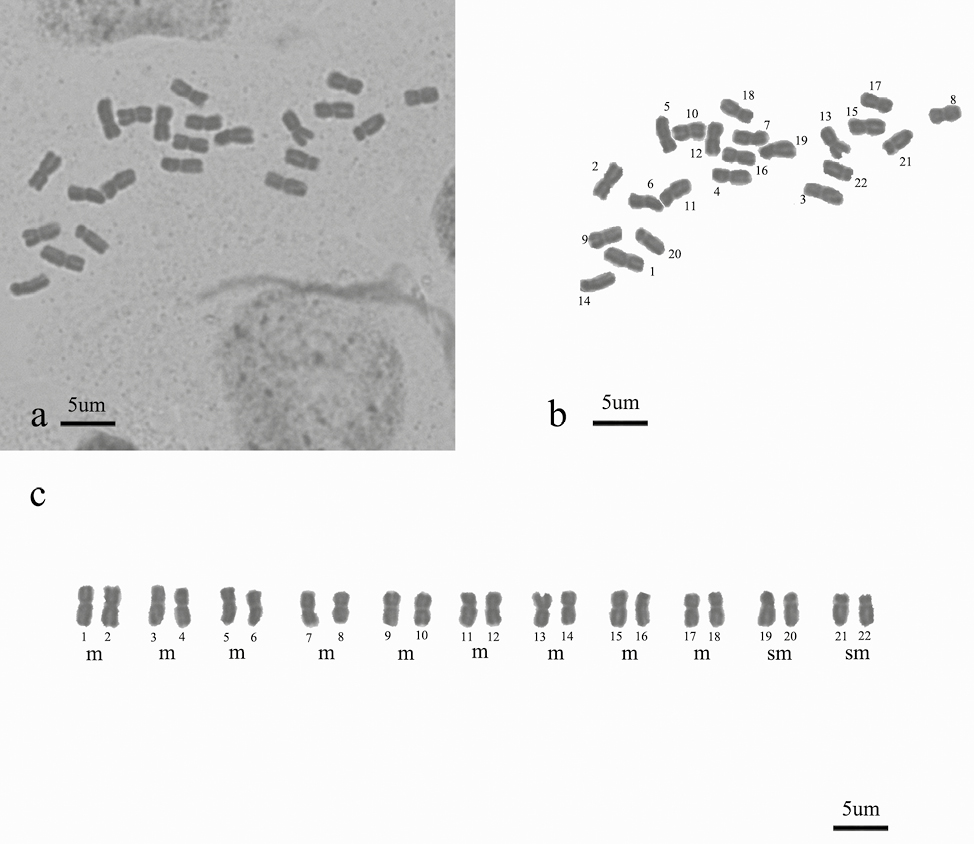
The distinct k-mer peak distributions for the two models were illustrated in Figure 2, with an average k-mer coverage of 28.6×, indicating sufficient sequencing depth for reliable genome characterization. The k-mer spectrum analysis under the diploid model (p = 2) shows a dominant homozygous peak (aa = 98.8%) and a smaller heterozygous peak (ab = 1.15%), reflecting a genome with low heterozygosity. The estimated genome size is approximately 2.47 Gbp, with a unique sequence proportion of 19.1% and repeat content of 80.87%. In contrast, the tetraploid model (p = 4) predicts a smaller genome size of 1.23 Gbp and higher heterozygosity (8.6%), with a slightly higher duplication ratio (82.5%).
3.4. Analysis of ploidy
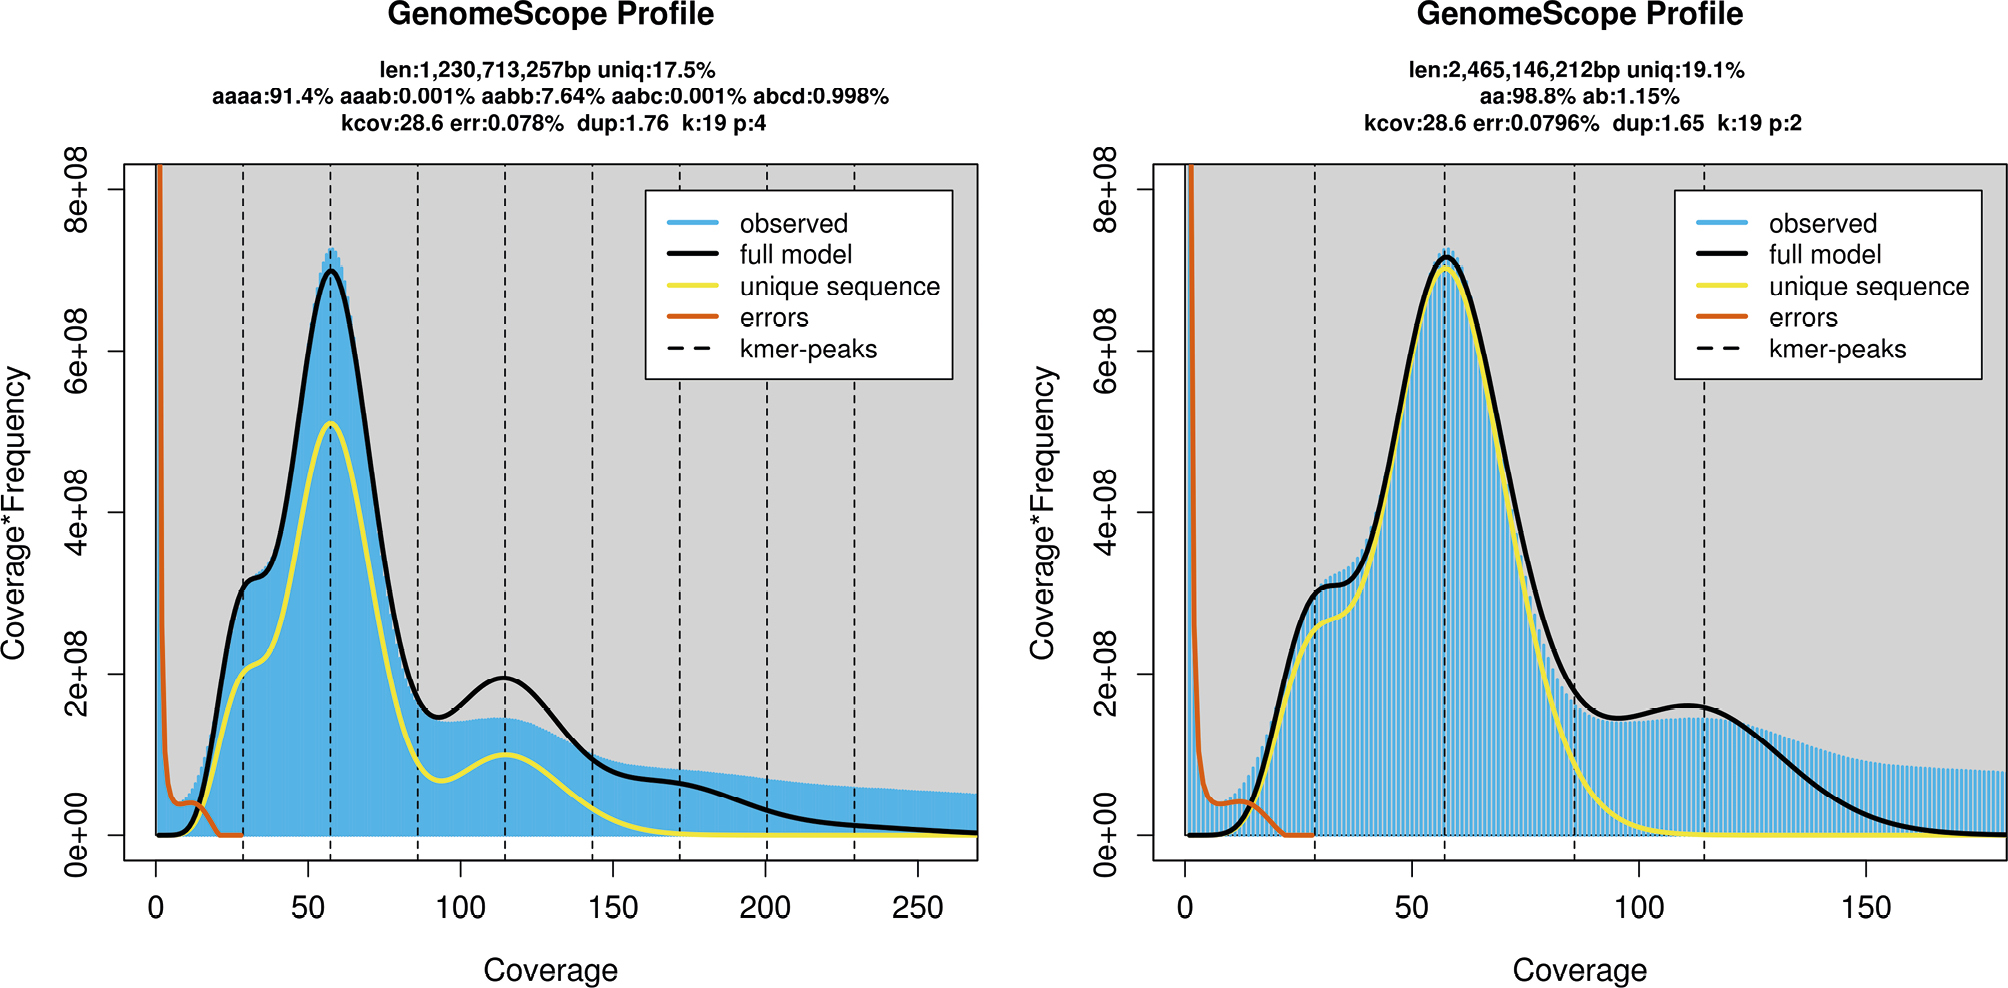
To further investigate the ploidy state, a Smudgeplot analysis was generated (Fig. 3). Smudgeplot analysis revealed a series of distinct k-mer patterns, annotated as AAAAABB, AAAABB, AABB, and AB. Quantitative analysis of these patterns showed that the AABB class was the most abundant, representing 59% of the identified k-mers (8,694,820), followed by the AB class at 31% (4,586,615 k-mers). Higher-ploidy patterns (AAAABB and AAAAABB) together accounted for 10% of the total k-mers. The predominance of the balanced AABB pattern, along with the specific proportions of the other classes, supports the interpretation of a complex genome structure consistent with an allopolyploid organization.
3.5. Karyotype analysis
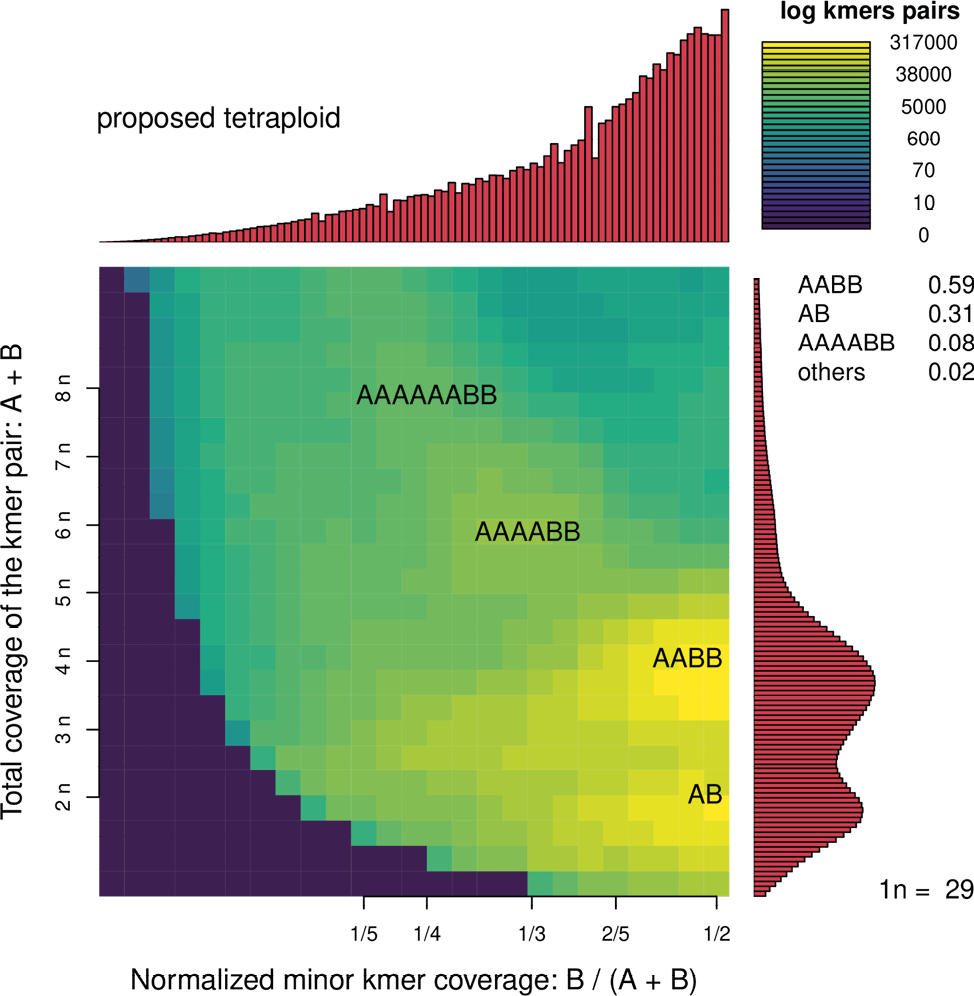
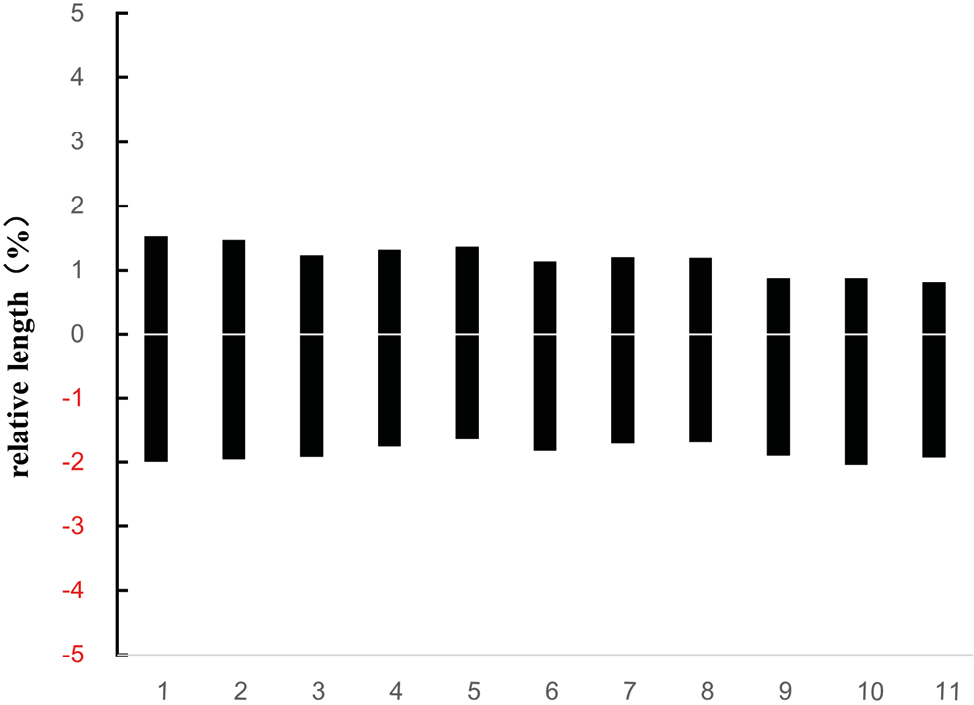
To validate the results from flow cytometry and k-mer analyses, the morphological characteristics of metaphase chromosomes and the karyotype of G. littoralis root tip cells are shown in Figure 4, with the corresponding ideogram presented in Figure 5. The chromosome number was determined to be 2n = 22, with a basic chromosome number of x = 11. The karyotype formula is 2n = 2x = 18m + 4sm, indicating that the complement consists of chromosomes with median (m) and submedian (sm) centromeres. Chromosome lengths ranged from 0.79 to 2.15 μm, with a total haploid chromosome length of 67.30 μm. The interchromosomal asymmetry index (A2) was 0.71, and the intrachromosomal asymmetry index (A1) was 0.33. No distinct bimodality or satellite chromosomes were observed, and the karyotype was classified as type 2A according to Stebbins’ system (Stebbins, 1971).
4. Discussion
We conducted a comprehensive assessment of the genome of G. littoralis using flow cytometry, k-mer frequency analysis, and karyotype observation. Flow cytometry indicated that the genome DNA content aligns with the expected diploid level. K-mer analysis under the diploid model showed a better fit and provided reasonable estimate of heterozygosity (~1.15%) and repeat content. Compared with the tetraploid model, the diploid interpretation is more consistent with the observed peak patterns, genome size estimates, and cytological evidence, making it a more biologically plausible representation of the species’ genomic structure. Karyotype analysis likewise showed no signs of homologous chromosome polyploidy. Taken together, these independent lines of evidence consistently indicate that G. littoralis is a diploid species (2n = 22, x = 11), with an estimated genome size of approximately 2,913.44 Mb. This result is in agreement with previous cytogenetic studies on Glehnia populations from Jiangsu, Shandong and Hebei (Liu et al., 1999; Zhou et al., 2022).
Smudgeplot analysis suggested an apparent allotetraploid genome for G. littoralis, which contrasts with cytological and k-mer evidence supporting a diploid state. This discrepancy likely results from the combination of high repetitive content (~80%) and low-level heterozygosity (~1.15%). In such a genome, k-mer pairs from repetitive regions can produce complex frequency patterns resembling the AABB distribution of a tetraploid, causing Smudgeplot to misclassify the ploidy. The method is also sensitive to input parameters, including k-mer size and coverage thresholds, which can contribute to the misinterpretation. Consequently, the apparent tetraploid signal should be viewed as a false positive, reflecting genome complexity rather than true polyploidy, underscoring the importance of multiple lines of evidence in ploidy assessment (Ranallo-Benavidez, 2020).
Genome size, also referred to as the DNA C-value, represents the total amount of DNA contained within a haploid nucleus of a species. It is one of the most fundamental parameters reflecting the genetic diversity of a species, providing critical reference information for whole-genome sequencing strategies, the exploration and utilization of genetic resources, as well as studies on phylogenetics and ecological adaptation. Genome size exhibits remarkable diversity among plants, and this variation is closely associated with plant evolution and adaptability (Bennett et al., 2005; Zavesky et al., 2005; Bainard et al., 2013).
The Apiaceae family comprises approximately 452 genera and 4,000 species. Genome sizes (C-values) exhibit considerable variation within the family, ranging from about 0.44 pg/1C in Berula erecta (Huds.) Coville to 6.57 pg/1C in Portenschlagiella ramosissima (Port.) Tutin (Leitch et al., 2019). The genome size of Glehnia littoralis is estimated at ~2.91 Gbp (approximately 2.98 pg), exceeding that of roughly 70% of the listed Apiaceae species and placing it among the taxa with relatively large genomes within the family.
Generally, an increase in genome size is often linked to events such as gene duplication and transposable element amplification, which may contribute additional genetic material for adaptive evolution during the course of plant diversification (Lee and Kim, 2014). Previous studies have shown that the Apiaceae family underwent two whole-genome duplication (WGD) events: the first occurred in the common ancestor of the family approximately 54–61 Ma ago, and the second was specific to the subfamily Apioideae, around 45–52 Ma ago (Bai et al., 2024; Li et al., 2020; Liu et al., 2021). It has been found that the duplicated genes resulting from these two WGD events exhibit significant imbalances in gene loss and expression levels, as exemplified by the coriander (Coriandrum sativum) genome.
Although traditionally considered a relatively primitive taxon, molecular evidence indicates that Glehnia is actually a more derived lineage of Selineae within the subfamily Apioideae (Xie et al., 2022), which also includes genera such as Angelica, Cnidium, Saposhnikovia, Peucedanum, and Melanosciadium. Notably, it occupies an upper branch of the phylogeny, with an estimated origin of approximately 5.94 Ma, representing a relatively recent divergence. In terms of its genome, G. littoralis maybe underwent two ancestral whole-genome duplication (WGD) events, which provided a foundation of duplicated genes. As a result, the species exhibits a high duplication ratio (~80.87%), reflecting abundant repetitive elements likely derived from both historical WGD events and transposon accumulation. Meanwhile, its relatively low heterozygosity (Heterozygous Ratio ~1.15%) suggests that the species may have experienced a recent bottleneck or increased selfing, resulting in a fairly homogeneous genome.
Moreover, genome size variation may be associated with ecological adaptability. Variation in genome size and structure in G. littoralis may be closely linked to responses to abiotic stresses, such as salinity, drought, and UV radiation (Tamura et al, 2022). Most lineages of Selineae retain the basic chromosome number x = 11, which indicates a relatively conservative pattern of chromosome evolution within the tribe and supports its recognition as a phylogenetically coherent and stable lineage. This cytological feature also provides important evidence for understanding intratribal relationships and evolutionary history within Selineae. Notably, these genomic features align with morphological traits commonly observed in Selineae. Members of the tribe often produce larger yet relatively light fruits, frequently with widely winged marginal ribs, which tend to occur in tall, robust umbellifers. Together, these characteristics may facilitate more effective dispersal and contribute to adaptation to open or windy habitats (Wen et al., 2021).
In summary, comparative studies on chromosome number and genome size not only enhance our understanding of the evolutionary dynamics within Apiaceae but also provide strong evidence supporting the phylogenetically basal position of Glehnia. Integration of cytogenetic, genomic, and phylogenetic data allows for a more comprehensive understanding of its evolutionary significance within the family.
Conclusion
G. littoralis, a critically endangered coastal plant restricted to sandy beach habitats, is a diploid species (2n = 22, x = 11) with an estimated genome size of ~2,913 Mb, as determined by integrated analyses including flow cytometry, k-mer profiling, Smudgeplot, and cytogenetics. K-mer analysis under a diploid model revealed heterozygosity (1.15%) and a high repeat content (80.87%), indicating a relatively homogeneous yet highly repetitive genome, likely shaped by historical whole-genome duplication events and transposon expansion. Cytogenetic analysis further confirmed a karyotype of 2n = 2x = 18m + 4sm, corroborating the diploid genome organization. The combination of these genomic insights not only advances our understanding of the evolutionary history of this rare Apiaceae lineage but also highlights the genetic basis underlying its adaptation to extreme coastal environments. Given its restricted distribution and critical conservation status, these findings are particularly valuable for informing targeted conservation strategies and elucidating the molecular mechanisms that support survival in highly specialized, vulnerable habitats.
Acknowledgments
The authors thank Haoran Zhuang and Jingling of Huaiyin Institute of Technology for their enthusiastic assistance and strong support during our field investigations.
Funding
This research was funded by National Key R&D Program, grant number 2024YFF1307400 and National Natural Science Foundation of China, grant number 32370220.
Contributions
All authors contributed to the study conception and design.
Yi Zhong: Methodology, Validation, Software.
Hui-Min Li: Data curation, Formal analysis, Writing – Review & Editing.
Jun Wen, Bao-Cheng Wu, Wei Zhou: Investigation.
Nai-Wei Li, Chun-Feng Song: Conceptualization, Writing – Original Draft, Writing – Review & Editing.
All authors have read and approved the final version of the manuscript.
Ethics declarations
All sampling procedures were conducted in accordance with the principles established by the Convention on Biological Diversity and the Regulations on Wild Plant Protection of the People’s Republic of China. In this study, only a small amount of leaf and root tissues was collected, which did not exert any adverse impact on the survival and reproduction of wild populations. Since no human participants were involved, the necessity of obtaining consent for participation was not applicable.
References
Assessment Team for China’s Biodiversity Red List: Higher Plants. (2013). China’s biodiversity red list: Higher plants. Beijing: Science Press.
Bai, M. Z., Jiang, S. J., Chu, S. S., et al. (2024). The telomere-to-telomere (T2T) genome of Peucedanum praeruptorum Dunn provides insights into genome evolution and coumarin biosynthesis. GigaScience, 13, giae025.
Bainard, J. D., & Villarreal, J. C. (2013). Genome size increases in recently diverged hornwort clades. Genome, 56(8), 431–435.
Bennett, M. D., & Leitch, I. J. (2005). Plant genome size research: A field in focus. Annals of Botany, 95(1), 1–6.
Cock, P. J., Fields, C. J., Goto, N., et al. (2010). The Sanger FASTQ file format for sequences with quality scores, and the Solexa/Illumina FASTQ variants. Nucleic Acids Research, 38(6), 1767.
David, F. S., Antonio, R. C. J., de Jesus, P. B. J., Francisco, S. B. U., Jennifer, S. H., Alfredo, C. R., … & Lucina, B. M. (2024). Evaluation of ploidy and the DNA index by flow cytometry in central nervous system tumors: a review. Molecular Biology Reports, 51(1), 1141.
Dolezel J (2005) Plant DNA Flow Cytometry and Estimation of Nuclear Genome Size. Ann Bot 95:99–110.
Doležel, J., Greilhuber, J., & Suda, J. (2007). Estimation of nuclear DNA content in plants using flow cytometry. Nature Protocols, 2(9), 2233–2244.Fu, L. G. (1992). China plant red data book: Rare and endangered plants (p. 699). Beijing: Science Press.
Gong, N., Tian, X. M., & Zhou, X. Y. (2011). Applications of flow cytometry in plant research—Analysis of nuclear DNA content and ploidy level in plant cells. Chinese Agricultural Science Bulletin, 27(9), 21–27.
Han, X. X., Li, C., Sun, S. C., et al. (2022). The chromosome-level genome of female ginseng (Angelica sinensis) provides insights into molecular mechanisms and evolution of coumarin biosynthesis. Plant Journal, 112, 1224–1237. https://doi.org/10.1111/tpj.16007
Iorizzo, M., Ellison, S., Senalik, D., et al. (2016). A high-quality carrot genome assembly provides new insights into carotenoid accumulation and asterid genome evolution. Nature Genetics, 48(6), 657–666.
Lee, S. I., Kim, N. S. (2014). Transposable elements and genome size variations in plants. Genomics & informatics, 12(3), 87.
Leitch, I. J., Johnston, E., Pellicer, J., et al. (2019). Angiosperm DNA C-values database (release 9.0, Apr 2019). https://cvalues.science.kew.org. Accessed 29 July 2025.
Levan, A., Fredga, K., & Sandberg, A. A. (1964). Nomenclature for centromeric position on chromosomes. Hereditas, 52, 201–220.
Li, M. Y., Feng, K., Hou, X. L., et al. (2020). The genome sequence of celery (Apium graveolens L.), an important leaf vegetable crop rich in apigenin in the Apiaceae family. Horticulture Research, 7, 9. https://doi.org/10.1038/s41438-019-0235-2
Liu B H, Shi Y J, Yuan J Y, et al. (2013). Estimation of genomic characteristics by analyzing k-mer frequency in de novo genome projects. Quantitative Biology, 35(s1–3), 62–67.
Liu, J.-X., Jiang, Q., Tao, J.-P., et al. (2021). Integrative genome, transcriptome, microRNA, and degradome analysis of water dropwort (Oenanthe javanica) in response to water stress. Horticulture Research, 8, 262. https://doi.org/10.1038/s41438-021-00707-8
Liu, Q. X., Hui, H., & Liu, M. H. (1999). Chromosomal characteristics and evolutionary status of a rare and endangered plant Glehnia littoralis. Guihaia, (4), 344–348.
Loureiro, J., Čertner, M., Lučanová, M., Sliwinska, E., Kolář, F., Doležel, J., … & Galbraith, D. W. (2023). The use of flow cytometry for estimating genome sizes and DNA ploidy levels in plants. Plant cytogenetics and cytogenomics: methods and protocols (pp. 25-64). New York, NY: Springer US.
Marcais, G., & Kingsford, C. (2011). A fast, lock-free approach for efficient parallel counting of occurrences of k-mers. Bioinformatics, 27(6), 764–770.
Ministry of Environmental Protection & Chinese Academy of Sciences. (2013). China red list of biodiversity: Higher plants [Internal document].
Mumbrú, M., Garnatje, T., Vallès, J. (2025). Methods of internal standards’ preservation for genome size assessments: a comparative study. Caryologia, 78(1), 53-58.
National Forestry and Grassland Administration & Ministry of Agriculture and Rural Affairs. (2021, September 7). National key protected wild plants list (Announcement No. 15; approved by the State Council on August 7, 2021).
Radmanesh, P., Karimzadeh, G. (2025). Chromosome, ploidy analysis, and flow cytometric genome size of caper (Capparis spinosa) medicinal plant. Caryologia, 78(2), 3-19.
Shan, R. H., & She, M. L. (1979). Umbelliferae III: Flora of China (Vol. 55, p. 316). Beijing: Science Press.
Song, X., Wang, J., Li, N., et al. (2020). Deciphering the high-quality genome sequence of coriander that causes controversial feelings. Plant Biotechnology Journal, 18, 1444–1456. https://doi.org/10.1111/pbi.13310
Stebbins, G. L. (1971). Chromosomal evolution in higher plants. London: Edward Arnold.
Tamura, Y., Kubo, N., & Ohsako, T. (2022). Genetic diversity among Japanese local populations of an edible and medicinal coastal plant Glehnia littoralis F. Schmidt ex Miq. Genetic Resources and Crop Evolution, 69(1), 85–97.
Su X, Wang BA, Geng XL, Du YF, Yang QQ, Liang B et al (2021) A high-continuity and annotated tomato reference genome. BMC Genomics 22:898.
The Angiosperm Phylogeny Group. (2016). An update of the Angiosperm Phylogeny Group classification for the orders and families of flowering plants: APG IV. Botanical Journal of the Linnean Society, 181, 1–20.
Vurture, G. W., Sedlazeck, F. J., Nattestad, M., et al. (2017). GenomeScope: Fast reference-free genome profiling from short reads. Bioinformatics, 33(14), 2202–2204.
Wang, Y.-H., Liu, P.-Z., Liu, H., et al. (2023). Telomere-to-telomere carrot (Daucus carota) genome assembly reveals carotenoid characteristics. Horticulture Research, 10, uhad103. https://doi.org/10.1093/hr/uhad103
Wen, J., Xie, D.-F., Price, M., et al. (2021). Backbone phylogeny and evolution of Apioideae (Apiaceae): New insights from phylogenomic analyses of plastome data. Molecular Phylogenetics and Evolution, 161, 107183. https://doi.org/10.1016/j.ympev.2021.107183
Xie, D. F., Xie, C., Ren, T., et al. (2022). Plastid phylogenomic insights into relationships, divergence, and evolution of Apiales. Planta, 256, 117. https://doi.org/10.1007/s00425-022-04031-w
Yang, H. X., Chu, J. M., & Zhang, J. T. (2011). Wild plants on the fore-edge of coastal sandy beaches in the Shandong Peninsula. Acta Botanica Boreali-Occidentalia Sinica, 46(1), 50–58.
Zarco, C. R. (1986). A new method for estimating karyotype asymmetry. Taxon, 35(3), 526–530.
Záveský, L., Jarolímová, V., & Štěpánek, J. (2005). Nuclear DNA content variation within the genus Taraxacum (Asteraceae). Folia Geobotanica, 40(1), 91–104.
Zhang, G. F., Xiong, T. S., Sun, T., et al. (2022). Diversity, distribution, and conservation of rare and endangered plants in Jiangsu. Biodiversity Science, 30(2), 21335.
Zhang LM, Yuan JM, Pu TL, Qu WL, Lei X, Ma KH, et al. Chromosome-scale genome assembly of Phyllanthus emblica L. ‘Yingyu.’ DNA Res. 2025;32:dsaf006.
Zhou, C. X., Zhang, J. S., & An, K. (2022). Chromosome karyotype and variation of coral vegetables from different places. Molecular Plant Breeding, 1–11.
Zhu, C. (1982). Plant chromosomes and chromosome techniques (p. 82). Beijing: Science Press.